Gubbins D., Herrero-Bervera E. Encyclopedia of Geomagnetism and Paleomagnetism
Подождите немного. Документ загружается.

The development of software for the interpretation of data like these
in 3D is progressing and is clearly needed. Everett and Edwards
(1993) and Unsworth et al. (1993) have 2.5D programs available in
both frequency and time domains.
Buried chann els, New Jersey
The marine EM group at the Woods Hole Institution of Oceanography
and colleagues at the Geological Survey of Canada have built a
small-scale coaxial magnetic dipole-dipole system that is contracted
for mainly shallow geotechnical surveys. The system is a major
improvement of systems described by Cheesman et al. (1990, 1991)
and Webb and Edwards (1995). Among many other geological pro-
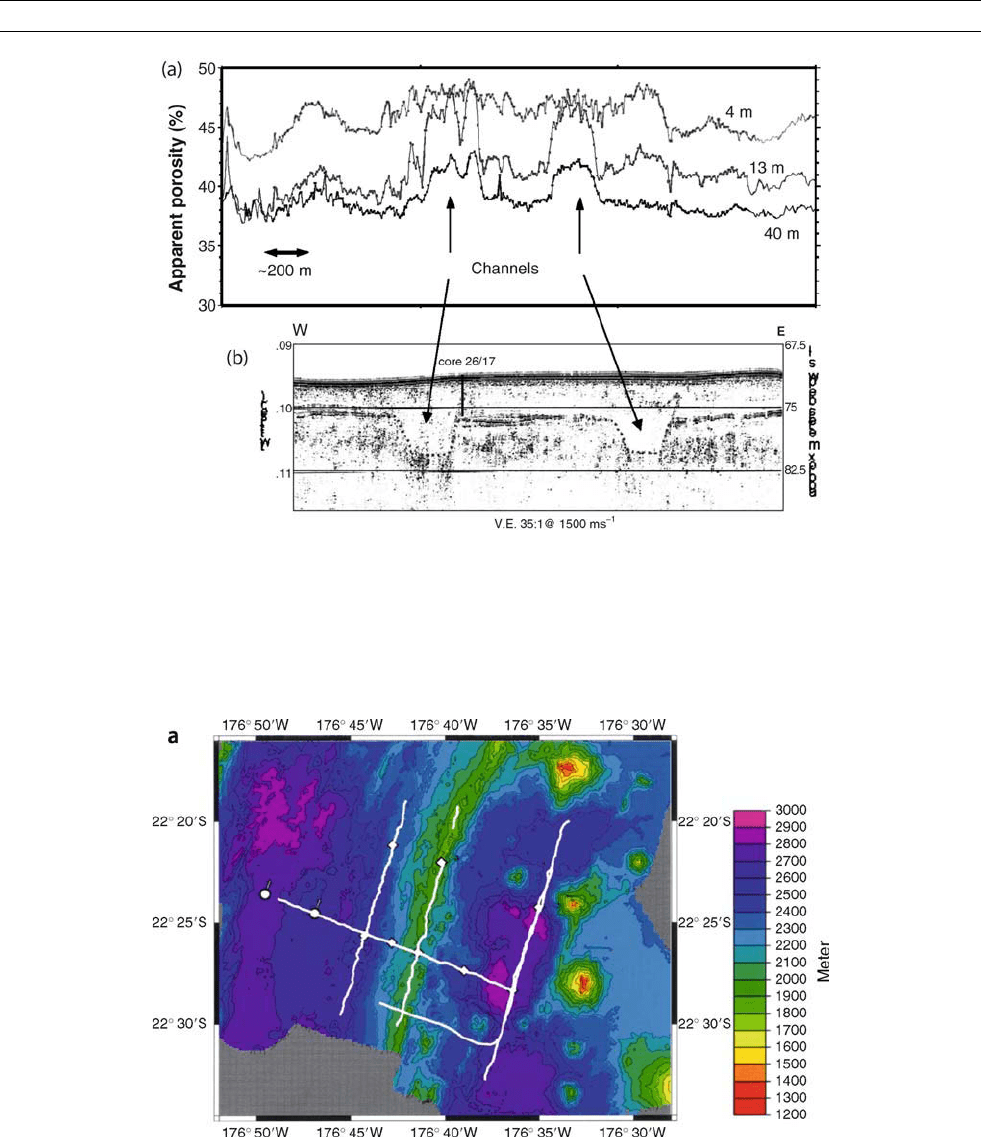
blems, they investigated the nature of the infill in a buried channel off-
shore New Jersey (Evans et al., 2000). The buried channel represents
one example of a feature in a shallow section that is analogous to a
feature seen in deeper oil-bearing strata. The magnetic dipole system
is dragged in contact with the seafloor. The three transmitter-receiver
spacings are 4, 13, and 40 m.
Data collected in the frequency domain were processed to give an
apparent porosity for each spacing. The maximum depth of investiga-
tion was about 20 m. Bounds on physical properties are greatly aided
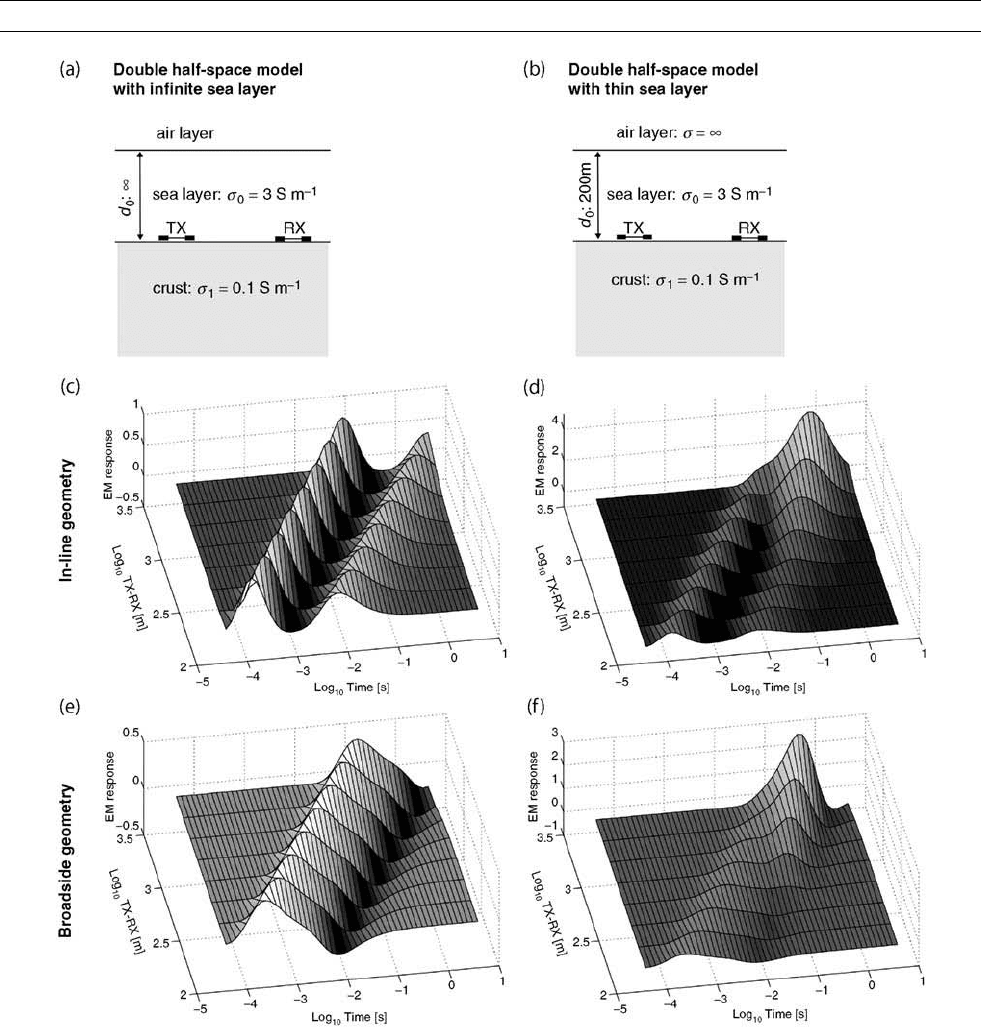
Figure E19 The airwave. The normalized impulse responses of the models in (a) and (b) to an electric dipole-dipole system on the
seafloor are shown as functions of logarithmic time and transmitter-receiver separation. Panels (c) and (d) refer to in-line and
panels (e) and (f) to broadside geometries (after Edwards, 2006).
236 EM, MARINE CONTROLLED SOURCE
by complementary seismic survey. The latter identified the structure
but alone offered no information on nature of the infill. The porosity
traces and seismic section are shown in Figure E25a,b. Clearly, there
is an excellent correlation between the buried channels visible on the
seismic section and an increase of porosity. The channels seem to
incise the regional seismic reflector.
Conductivity variations at the mid-ocean ridge
Electrical conductivity varies with the porosity, temperature, degree of
partial melt, and the composition of Earth materials. Nowhere are these
parameters more variable than at the mid-ocean ridge. There are
numerous published case histories of marine CSEM surveys in this
environment. They are often combined with a complementary magne-
totelluric measurements. The reade r is referred to such publications as
Sinha et al. (1997) or Evans et al. (1994). The methodology originated
at Scripps Institution of Oceanography, pioneered by C.S. Cox and
S.C. Constable.
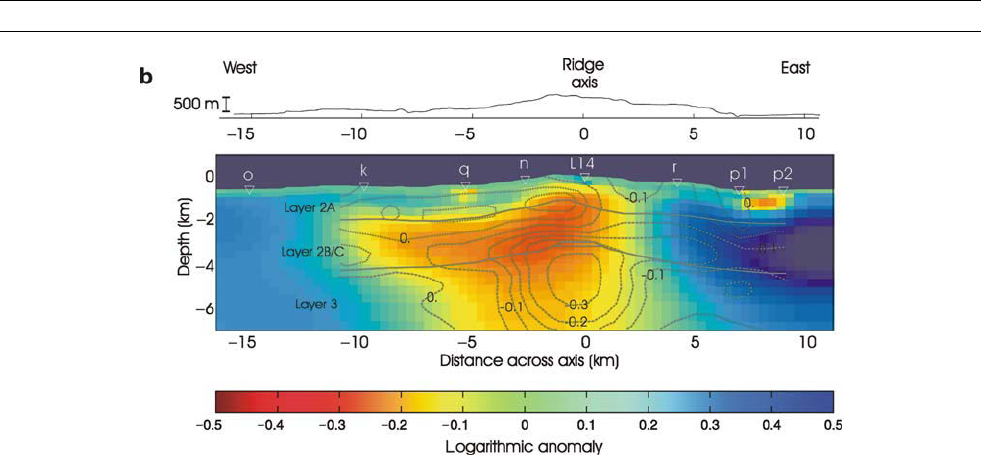
MacGregor et al. (2001) completed a CSEM survey in the vicinity of
the Valu Fa Ridge in the Lau Basin. They used fixed receivers and towed
a horizontal long wire receiver just above the seafloor. Their survey
lines and receiver locations are shown in Figure E26/Plate 15a.
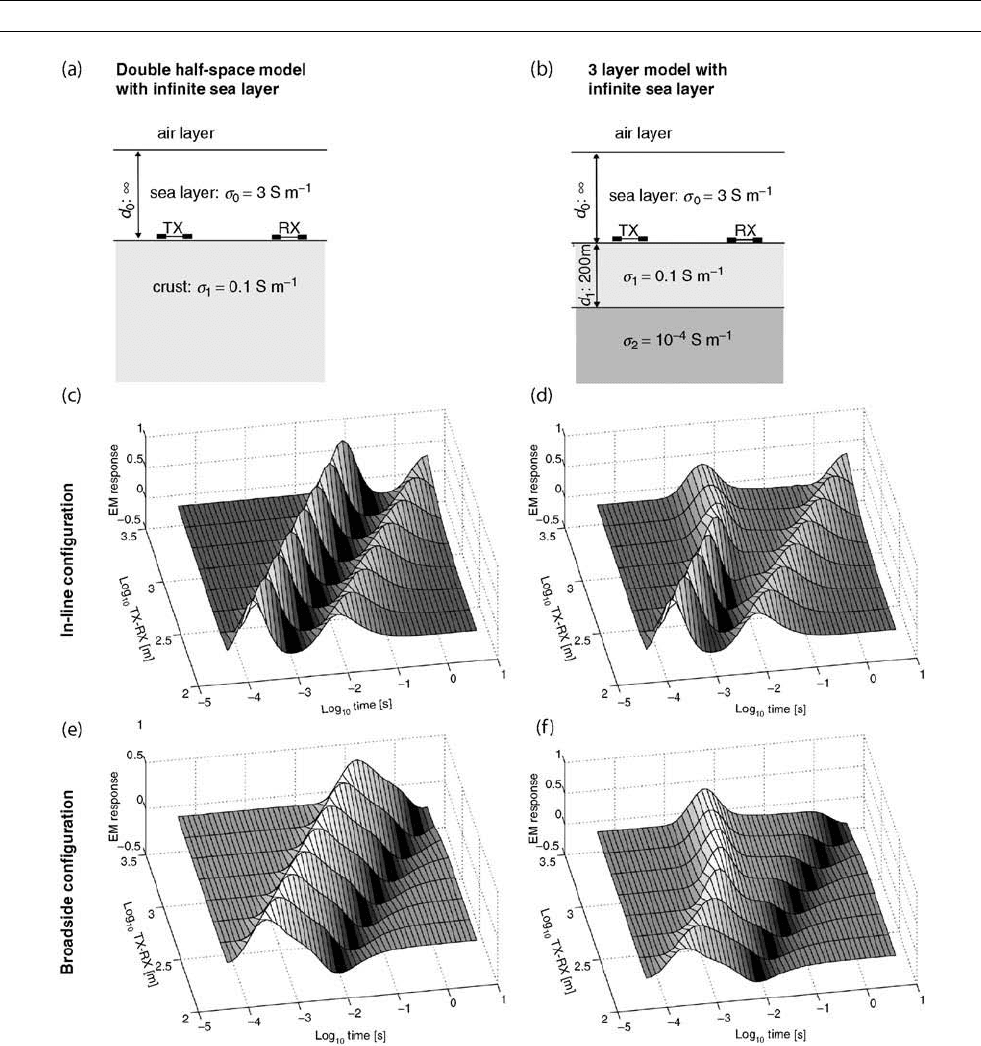
Figure E20 The resistive zone at depth. The normalized impulse responses of the models in (a) and (b) to an electric dipole-dipole
system on the seafloor are shown as functions of logarithmic time and transmitter receiver separation. Panels (c) and (d) refer to in-line
and panels (e) and (f) to broadside geometries (after Edwards, 2006).
EM, MARINE CONTROLLED SOURCE 237
The corresponding analyis of the data is displayed in Figure E27/Plate 15b
as a crustal cross section of the electrical resistivity anomaly across the axis
of the ridge. The colors indicate the deviations (as a logarithmic multipli-
cation factor) from a background model, in which resistivity varies only
with depth beneath the seabed. The dark blue layer at the top represents
the water, with the top of the crust showing as pale green. A large con-
ductive anomaly can be seen at depths of 1 to 6 km beneath the seafloor,
beneath the axis of the ridge, and extending off the axis to the west for
nearly 10 km. The anomaly is interpreted as being due to the presence
of an axial magma chamber, and an overlying region in which the poros-
ity is occupied by highly conductive hydrothermal fluids. Also shown is
a plot of seismic P-wave velocity anomaly (gray contours), calculated
with reference to an equivalent background seismic model, and superim-
posed on the resistivity anomaly. The section was obtained by 2.5D reg-
ularized inversion of frequency domain CSEM data. The uppermost
panel shows the variation in seafloor depth along the profile.
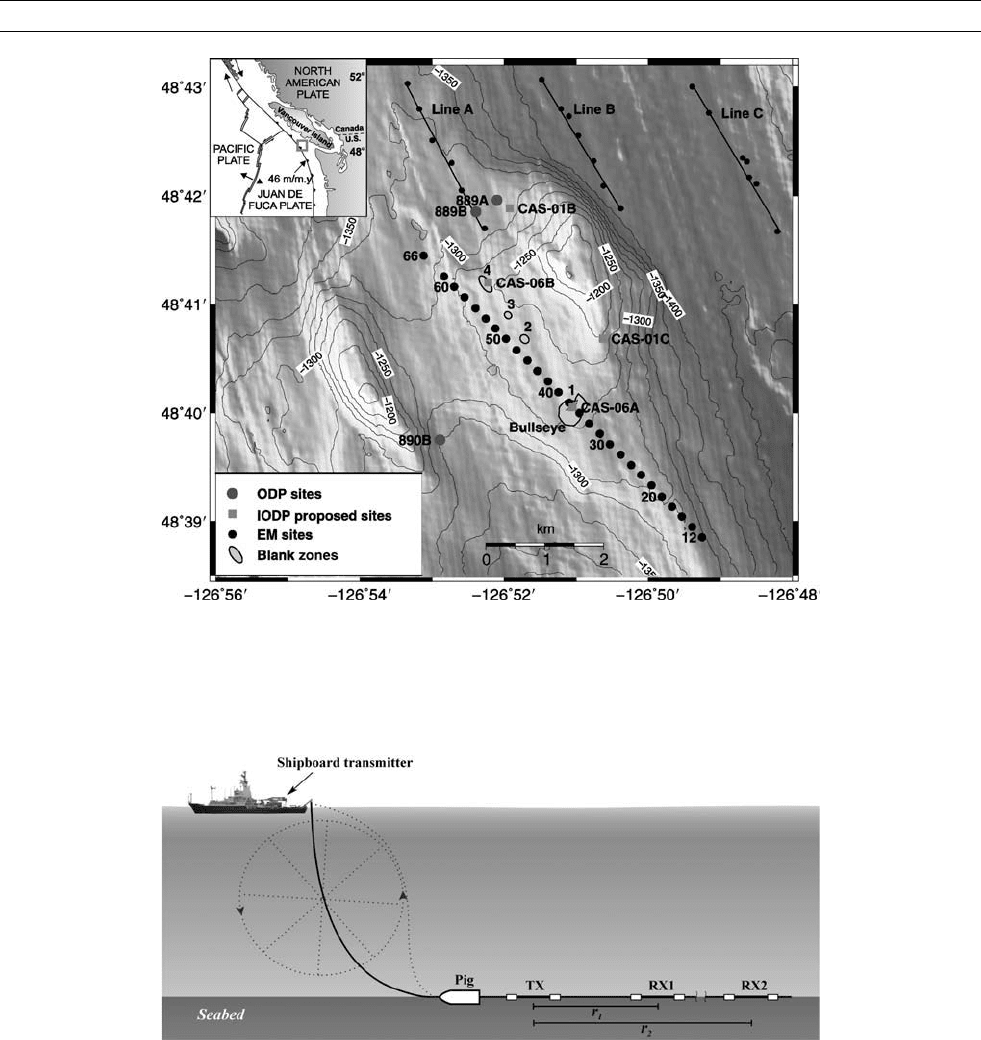
Figure E21 Bathymetry map of the target area on the Cascadia margin. The vent field is located on a bench between two
topographic highs in vicinity of ODP sites 889/890. CSEM measurements were conducted along the profile crossing the Bullseye,
the largest of 4 vent sites. Lines A, B, and C are EM profiles from a previous survey (after Schwalenberg et al., 2005).
Figure E22 Geometry of the in-line dipole-dipole configuration. A current signal is produced by an onboard transmitter and sent
through the coaxial winch cable to the transmitter bipole on the seafloor. Two receiver dipoles at distances r
1
and r
2
record the signal
after it passes through the seawater and the sediments. A heavy weight (pig) attached to the front of the system keeps the array on the
seafloor while moving along the profile. Moving the ship and taking in the winch cable pulls the array forward and causes a vertical
movement of the pig. Solid and dotted line present the winch cable in idle and moving state, respectively. The wheel represents the
curve over which the marine cable appears to move while in motion (after Schwalenberg et al., 2005).
238 EM, MARINE CONTROLLED SOURCE
Comme rcia l outlook
In the last 5 years, there been a surge of interest from the exploration
community in the use of marine CSEM methods for hydrocarbon
exploration (Edwards, 2006). There are marine geological terranes in
which the interpretation of seismic data alone is difficult. There are
regions dominated by scattering or high reflectivity, such as is found
over carbonate reefs, areas of volcanics, and submarine permafrost.
Complementary geophysical techniques are required to study these
regions. EM was at first not high on the list of alternatives. There
was a pervasive belief that the high electrical conductivity of seawater
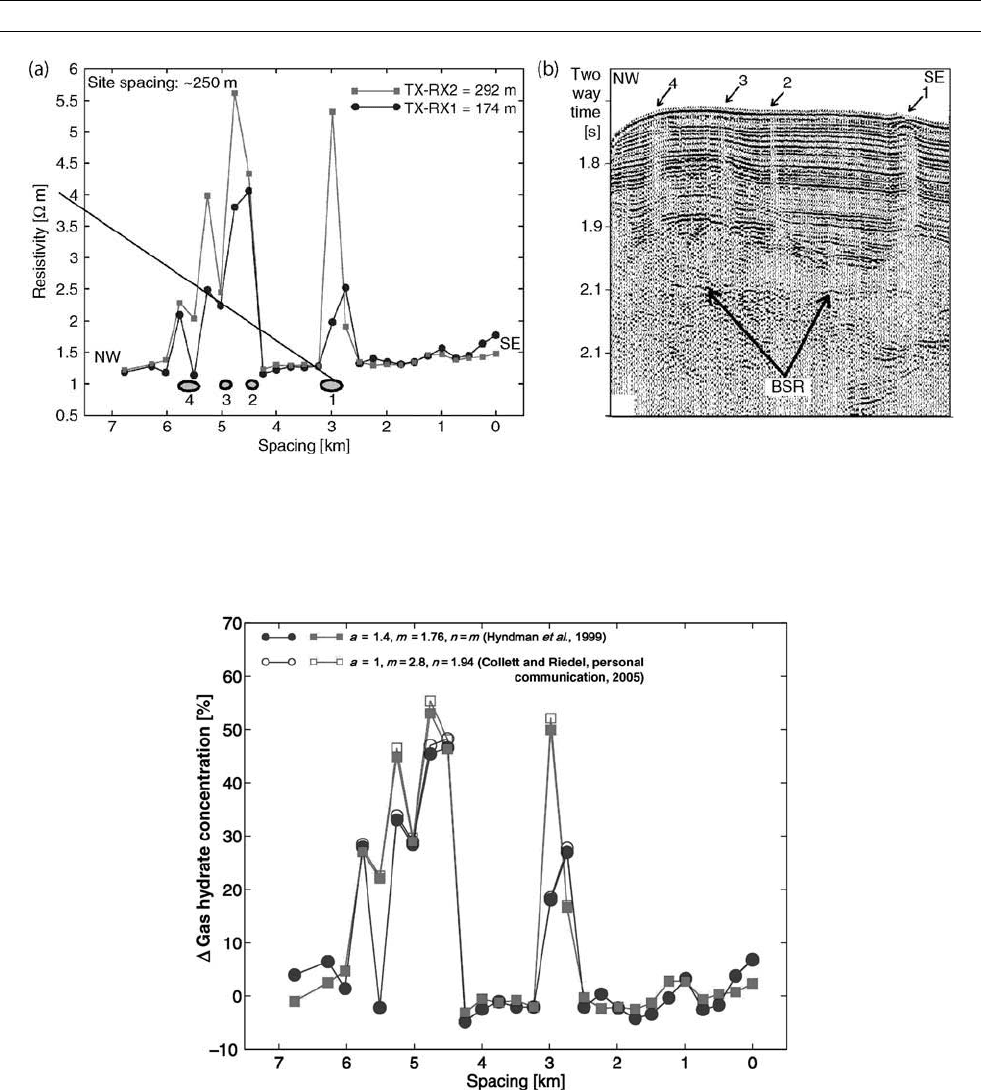
Figure E23 Panel (a) shows the bulk resistivities derived from CSEM data show anomalous resistivities exceeding 5 O m over
background resistivities between 1.1 and of 1.5 O m. The anomalous areas coincide spatially with the surface expression of a series
of seismic blank zones displayed in Panel (b) (after Schwalenberg et al., 2005).
Figure E24 Gas hydrate concentrations derived from Archie’s law using two different sets of Archie coefficients. The first set (a ¼ 1.4,
m ¼ 1.76, n ¼ m) is based on core data from ODP Leg 146 (Hyndman et al ., 2001). A recent reevaluation yielded a second set based
on log data (a ¼ 1, m ¼ 2.8, n ¼ 1.94) (Collett and Riedel, personal communication 2005). In this figure a regional gas hydrate
concentration profile derived from the baseline resistivities in Figure E20b has been subtracted from the “total” hydrate concentrations.
Thus, the profiles represent the additional amount of hydrate and are coincident for both sets of Archie coefficients (after Schwalenberg
et al., 2005).
EM, MARINE CONTROLLED SOURCE 239
precluded the application of EM systems for exploration even though
academics had put forward methods specifically designed for the
marine environment. The tide turned when a few surveys commis-
sioned from universities proved very successful and over the last
5 years, exploration managers and investors have become aware of
the importance of CSEM. Morgan Stanley, a well-known member
of the New York Stock Exchange and Investment Manager, reported
in August 2004 that in their view the implications of CSEM imaging
on offshore drilling, service, and field development activity will be one
of the most frequently discussed topics in the oil service industry over
the next 12 months. They see a growth in annual revenues from a mere
$30 million to $600–900 million in less than 5 years—one quarter of
Figure E25 The magnetic dipole-dipole system has been used to find out the nature of the infill of buried paleochannels on the
New Jersey continental margin. The apparent resistivities recorded at the three receivers shown in Panel (a) have been converted
to apparent porosities using Archie’s law. A clear correlation between locally higher porosities and the seismic image of the
paleo-channels shown in Panel (b) is evident (after Evans et al., 2000).
Figure E26/Plate 15a The CSEM transmitter tracks superimposed on a bathymetry map of the Valu Fa Ridge. The receiver locations are
shown as white dots (courtesy M.C. Sinha).
240 EM, MARINE CONTROLLED SOURCE
the current spending-on offshore seismic and compare the technological
revolution with the growth of 3D seismic in the early 1990s. McBarnet
(2004) summarizes recent commercial activity and identifies the players
involved.
Nigel Edwards
Bibliography
Archie, G.E., 1942. The electrical resistivity log as an aid in determin-
ing some reservoir characteristics. Journal of Petroleum Technol-
ogy, 5:1–8.
Chave, A.D., and Cox, C.S., 1982. Controlled electromagnetic sources
for measuring the electrical conductivity beneath the oceans. Jour-
nal of Geophysical Research, 87: 5327–5338.
Chave, A.D., Constable, S.C., and Edwards, R.N., 1986. Electrical
exploration methods for the seafloor. In Nabighian, M.N. (ed.), Elec-
tromagnetic Methods,Vol.2:Applications. Tulsa, OK: Society of
Exploration Geophysicists.
Cheesman, S.J., Edwards, R.N., and Chave, A.D., 1987. On the theory
of seafloor conductivity mapping using transient electromagnetic
systems. Geophysics, 52: 204–217.
Cheesman, S.J., Edwards, R.N., and Law, L.K., 1990. A short baseline
transient electromagnetic method for use on the seafloor. Geophy-
sical Journal International, 103: 431–437.
Cheesman, S.J., Law, L.K., and Edwards, R.N., 1991. Porosity deter-
minations of sediments in Knight Inlet using a transient electro-
magnetic system. Geomarine Letters, 11:84–89.
Edwards, R.N., 1988. Two-dimensional modelling of a towed electric
dipole-dipole EM system: the optimum time delay for target reso-
lution. Geophysics, 53: 846–853.
Edwards, R.N., 1997. On the resource evaluation of marine gas hydrate
deposits using a seafloor transient electric dipole-dipole method.
Geophysics, 62:63–74.
Edwards, R.N., 2006. Marine controlled source electromagnetics: prin-
ciples, methodologies, future commercial applications. Surveys in
Geophysics, 26: 675–700.
Edwards, R.N., and Chave, A.D., 1986. A transient electric dipole-
dipole method for mapping the conductivity of the seafloor.
Geophysics, 51: 984–987.
Evans, R.L., Sinha, M.C., Constable, S.C., and Unsworth, M.J., 1994.
On the electrical nature of the axial melt zone at 13 N on the East
Pacific Rise. Journal of Geophysical Research, 99:77–88.
Evans, R.L., Law, L.K., St. Louis, B., and Cheesman, S.J., 2000. Bur-
ied paleochannels on the New Jersey continental margin: channel
porosity structures from electromagnetic surveying. Marine Geol-
ogy, 170: 381
–394.
Everett, M.E., and Edwards, R.N., 1993. Transient marine electromag-
netics, The 2–5D forward problem. Geophysical Journal Interna-
tional, 113: 545–561.
Hyndman, R.D., Spence, G.D., Chapman, R., Reidel, M., and
Edwards, R.N., 2001. Geophysical studies of marine gas hydrates
in Northern Cascadia. In Paull, C., and Dillon, W.P. (eds.), Natural
Gas Hydrates: Occurrence, Distribution, and Detection. Geophysi-
cal Monograph Series. Washington, DC: American Geophysical
Union.
Mac Gregor, L., Sinha, M., and Constable, S., 2001. Electrical resistiv-
ity structure of the Valu Fa Ridge, Lau Basin, from marine con-
trolled source electromagnetic sounding. Geophysical Journal
International, 146: 217–236.
McBarnet, A., 2004. All at sea with EM. Offshore Engineer, 29:
20–22.
Schwalenberg, K., Willoughby, E., Mir, R., and Edwards, R.N., 2005.
Marine gas hydrate electromagnetic signatures in Cascadia and
their correlation with seismic blank zones. First Break, 23:57–63.
Sinha, M.C., Navin, D.A., Mac Gregor, L.M., Constable, S.C., Peirce, C.,
White, A., Heinson, G., and Inglis, M.A., 1997. Evidence for accu-
mulated melt beneath the slow-spreading Mid-Atlantic Ridge. Phi-
losophical Transaction of the Royal Society of London, A355:
233–253.
Unsworth, M.J., Travis, B.J., and Chave, A.D., 1993. Electromagnetic
induction by a finite electric dipole source over a 2-D earth. Geo-
physics, 58: 198–214.
Webb, S.C., and Edwards, R.N., 1995. On the correlation of electrical
conductivity and heat flow in Middle Valley, Juan de Fuca Ridge.
Journal of Geophysical Research, 100: 22,523–22,532.
Yu, L., and Edwards, R.N., 1991. The detection of lateral anisotropy of
the ocean floor by electromagnetic methods. Geophysical Journal
International, 108: 433–441.
Yu, L., Evans, R.L., and Edwards, R.N., 1997. Transient electromag-
netic responses in seafloor with tri-axial anisotropy. Geophysical
Journal International, 129: 300–306.
Yuan, J., and Edwards, R.N., 2000. The assessment of marine gas
hydrate through electrical remote sounding, hydrate without a
BSR? Geophysical Research Letters, 27: 2397–2400.
Figure E27/Plate 15b A section through the Valu Fa Ridge showing the logarithmic variation in electrical conductivity and the anomaly
in seismic P-wave velocity as color shading and black contours respectively (courtesy M.C. Sinha).
EM, MARINE CONTROLLED SOURCE 241

EM, REGIONAL STUDIES
Introduction
Images of the electrical conductivity can help decipher the architecture
of the Earth's interior. The magnetotelluric (q.v.) method (MT) is
one of the few tools capable of imaging from the Earth's surface
through to the mantle. Regional studies of EM are conducted to image
the conductivity distribution of the subsurface on the scale of a few
kilometers to hundreds of kilometers, both in lateral and depth
extensions.
The electrical resistivity (r) and its inverse the electrical conduc-
tivity (s) characterize charge transport within materials. They are
intrinsic material properties, independent of sample size. Rocks and
rock-forming minerals vary in their electrical properties, with conduc-
tivities ranging from 10
6
to 10
14
Sm
1
.
The MT method is based on the induction of electromagnetic fields
in the Earth (see Natural sources for EM induction studies). The MT
impedance tensor Z and the geomagnetic response functions (see
Induction arrows and Geomagnetic Deep sounding) are the Earth's
response to electromagnetic induction (see Transfer functions; Robust
electromagnetic transfer functions estimates) and thus carry the infor-
mation about the conductivity distribution of the subsurface.
The word “regional” is not clearly defined. It merely means that the
size of the area under investigation is somewhere between “local” (see
EM, industrial uses; EM, land uses) and “global” (see Induction from
satellite data). However, most regional studies of EM are initiated to
add to our understanding of processes that drive major tectonic and geo-
logical events (see also EM, tectonic interpretations). Typical examples
may be the investigation of large mountain chains, which are formed
in subduction or collision zones. Transform faults are expressions of
dynamic processes in the Earth's lithosphere. Such large-scale faults
can be traced for hundreds to thousands of kilometers on the Earth's
surface and there is growing evidence that some of them penetrate the
mantle lithosphere. A tectonic regime can be presently active or a fossil.
Suture zones, for example, give evidence for past collisions of conti-
nents and the closure of former oceans. Most continents consist of
Archean nuclei (cratons), which are enclosed by Proterozoic and Pha-
nerozoic tectonic belts and suture zones. Many of the old structures
are covered today by huge sedimentary basins. Geophysical deep sound-
ing methods, like seismics or MTs, are arguably the only means to unra-
vel information on the position and structure of such features deep in
the Earth's interior.
Tectonic activity generally also involves processes such as formation
of new structural fabrics as well as the generation and emplacement
of magmas. Chemical reactions due to metamorphism can release vast
amounts of fluids or can cause the precipitation of minerals such as
ore and graphite. Melt, fluids, and ore deposits are electrically conduc-
tive materials. Inclusions of small fractions of these conducting phases
can make an entire rock conductive, and if widely enough intercon-
nected, even an entire region. Hence, zones of high electrical conduc-
tivity in the Earths crust and mantle hint at present or past traces of a
dynamic Earth.
Experiment de sign
The design of a regional EM study will depend strongly on the target.
The geometry of a fault zone, for example, is totally different from that
of a subducting slab in a subduction zone. A fault is a narrow, subver-
tical structure that begins at the surface of the Earth and ends some-
where deep in its interior. Hence, the study of a large fault could
have “local” and “regional” components. Locally, a fault may be inves-
tigated by one or several short profiles across its surface trace and with
a very dense spacing of sites. It is one of the strongholds of the MT
method that it is capable of imaging vertical structures (which is
difficult with seismics). On the regional scale, a fault zone may widen
(distributed shear) or bend to one direction (listric fault) and hence, a
much wider area in the vicinity of the fault must be sampled at the
surface.
The sounding depth of any electromagnetic method depends on the
frequency contents of the induced fields and on the subsurface conduc-
tivity (skin effect). High-frequency signals will probe the shallow sub-
surface while low-frequency fields penetrate a much wider and deeper
induction space. Particularly in noisy environments, active EM meth-
ods like transient EM (q.v.) and controlled source EM (q.v.) can be a
good choice but the sounding depth of these methods is restricted to
the first few hundred meters, in favorable conditions perhaps a few
kilometers. For the really deep targets we can only rely on natural
source MT.
For the more shallow investigation, MT instruments based on induc-
tion coil magnetometers will be preferred over fluxgate magnetometers
which are more useful for low-frequency work. Electric field sensors
for MT are nonpolarizing electrodes (see Magnetotellurics). A com-
plete recording system contains some kind of analog signal interface
to the sensors, multichannel analog to digital converters, typically with
24-bit accuracy, and digital data storage capacity. An integrated GPS
provides accurate timing and position. Modern induction coil magnet-
ometers can be used over a wide frequency range from approximately
10 kHz to 1 mHz and equipment based on these wideband induction
coil magnetometers is often called broadband (BB). Fluxgate magnet-
ometers, on the other hand, typically operate in the frequency range
from 0.1 Hz to dc and such long-period MT instruments are called
LMT. For regional EM studies BB, LMT, or a combination of both
types of instruments can be deployed.
Today, there is a clear tendency for MT experiments in which a
large number of recording instruments operate simultaneously and
with a much denser site spacing than perhaps a few years ago. Another
development is toward 3D MT for which instruments must be distrib-
uted over an area or aligned in a grid instead of simply following pro-
files. But a combination of a profile and some wider distributed sites
can also be a very useful setup. A dense site spacing, preferably in
combination with good areal coverage, enhances model resolution,
avoids spatial aliasing, reduces the number of equivalent models,
and generally stabilizes inversion results. Any interpretation of anoma-
lies from the deep crust or mantle will be more sound if crustal-
scale anomalies are properly resolved instead of having to rely on
assumptions.
For practical reasons, it is often necessary however, to make simpli-
fying assumptions when interpreting MT data collected for regional
EM studies. A full 3D inversion, is in most cases, not feasible due both
to computational requirements and the lack of areal data coverage
required to constrain such an inversion (see EM modeling, inverse ).
The complexity reduces considerably if the subsurface can be approxi-
mated by a 2D conductivity distribution. In order to determine the 2D
conductivity distribution of the subsurface either forward modeling
(see EM modeling, forward) or inversion is applied to the data. It is
at this point that an accurate assessment of the dimensionality of MT
data is important. In the case of 2D isotropic Earth structure, the MT
equations reduce to fitting two elements of the impedance tensor and
one element of the geomagnetic response functions.
Another very important aspect of modern regional EM studies
is interdisciplinary work. Electrical conductivity models can provide
valuable information but can only add to our knowledge of a more
complicated nature. Hence, an interpretation of conductivity models
should always consider information from other geoscience disciplines.
It is equally important to ensure that colleagues from other fields fully
understand the outcome and possible consequences of regional EM
studies for their own work.
The following sections give three examples of regional EM
work. The case studies are from different tectonic regimes; the
observed conductivity anomalies have different causes and the
regional extents of the studies (the size of the models) are very
dissimilar.
242 EM, REGIONAL STUDIES
The electrical image of the active Dead Sea
transform fault
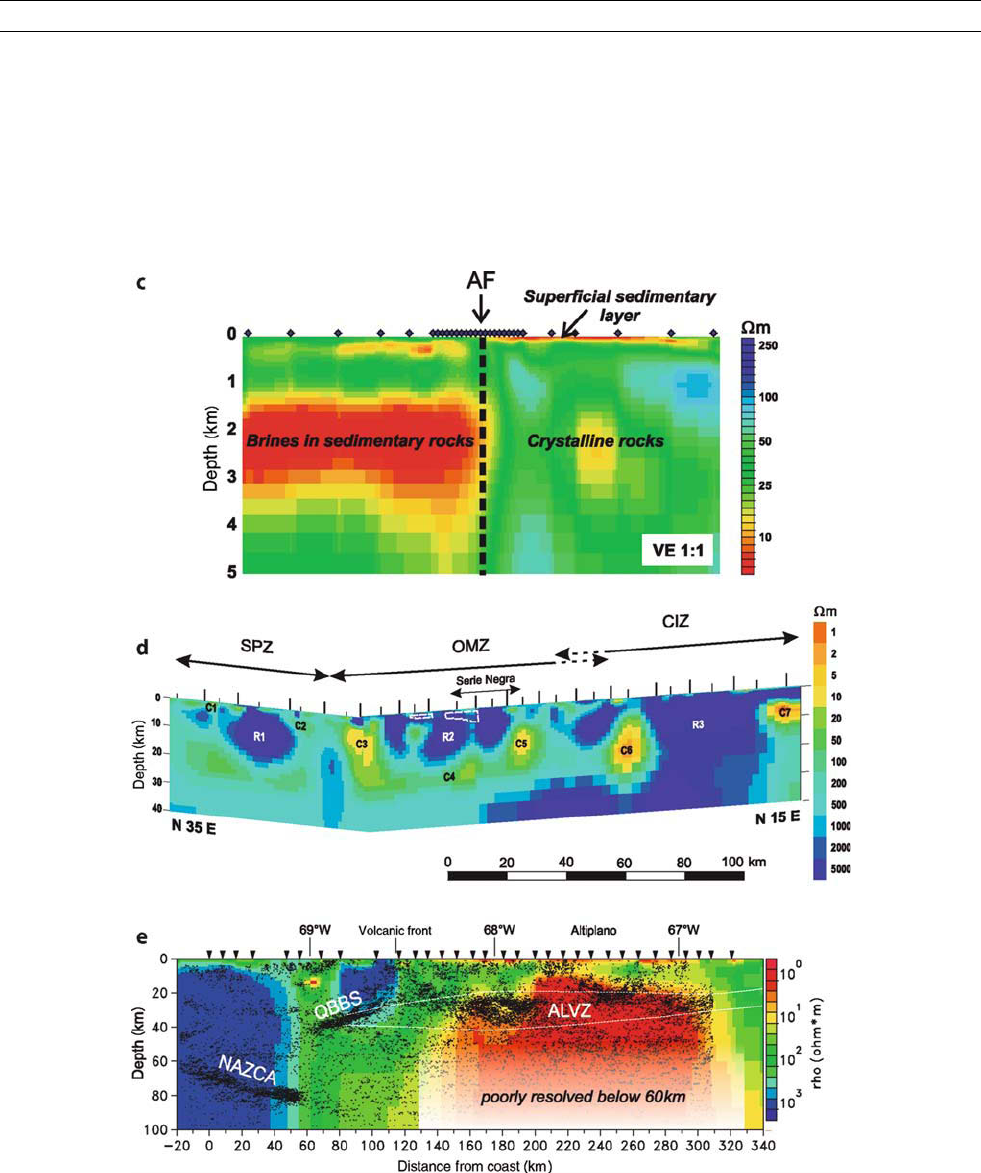
Figure E28a/Plate 15c may serve as an example for the outcome of
a 2D inversion of MT data. The MT data shown were recorded along
the innermost 10 km of a much longer profile, centered on the Dead
Sea transform in the Arava Valley in Jordan. A dense site spacing of
100 m in the center of the MT profile was supplemented by more
widely spaced sites near the profile ends. The derived image is a
so-called minimum structure model in a sense that the inversion
algorithm attempts to find a trade-off between data misfit and model
smoothness. The resistivity values are color-coded. Zones of high con-
ductivity, which are generally the better resolved parameters in any
MT model, are shown in red and yellow colors.
For the shallow crust, the inversion model reveals a highly conduc-
tive layer from the surface to a depth of 100 m on the eastern side of
the profile. However, the most prominent feature on the MT image is a
conductive half-layer confined to west of the fault and beginning at a
depth of approximately 1.5 km. The surface trace of the Arava Fault
Figure E28/Plate 15c Three examples of regional EM studies. The resistivity values are color coded; red and yellow colors indicate
zones of high conductivity: (a) Magnetotelluric profile crossing the Dead Sea Transform Fault, locally known as the Arava Fault (AF),
modified after Ritter et al. (2003). The most prominent feature in the resistivity model are the sharp lateral contrasts under the surface
trace of the AF. (b) Two-dimensional electrical resistivity model of a profile across the western part of the Iberian Peninsula (Iberian
Massif), modified after Pous et al. (2004). The high conductivity zones coincide with the transitions of suture zones of the Variscan
orogen. Labels are R, high-resistivity zones; C, high-conductivity zones; SPZ, South Portuguese Zone; OMZ, Ossa Morena Zone; and
CIZ, the Central Iberian Zone. (c) MT model across the Andes, modified after Brasse et al. (2002). The most consistent explanation for
the broad and deep reaching highly conductive zone is granitic partial melt. Reflection seismic data and the location of the Andean
Low-Velocity Zone (ALVZ) are superimposed on the MT model. The Quebrada Blanca Bright Spot (QBBS) marks a highly reflective
zone in the middle crust of the forearc.
EM, REGIONAL STUDIES 243

(AF) correlates with a sharp vertical conductivity boundary at the east-
ern edge of this feature. The high conductivity may be due to brines in
porous sedimentary rocks.
The interpretation that crystalline rocks are situated east of the fault
cannot be derived from the MT data. Coincident seismic data, how-
ever, reveal a strong increase in P-wave velocities (to values exceeding
5kms
1
) east of the AF, where the MT model indicates higher
resistivities (Ritter et al., 2003). The seismic velocities are consistent
with crystalline basement rocks; however the observed resistivities
(50–250 Om) are unusually low for unfractured crystalline rocks. Both
the seismic and MT observations may be explained by fractured crys-
talline rocks with interconnected fluid-bearing veins.
A lithological change across the fault may be the cause of the deeper
conductivity contrast, however, the near-surface conductors, on oppo-
site sides of the fault, are in similar lithology (alluvial fan deposits).
This suggests that an impermeable fault-seal may be arresting cross-
fault fluid flow transport at shallow depths. Additionally, the intercon-
nected fluid-bearing veins, posited to exist within the Precambrian
basement, do not appear linked to the deep conductor west of the fault.
Thus, a fault-seal may be restricting fluid transport at greater depths
as well.
The image of the AF in Jordan appears to be an exception, as it
shows a distinct lack of an electrically conducting deformation zone at
its center. Typical for many of the active faults are subvertical regions
of high conductivity. Fluids distributed within the fracture network of
the damage zone generally explain the observed high conductivity. Fluid
transport within the rock opens pores and cracks, increasing the mobility
of solutes such as salts, calcite, or quartz, thereby increasing the bulk
conductivity.
The most intensively studied example of any fault is the San Andreas
Fault (SAF) in California. Unsworth et al. (1997) demonstrated that its
internal structure can be imaged with MT measurements. Several short
profiles across the SAF image a highly conductive structure down to sev-
eral kilometers depth. At Parkfield, the anomalous conductivity is con-
fined to a zone centered on the SAF and extending from the surface to
2–5 km depth. At Hollister, the prominent zone of high conductivity is
loosely bound between the San Andreas and Calaveras faults, extending
to mid-crustal depths beneath the SAF (Bedrosian et al., 2004). Ritter
et al. (2005) examine how electrical images of different fault zones are
linked to specific architectural units, the hydrogeology, and seismicity
within the fault.
Fossil faults in suture zones
Exhumed fossil shear zones, in contrast to upper crustal faults, often
expose structures which originated below the depth of predominantly
brittle deformation (though they may have experienced brittle defor-
mation during reactivation). These shear zones can be similarly con-
ductive, but in these cases, bulk conductivity may be dominated by
electron transport, for example in an interconnected graphite network.
Graphite coatings lower shear friction and hence add to the mobility of
faults. Once created, graphite is stable over very long time spans
allowing shear zones to remain conductive long after activity ceases.
The critical observation is that the shearing process itself can lead to
the interconnection of conductive material (Jödicke et al., 2004; Nover
et al., 2005).
The SW Iberian Peninsula constitutes the southern branch of the
Iberian Massif, the best exposed fragment of the Variscan Fold Belt
in Europe. It was built up by an oblique collision between three conti-
nental blocks: the South Portuguese Zone (SPZ), the Ossa Morena
Zone (OMZ), and the Central Iberian Zone (CIZ). These blocks are
separated by suture zones. In its evolution through time, this area
experienced sequences of volcanic rifting, continental collision, and
the closure (subduction) of oceans. To unravel traces of these past
geodynamic processes by imaging the present Earth's crust is a key
question but also a major challenge for geophysical deep sounding
methods.
Pous et al. (2004) interpret a 200 km long MT profile across this
part of the Iberian Massif. The model in Figure E28b (see also Plate
15c) reveals several high conductivity zones which coincide with the
transitions of three Variscan terranes (SPZ, OMZ, and CIZ). A general
north-dipping trend of the structures appears in the upper crust of the
SPZ and OMZ. Fluids in shallow crustal faults could be the cause
for the high conductivities observed in C1 and C2. Palaeozoic cover
sequences and plutonic intrusions are depicted in the upper to middle
crust as high resistivity zones (R1–R3).
The most striking features in the model are the zones of high conduc-
tivity which cut across the entire crust (C3 and C6 in Figure E28b and
Plate 15c). Most interestingly, these deep reaching zones of enhanced
conductivity correlate with the transitions SPZ/OMZ and OMZ/CIZ
and it is plausible to conclude that these zones are the (electrical)
expressions of suture zones. Another interesting feature of the model
in Figure E28b (see also Plate 15c) is the presence of a high conductiv-
ity layer (C4) extending over the entire OMZ at middle to lower crustal
depth 15–25 km. The top part of this conductive layer is spatially cor-
related with a broad reflector (derived from reflection seismic data).
The preferred explanation of Pous et al. (2004) for the high conductivity
at greater depth is the presence of interconnected graphite. Mylonitiza-
tion and shearing along a lower crustal detachment zone could explain
both the seismic and the MT observations.
Pous et al. (2004) concluded that the enhanced conductivity in the
suture zones of the Iberian Massif is generally caused by intercon-
nected graphite enrichment along shear planes. Laboratory measure-
ments on rock samples (Serie Negra)—rocks which were exhumed
during Variscian transpression—confirmed the presence of intercon-
nected graphite. Graphite can either accumulate in the schistosity sur-
faces produced by folding and metamorphism or form metallic films
developed in mature faults.
Electrical anisotropy (q.v. ) is sometimes found in fossil regimes.
Typical observations for electrical anisotropy are phase values exceed-
ing 90
(Weckmann et al., 2003) and a stripy appearance (alternating
between zones of higher and lower resistivity) of conductive zones.
Some parts of the model in Figure E28b (see also Plate 15c) were also
found to be electrically anisotropic. These zones are indicated by
dashed white lines.
Electrical conductivity image from an active
subduction zone
Brasse et al. (2002) report on long-period MT studies from the central
Andes between latitudes 19.5
and 21
S along two almost parallel pro-
files of 220 and 380 km lengths. The investigation area extends from
the Pacific coast to the southern Altiplano Plateau in the back arc of
the South American subduction zone. The main geoelectrical structure
resolved is a broad and probably deep reaching highly conductive zone
in the middle and deeper crust beneath the high plateau (see the large
red block in Figure E28c and Plate 15c). The Andean Continental
Research Program (ANCORP) seismic reflection profile revealed
highly reflective zones below the Altiplano, in good correlation with
the upper boundary of the Altiplano conductor (see Figure E28c and
Plate 15c). This highly conductive domain furthermore coincides
with low seismic velocities (ALVZ), a zone of elevated V
p
/V
s
ratios
and high heat flow values. Considering all observations, granitic par-
tial melt is the most consistent explanation for this zone of high
conductivity.
Schilling and Partzsch (2001) demonstrated that the observed con-
ductivities can be explained with partial melt rates exceeding 14%
by carrying out laboratory measurements and theoretical calculations.
Assuming a solid rock conductivity of s
rock
¼ 0:001 S m
1
and a melt
conductivity of s
melt
¼ 10 S m
1
then the resulting bulk conductivity
is 1 Sm
1
. This would correspond to a melt rate of 10% and 10 Sm
1
represents an upper limit for the conductivity of granitic melt.
The presence of saline fluids, however, cannot the excluded. Parti-
cularly for the upper parts of the Altiplano conductor this would also
244 EM, REGIONAL STUDIES

explain the strong seismic reflectivity in the middle crust. An unex-
pected result of the MT image is the lack of correlation with the
down-going slab (NAZCA reflector) or the Quebrada Blanca Bright
Spot (QBBS). If the high reflectivity of the QBBS would be caused
by large volumes of entrapped fluids ascending through the crust,
however, then this should lead to a significant increase in the electrical
conductivity. Obviously, the MT data contradict this interpretation, and
it is also possible that the reflector is due to some strong structural con-
trast. The down-going slab and the domains immediately above it
could become electrically conductive (i) because of water-rich sedi-
ments being transported in the subduction system or (ii) by release
of fluids in the blueschist-eclogite transition zone in 80–100 km
depth. Modeling studies show that such a conductor is compatible with
the data (see Schwalenberg et al., 2002; and H. Brasse, personal com-
munication) but it is not required to fit the data. Hence, if an electri-
cally conductive slab exists, it is obscured by the overwhelming
lateral influence of the high conductivity zones associated with the
Pacific Ocean in the west and the Altiplano in the east.
Oliver Ritter
Bibliography
Bedrosian, P., Unsworth, M., Egbert, G., and Thurber, C., 2004. Geo-
physical images of the creeping segment of the San Andreas Fault:
implications for the role of crustal fluids in the earthquake process.
Tectonophysics, 385: 137–158.
Brasse, H., Lezaeta, P., Schwalenberg, K., Soyer, W., and Haak, V.,
2002. The Bolivian Altiplano conductivity anomaly. Journal of
Geophysical Research, 107(5): 10.1029/2001JB000391.
Jödicke, H., Kruhl, J.H., Ballhaus, C., Giese, P., and Untiedt, J., 2004.
Syngenetic, thin graphite-rich horizons in lower crustal rocks from
the Serre San Bruno, Calabria (Italy), and implications for the
nature of high-conducting deep crustal layers. Physics of the Earth
and Planetary Interiors, 141:37–58.
Nover, G., Stoll, J.B., and Gönna, J., 2005. Promotion of graphite for-
mation by tectonic stress—a laboratory experiment. Geophysical
Journal International, 160: 1059–1067.
Pous, J., Munoz, G., Heise, W., Melgarejo, J.C., and Quesada, C.,
2004. Electromagnetic imaging of Variscan crustal structures in
SW Iberia: the role of interconnected graphite. Earth and Plane-
tary Science Letters, 217: 435–450.
Ritter, O., Ryberg, T., Weckmann, U., Hoffmann-Rothe, A., Abueladas,
A., Garfunkel, Z., and DESERT Research group, 2003. Geophysical
images of the Dead Sea transform in Jordan reveal an impermeable
barrier for fluid flow. Geophysical Research Letters, 30(14): 1741,
doi:10.1029/2003GL017541.
Ritter, O., Hoffmann-Rothe, A., Bedrosian, P.A., Weckmann, U., and
Haak, V., 2005. Electrical conductivity images of active and fossil
fault zones. In Bruhn, D., and Burlini, L. (eds.), High-Strain Zones:
Structure and Physical Properties, Vol. 245. Geological Society of
London Special Publications, pp. 165–186.
Schilling, F.R., and Partzsch, G., 2001. Quantifying partial melt frac-
tion in the crust beneath the central Andes and the Tibetan Plateau.
Physics and Chemistry of the Earth, 26: 239–246.
Schwalenberg, K., Rath, V., and Haak, V., 2002. Sensitivity studies
applied to a two-dimensional resistivity model from the Central
Andes. Geophysical Journal International, 150(3): 673–686.
Unsworth, M.J., Malin, P.E., Egbert, G.D., and Booker, J.R., 1997.
Internal structure of the San Andreas fault at Parkfield, California.
Geology, 25(4): 359–362.
Weckmann, U., Ritter, O., and Haak, V., 2003. A magnetotelluric
study of the Damara Belt in Namibia 2. MT phases over 90
reveal
the internal structure of the Waterberg Fault/Omaruru Lineament.
Physics of the Earth and Planetary Interiors, 138:91–112, doi:
10.1016/S0031-9201(03)00079-1.
Cross-references
Anisotropy, Electrical
Electromagnetic Induction (EM)
EM Modeling, Forward
EM Modeling, Inverse
EM, Industrial Uses
EM, Land Uses
EM, Marine Controlled Source
EM, Tectonic Interpretations
Geomagnetic Deep Sounding
Induction Arrows
Induction from Satellite Data
Magnetotellurics
Natural Sources for EM Induction Studies
Robust Electromagnetic Transfer Functions Estimates
Transfer Functions
Transient EM Induction
EM, TECTONIC INTERPRETATIONS
Studies of electromagnetic induction in the Earth are used to construct
models of the variation of electrical conductivity in 1, 2, or 3 dimen-
sions. Although the goal of some studies is the delineation of mineral
or geothermal resources, the aim of many such investigations of con-
ductivity structure is an improved understanding of tectonic processes.
On a local scale these may include studies of active fault zones or vol-
canoes, while regional-scale studies include investigations of subduc-
tion zones, orogenic belts (regions of mountain building), and even,
using seafloor measurements, spreading ocean ridges and mantle hot
spots.
Electromagnetic (EM) methods can be used to study active tectonic
processes primarily because fluids (molten rock or aqueous solutions)
are typically either formed or released during these processes. In com-
parison to background values of the electrical resistivity of crustal
rocks (100s–1000s Om), both partial melts and aqueous fluids are
highly conductive and can have the effect of lowering the bulk resis-
tivity of host rocks, to the extent that they form ideal targets for detec-
tion using EM techniques such as magnetotelluric (MT) sounding. The
degree to which the bulk resistivity of a rock is reduced by the pre-
sence of fluids depends primarily on two factors. The first of these is
the resistivity of the fluid itself, but more important is the degree to
which the fluid forms an interconnected network and, thus, a continu-
ous electrically conductive path through the host rock. For example,
simple numerical calculations of the bulk resistivity of a two-phase
system (Figure E29) shows that isolated pockets of fluid (e.g., molten
rock) with a resistivity of 0.1–0.25 Om have little effect on the bulk
resistivity of a solid host rock with a resistivity of 1000 Om even if
the melt forms 10% by volume. In contrast, a connected melt of as
a little as 1% by volume, distributed through the host rock, reduces
the bulk resistivity by a factor of nearly 100. The minimum amount
of melt or aqueous fluid that is necessary for the fluid to be connected
is surprisingly small and possibly less than 1% (Minarik and Watson,
1995).
An excellent example of the manner in which the presence of both
partial melt and aqueous fluids facilitates the use of EM methods to
investigate tectonic processes is presented by the results of the electro-
magnetic sounding of the lithosphere and asthenosphere beneath
(EMSLAB) study of the Juan de Fuca subduction zone off the Pacific
Coast of North America (Wannamaker et al., 1989). The two-dimensional
model of electrical resistivity (Figure E30), derived from MT data
along a transect of over 300 km in length, shows several regions of
anomalously low resistivity. In particular, a thin region of low resis-
tivity dipping to the east below the North American continent is inter-
preted as being due to the presence of residual oceanic sediments on
EM, TECTONIC INTERPRETATIONS 245