Grace Robert. Advanced Blowout and Well Control
Подождите немного. Документ загружается.

346
Advanced
Blowout
and Well
Control
0.6(22
1
5)
pf
=
53.3(0.833)(580)
pf
=
0.052
psilfi
The depth to the interval
being
charged
is
given
by Equation
8.1
:
or, rearranging
2215
D=
0.65
-
0.052
D
=
3,704
feet
This
analysis of the shut-in
surface
pressure
data
indicated
that
the flow
was
being lost
to
a Zone
at
approximately
3,700
feet.
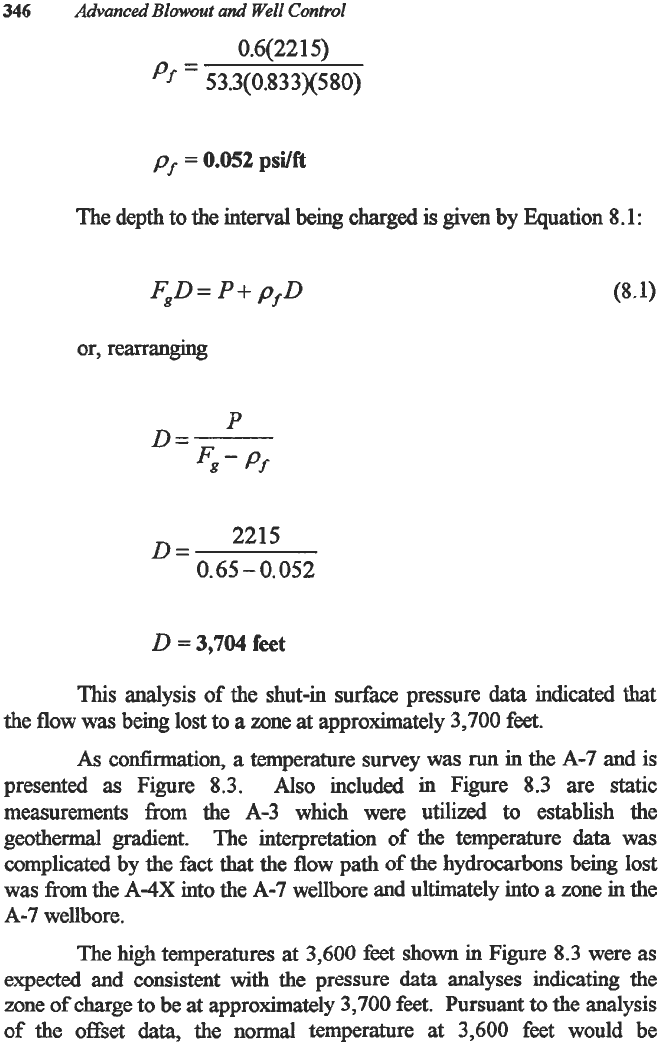
As
confirmation,
a
temperature survey
was
run
in the
A-7
and is
presented
as
Figure
8.3.
Also
included in Figure
8.3
are static
measurements from the
A-3
which were utilized
to
establish the
geothermal @ent. The interpretation
of
the temperature
data
was
complicated by the fact that the flow path
of
the hydrocarbons being lost
was from the
A-4X
into
the
A-7
wellbore and ultimately into
a
zone
in
the
A-7
wellbore.
The
high
temperatures at
3,600
feet
shown
in Figure
8.3
were as
expected and consistent with the pressure
data
analyses indicating the
zone
of
charge to be at approximately
3,700
feet. Pursuant
to
the analysis
of
the
offset
data,
the normal temperature
at
3,600
feet would be
The
Underground Blowout
347
anticipated to be approximately
130
degrees Fahrenheit. However, due to
the flow of the gas into the interval at
3,600
feet, the temperature
at
that
zone had been increased
45
degrees to
175
degrees.
I
-TsnptatA4X
+
TmptatA-3
Figure
8.3
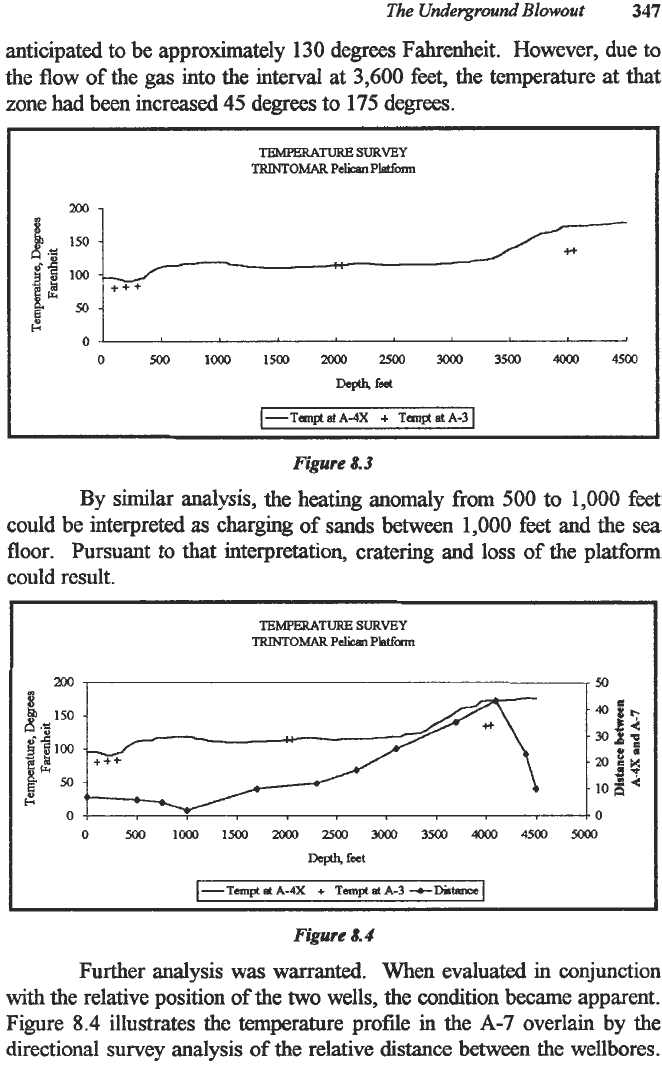
By similar analysis, the heating anomaly
from
500
to
1,000
feet
could be interpreted
as
charging of sands between
1,000
feet and the sea
floor. Pursuant to that interpretation, cratering and
loss
of the platform
could result.
TEMPERATURE
SURVEY
TRINTOMARPeliCsnPletfam
Figure
8.4
Further analysis was warranted. When evaluated in conjunction
with
the relative position
of
the two wells, the andition became apparent.
Figure
8.4
illustrates the temperature profile in the
A-7
overlain
by
the
directional survey analysis of the relative
distance
between the wellbores.
348
This
figure hrther confirms the previous pressure and temperature
analyses. The
two
wells are the greatest distance apart, which is
45
feet,
at
4,100
feet. That depth corresponds with the most pronounced anomaly,
confirming the conclusion that the thermal primary zone of loss
is
below
3,600
feet.
As
illustrated, the wellbores are interpreted
to
be
2
feet apart
at
1,000
feet and
5
feet apart
at
the sea bed. Therefore, the temperature
anomaly above
1,000
feet was interpreted to be the result of the proximity
of the
two
wellbores and not caused by the flow of
gas
and condensate to
zones near the sea bed.
Based on the analyses of the surface pressure and the temperature
data, it was concluded
that
working on the platform was not hazardous
and that the platform did not have to be abandoned.
As
hrther
confirmation, no
gas
or condensate was observed
in
the
sea
around the
platform at any time during or following the kill operation.
At the Pelican Platform the surface pressures remained constant.
When the surface pressures remain constant, the condition of the wellbore
is also constant. However, when the surfhce pressures fail to remain
constant, the conditions in the wellbore
are,
in
all
probability, changing
and
causing the changes in the surface pressures.
Advanced
Blowout
and
Well
Control
...............
Scnd
Sand
.-
3
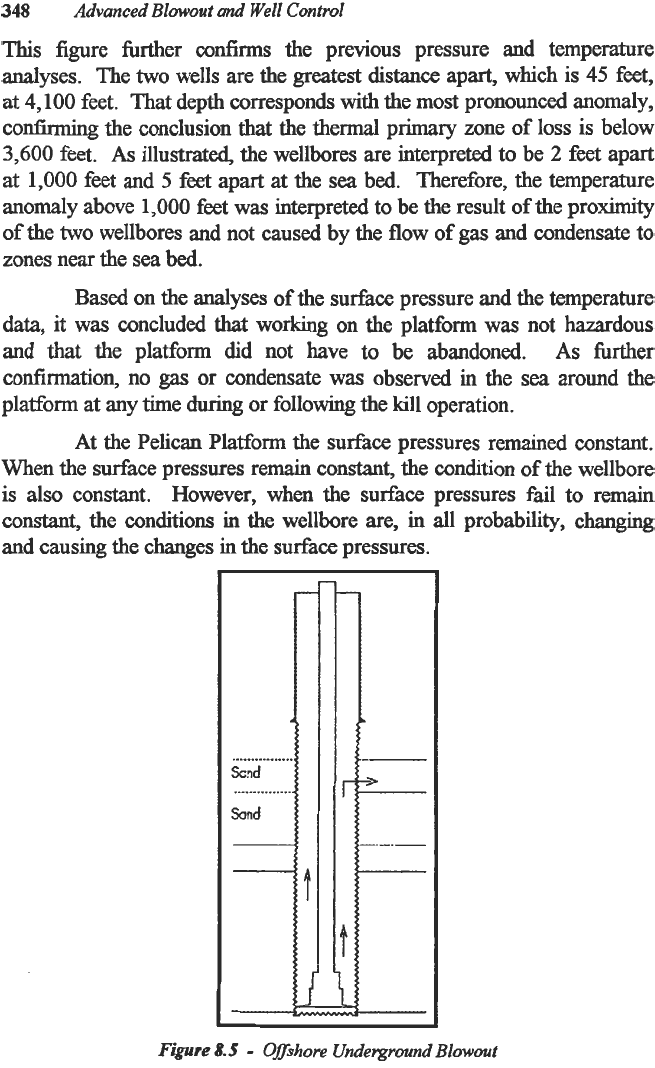
Figure
8.5
-
Offshore
Underground
Blowout
The Underground
Blowout
349
Consider an example
of
an
underground blowout at an offshore
drilling operation.
With
only surface casing
set,
a
kick was taken and
an
underground blowout ensued. The pressures on the drillpipe and annulus
stabilized and analysis pursuant
to
the previous example confirmed
that
the loss was into sands safely well below the surface casing
shoe
(Figure
8.5).
I
SURFACE
PRESSURES
VERSUS
TIME
Southeat
Asia
2200
1800
'g
2ooo
c
1400
1200
100
0
10
20
30
40
50
60
70
Timq
horn
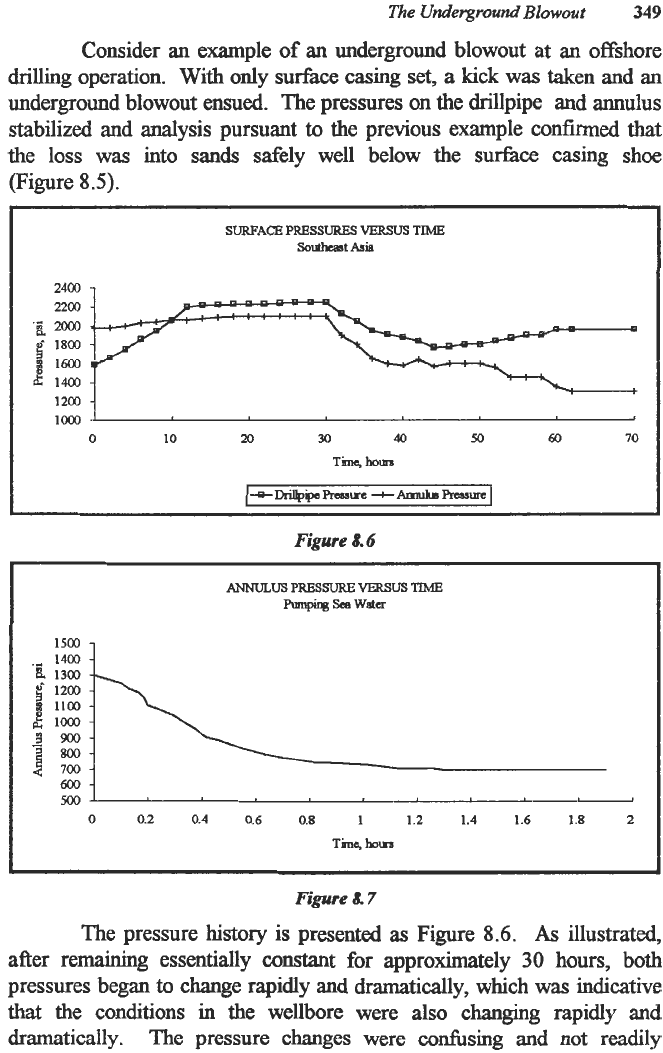
Figure
8.6
0
0.2
0.4
0.6 0.8
1
1.2
1.4
1.6
1.8
2
Time,
horn
Figure
8.7
The pressure history is presented
as
Figure
8.6.
As
illustrated,
after remaining essentially coflsfant for approximately
30
hours, both
pressures began
to
change rapidly and dramatically, which was indicative
that the conditions
in
the wellbore were also changing rapidly and
dramatically.
Thc
pressure changes were confusing
and
not
readily
350
adaptable
to
analysis and several interpretations were possible. The
declining pressures could be indicative that the wellbore was bridging or
that the flow was depleting. Further, a change in the composition
of
the
flow could contribute
to
the change in the pressures. Finally,
a
decline in
annulus pressure could be the result
of
the flow fracturing toward the
surface.
In
an effort to define the conditions in the wellbore, a more
definitive technique was used to determine precisely the depth
of
the loss
from the underground blowout. With the well shut in,
sea
water
was
pumped down the annulus at
rates
sufficient
to
displace the gas.
As
illustrated in
Figures
8.6
and
8.7,
while pumping, the annulus pressure
declined and stabilized. Once the pumps were stopped, the annulus
pressure began to increase. With this
data,
the depth to the
loss
zone
could be determined
using
Equation
8.2:
Advanced
Blowout
and
Well
Control
AP
P,
-
Pf
D=
Consider Example
8.2:
Example
8.2
Given:
Sea
water gradient,
Gas
gradient,
P,
=
0.44psUft
pf
=
0.04psUft
Sea
water is pumped into the well shown in Figure
8.7
and the
surface pressure declines
from
1500
to
900
psi
as
shown in
Figure
8.8.
Required:
The depth
to
the zone
of
loss
Solution:
The depth
to
the zone
of
loss is given by Equation
8.2:
The Underground
Blowout
351
L
AP
Pm-
Pf
D=
f
600
D=
0.44
-
0.04
D
=
1,500
feet
m-900
pa
Figure
8.8
-
Offshore
Underground
Blowout
As
illustrated
in
Example
8.2,
replacing the hydrostatic column of
wellbore
fluids
from
the zone
of
loss to the surface with a hydrostatic
column
of sea water only reduced the surface pressure by
600
psi.
Therefore, the length
of
the
column
of
sea
water between the surface
and
The
Undeqpund
Blowout
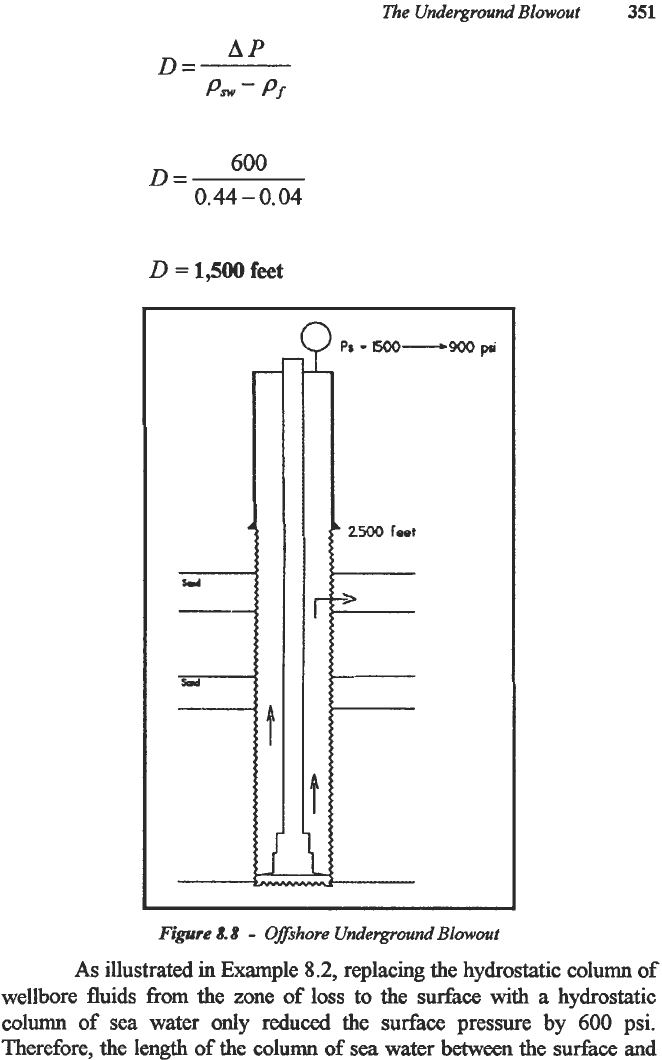
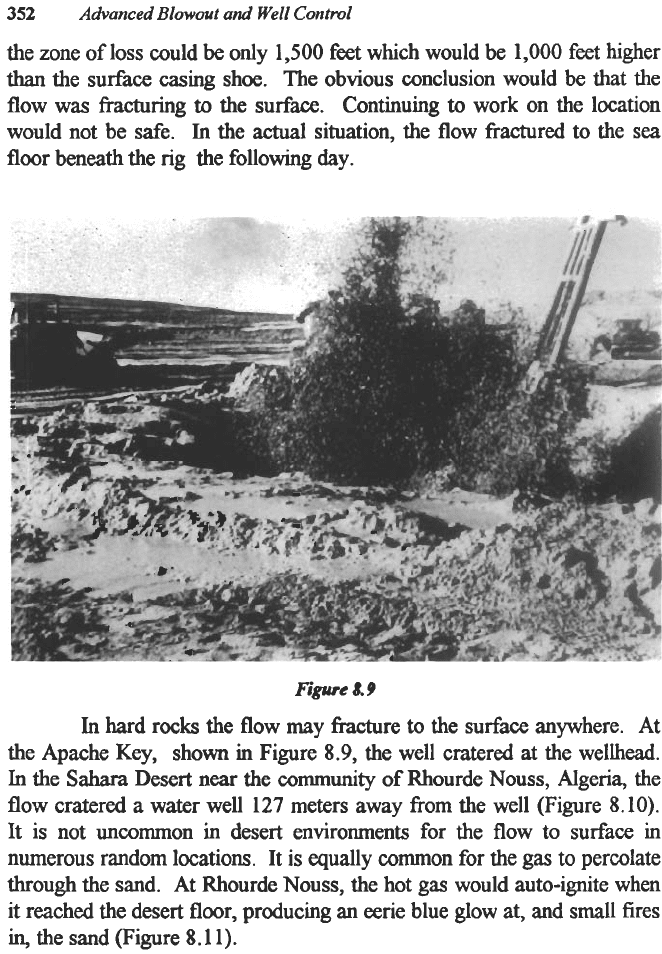
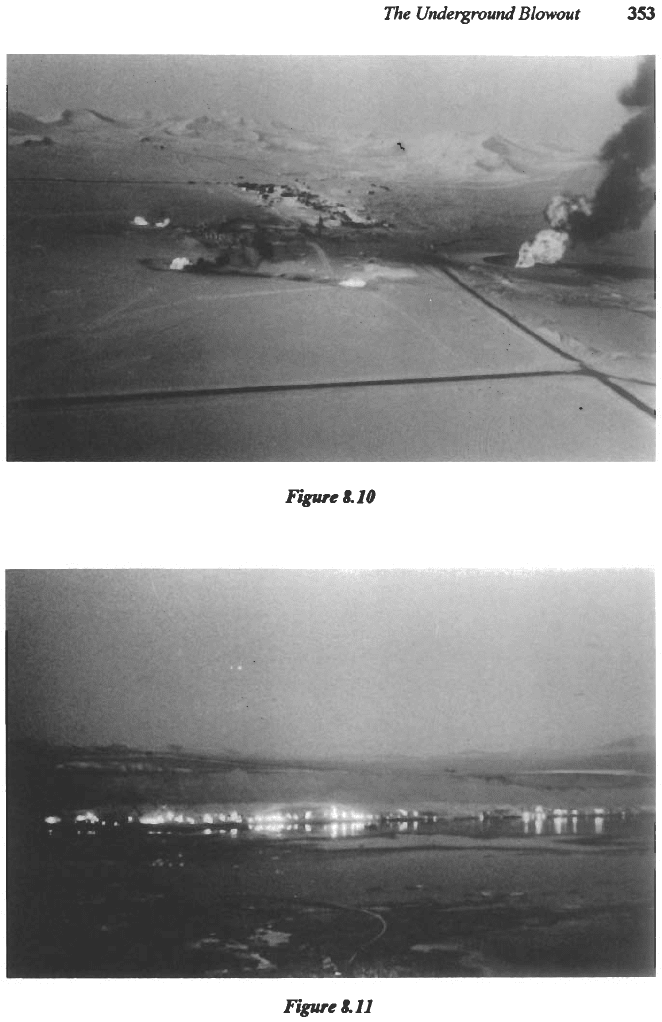
353
354
rldvanced
Blowout
and Well
Control
i
I
4-13-z&
coc
AT
I,4BO
m
-2-Me7BG
AT
2.383
m
4-5-m'
47WX
CSQ
AT
Z,&O
m
~~~~
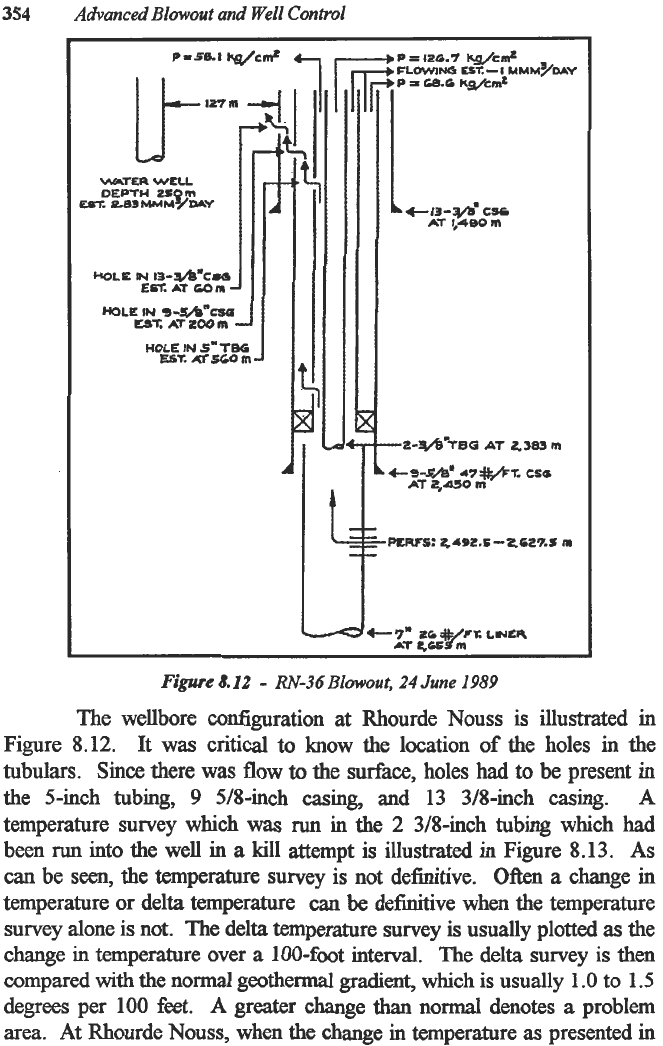
Figure
&12
-
RN-36
Blowout,
24
June
1989
The wellbore configuration at Rhourde
Nouss
is illustrated
in
Figure 8.12.
It
was critical to know the location of the holes
in
the
tubulars. Since there was
flow
to
the surface, holes had
to
be present
in
the 5-inch tubing,
9
518-inch
casing,
and 13 318-inch casing.
A
temperature survey which
was
run
in
the
2
318-inch tubing which
had
been
run
into the well
in
a
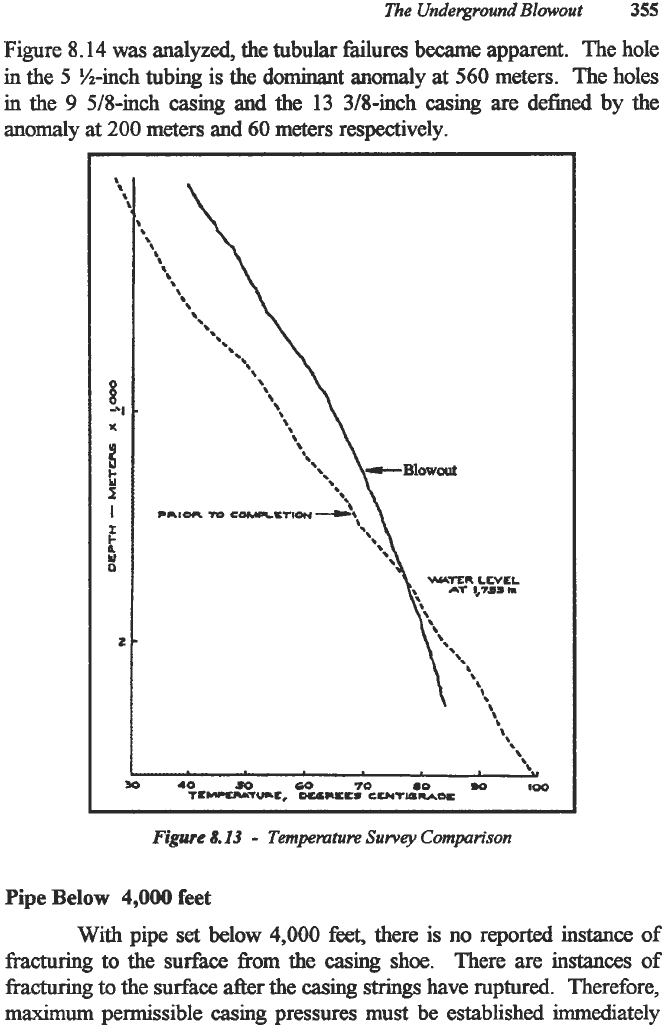
kill attempt is illustrated in Figure 8.13.
As
can be
seen,
the temperature survey is not definitive.
Often
a change
in
temperature or delta temperature can
be
definitive when the temperature
survey alone is
not.
The delta temperature survey is usually plotted
as
the
change
in
temperature over
a
100-foot interval. The delta survey is then
compared
with
the normal geothermal gradient, which
is
usually
1
.O
to 1.5
degrees per
100
feet.
A
greater change
than
normal
denotes
a
problem
area. At Rhourde
Nouss,
when the change
in
temperature
as
presented
in
The Underground
Blowout
355
Figure
8.14
was
analyzed,
the tubular fkilures became apparent. The
hole
in
the
5
%-inch tubing is the dominant anomaly at
560
meters. The holes
in the
9
518-inch casing and the 13 3/8-inch casing are defined by the
anomaly
at
200
meters and
60
meters respectively.
Figure
8.13
-
Tempemture
Survey
Comparison
Pipe Below 4,000 feet
With pipe set
below 4,000
feet,
there is
no
reported instance
of
fracturing
to
the
surface
from
the
casing
shoe.
There are instances
of
fracturing
to the surface after the
casing
strings
have ruptured. Therefore,
maximum
permissible casing pressures must
be
established immediately