Grace Robert. Advanced Blowout and Well Control
Подождите немного. Документ загружается.

326
MAGRANGE interpretations and, at
15,570
feet measured depth, the
relief well
was
discovered
to
be
so
far off course that the relief well had to
be plugged back
to
14,050
feet measured depth and redrilled. At
a
measured depth of
15,540
feet in the sidetrack, the MAGRANGE
interpretation again conflicted with other available
data.
Based
on
the
MAGRANGE interpretation, the recommendation
was
made
to
turn the
relief well south
to
intercept the blowout (Figure
7.4).
Realizing that
a
mistake would result in yet another sidetrack, the crew employed alternate
techniques.
One alternative
was
WELLSPOT. The WELLSPOT
interpretation was that the blowout was not
12
feet south as interpreted by
MAGRANGE but
1.5
feet south. Further, it
was
interpreted from
WELLSPOT
data
that
the blowout would pass
to
the north of the relief
well
within
the next
60
feet. Obviously, both interpretations could not be
correct. If the WELLSPOT interpretation
was
correct and the relief well
was turned
to
the south
as
recommended from the MAGRANGE
interpretation,
a
plug back would be required. If the MAGRANGE
interpretation was
correct
and the relief well was not turned to the south,
a
side track would result.
In
order
to
resolve the conflict,
60
feet of
additional hole were made and both surveys were rerun.
Both
interpretations
agreed
that
the blowout wellbore
had
passed from south to
north of the relief well wellbore, confirming the WELLSPOT
interpretation. Both techniques were used throughout the remainder of the
relief well operation at the Apache Key. Neither
was
given benefit of the
other's interpretation prior
to
offering
its
own interpretation. The
MAGRANGE and WELLSPOT interpretations conflicted
in
every
aspect
except direction at each subsequent logging point. Without exception, the
WELLSPOT interpretation was proven
to
be correct.
Advanced
Bowout
and Well
Control
RELIABILITY
OF
PROXIMITY
LOGGING
How reliable is wellbore proximity logging?
This
question
was
investigated at the TXO Marshall relief well operation.'
In
this
case,
the
first indications of the blowout wellbore were received at the relief well
wellbore while the blowout was
200
feet
away. The relief well intercepted
the blowout
at
13,355
feet. The plan view
from
interpretation of a
gyro
previously run in the blowout
was
utilized
to
evaluate the accuracy of the
Relief
Well
Design and Operations
327
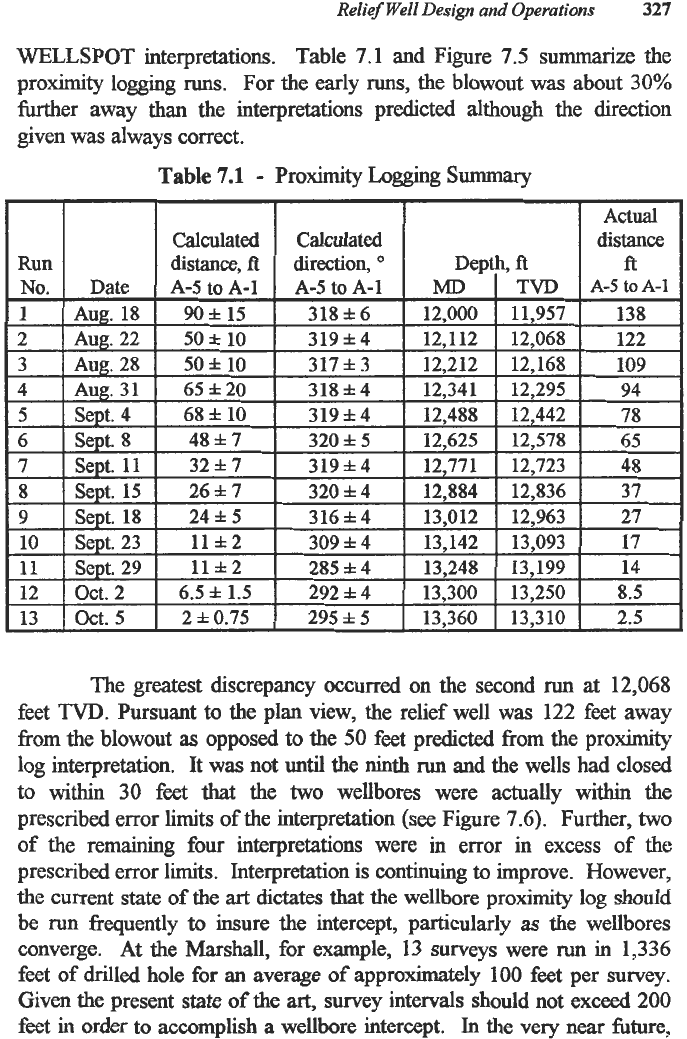
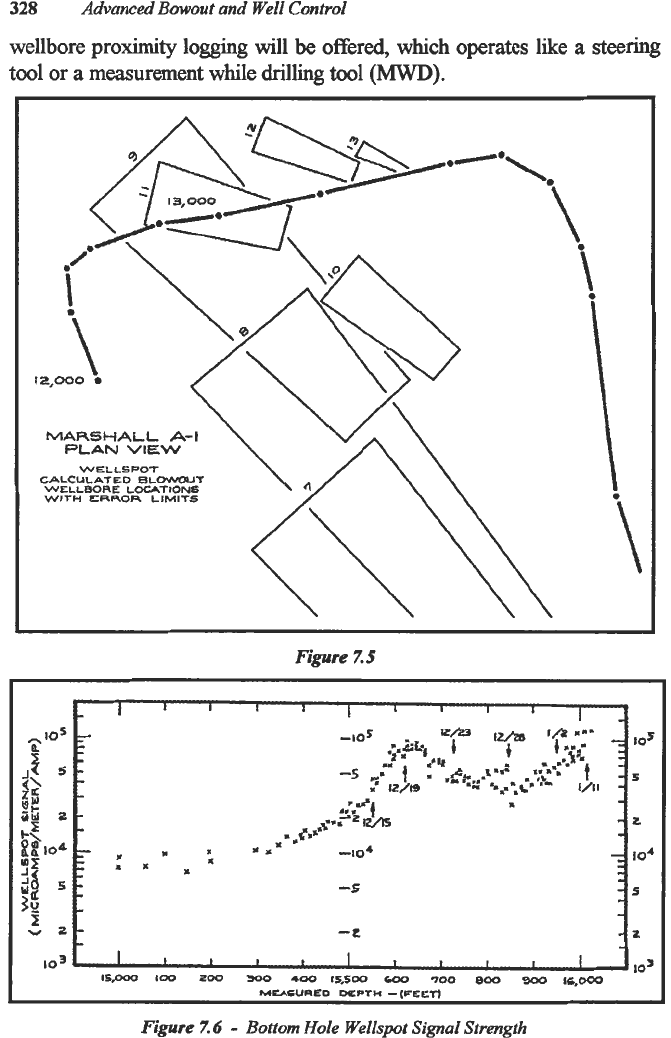
WELLSPOT interpretations. Table 7.1 and Figure
7.5
summarize the
proximity logging
runs.
For the early
runs,
the blowout was about 30%
further away than the interpretations predicted although the direction
given was always correct.
Table
7.1
-
Proximity Logging
Summary
The greatest discrepancy occurred on the second
run
at
12,068
feet
TVD.
Pursuant to the plan view, the relief well was
122
feet away
fiom
the blowout
as
opposed to the
50
feet
predicted
from
the proximity
log interpretation. It was not until the ninth
run
and the wells had closed
to within
30
feet
that the
two
wellbores were actually within the
prescribed error limits of the interpretation
(see
Figure 7.6). Further,
two
of
the remaining four interpretations were in error in excess
of
the
prescribed error
limits.
Interpretation is continuing
to
improve. However,
the current state
of
the
art
dictates that the wellbore proximity log should
be run frequently
to
insure the intercept, particularly
as
the wellbores
converge. At the Marshall,
for
example, 13 surveys were run in 1,336
feet
of
drilled hole for an average of approximately 100 feet per survey.
Given the present state
of
the art, survey intervals should not exceed 200
feet
in
order to accomplish a wellbore intercept.
In
the very near future,
328
Advanced
Bowout
and Well
Control
wellbore proximity logging will
be
offered, which operates like
a
steering
tool or
a
measurement while drilling tool
(MWD).
Figure
7.5
I
I
I
I
I
I
1
I
I
I
I
I I
t
I
I I
I
I
I
103
10’
ispoo
IOO
zoo
=o
400
rs,sm
coo
700
e00
900
u,0~0
H-CURED
WPTH
-(CEEn
Figure
7.6
-
Bottom
Hole Wellspot Signal
Strength
Relief
Well
Design
and Operations
329
RELIABILITY
OF
COMMERCIAL
WELLBORE
SURVEY
INSTRUMENTS
The accuracy
and
reliability
of
survey
instruments
are
of
great
interest
in
relief well
operations.
For various
reasons,
sometimes
the
relief
well
has
to
be plugged back
and
re-drilled after
contact
has
been made
with
the
blowout.
With
what
degree
of
accuracy,
reliability
and
repeatability
can
the relief well
be
plugged back
and
drilled
to
the position
of
the blowout
as
described
by available
survey
equipment?
FELT
WEST
100
?)4
#,
70
GO
SO
4Q
30
Lo
IO
Go
1
I
I
I
r
-
-
-50
-
so
2:
t
-
70
3
51
-=t;
w
!A
-30
-
Izo
/
/*
-’
#xc
-
130
-140
I
s
I
150
0-0
MAGNETIC
SINGLE
SHOT
*--W
3-PG
67RO
n----x
3-21
GYRO
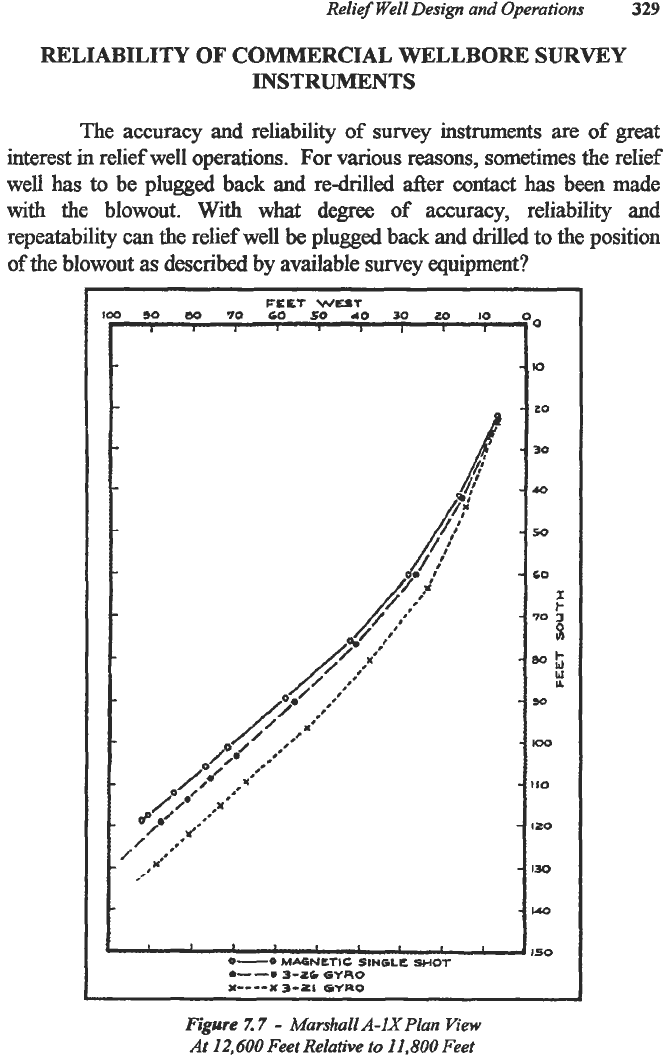
Figure
Z
7
-
Marshall
A-IX
Plan View
At
12,600
Feet Relative
to
11.800
Feet
330
Advanced
Bowout
and
Well
Control
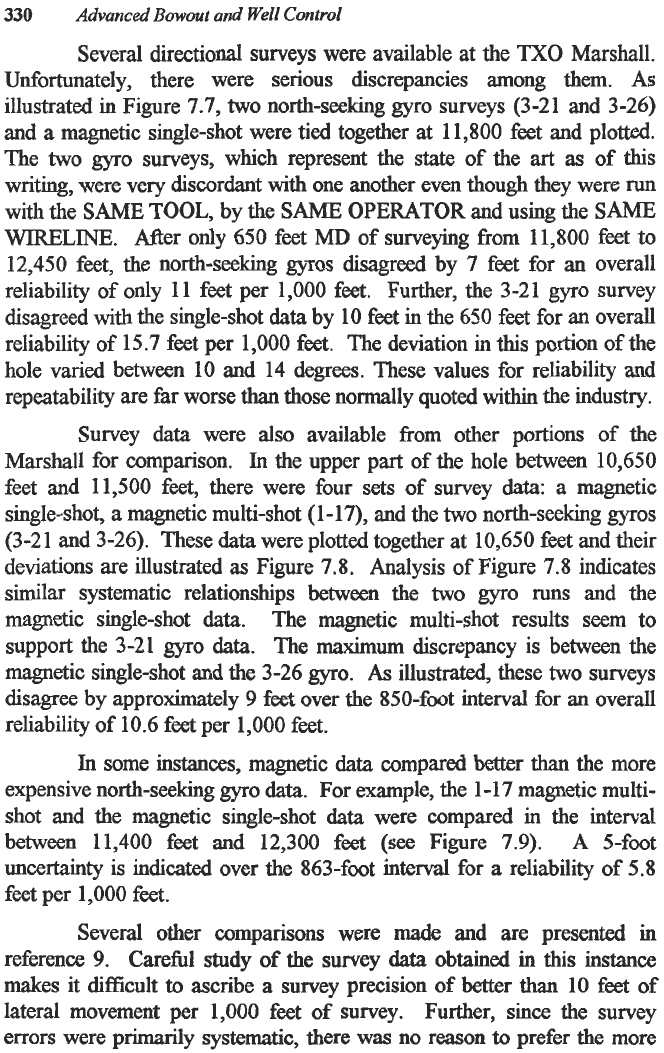
Several directional surveys were available at the
TXO
Marshall.
Unfortunately, there were serious discrepancies among them.
As
illustrated in Figure 7.7,
two
north-seeking
gyro
surveys (3-21 and 3-26)
and
a
magnetic single-shot were tied together at 11,800 feet and plotted.
The
two
gyro
surveys, which represent the state of the art
as
of
this
writing, were very discordant with one another even though they were run
with the SAME TOOL, by the
SAME
OPERATOR
and using the
SAME
WIRELINE. After only 650 feet MD of surveying from 11,800 feet
to
12,450 feet, the north-seeking
gyros
disagreed by 7 feet for an overall
reliability of only 11 feet per 1,000 feet. Further, the 3-21 gyro survey
disagreed with the single-shot
data
by 10 feet in the 650 feet for an overall
reliability of 15.7 feet per 1,000 feet. The deviation in this portion
of
the
hole varied between 10 and 14 degrees. These values for reliability and
repeatability are far worse
than
those normally quoted within the industry.
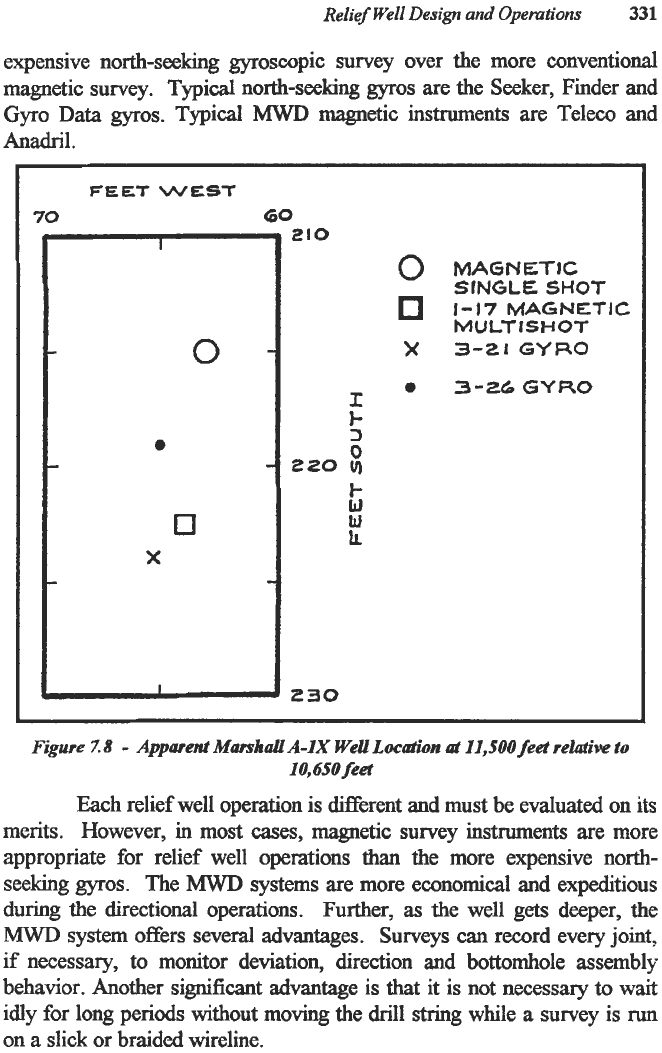
Survey
data
were
also
available from other portions of the
Marshall for comparison.
In
the upper part of the hole between 10,650
feet and 11,500 feet, there were four sets of survey
data:
a magnetic
single-shot, a magnetic multi-shot (1-17), and the
two
north-seeking
gyros
(3-2 1 and 3-26). These data were plotted together at 10,650 feet and their
deviations are illustrated
as
Figure 7.8. Analysis of Figure 7.8 indicates
similar systematic relationships between the
two
gyro
runs
and the
magnetic single-shot
data.
The magnetic multi-shot results
seem
to
support the 3-21
gyro
data.
The
maximum
discrepancy is between the
magnetic single-shot and the 3-26
gyro.
As
illustrated, these
two
surveys
disagree by approximately 9 feet over the 850-foot interval for an overall
reliability of 10.6 feet per 1,000 feet.
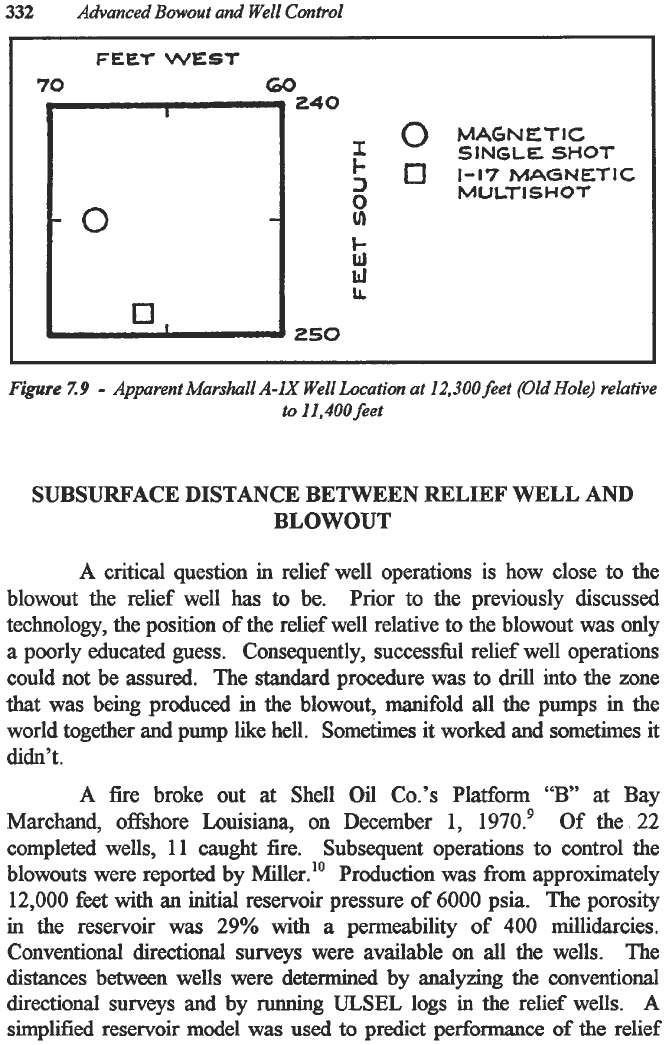
In
some instances, magnetic
data
compared better
than
the more
expensive north-seeking
gyro
data.
For example, the 1-1 7 magnetic multi-
shot and the magnetic single-shot
data
were compared
in
the interval
between 11,400 feet and 12,300 feet (see Figure 7.9).
A
5-foot
uncertainty is indicated over the 863-foot
interval
for
a
reliability of 5.8
feet per 1,000 feet.
Several other comparisons were made and are presented in
reference 9. Careful study of the survey data obtained
in
this instance
makes it difficult
to
ascribe a survey precision of better
than
10 feet of
lateral movement per 1,000 feet of survey. Further, since the survey
errors were primarily systematic, there
was
no reason
to
prefer the more
Relief Well
Design
and
Opemtiorts
331
expensive north-seeking gyroscopic survey over the more conventional
magnetic survey. Typical north-seeking
gyros
are the Seeker, Finder and
Gyro
Data
gyros.
Typical
MWD
magnetic instruments are Teleco and
Anadril.
FEET
WEST
70
60
1
0
0
0
X
210
I
I-
3
0
I-
w
220
!
230
0
MAGNETIC
SINGLE
SHOT
MU
LT
ISH
OT
x
3-2iCYRO
0
3-ZdGYRO
1-17
MAGNETIC
~~ ~ ~ ~~~
Figure
Z
8
-
Appatent
MarshaU A-IX
Well
Location
at
II,SOO
feet relutiw
to
IO,6SO
feet
Each
relief well operation is different and must be evaluated on its
merits. However, in most cases, magnetic survey instruments are more
appropriate for relief well operations than the more expensive north-
seeking
gyros.
The
MWD
systems are more economical and expeditious
during the directional operations. Further,
as
the well gets deeper, the
MWD
system offers several advantages. Surveys
can
record every joint,
if necessary, to monitor deviation, direction and bottomhole assembly
behavior. Another significant advantage is that it is not necessary to wait
idly for long periods without moving
the
drill
string
while a survey
is
run
on a
slick
or braided wireline.
332
Advanced
Bowout
and Well
Control
I
.
-
-0
A
0,
240
0
MAGNETIC
I
SINGLE
SHOT
‘
0
1-17
MAGNETIC
M
ULT
I
S
H
0
T
3
8
I-
W
tl
u.
250
Figure
Z9
-
Apparent
Marshall
A-IX
Well Location at
12,300
feet (Old Hole) relative
to
11.400
feet
SUBSURFACE DISTANCE BETWEEN RELIEF WELL AND
BLOWOUT
A
critical question in relief well operations is how close to the
blowout the relief well
has
to be. Prior to the previously discussed
technology, the position
of
the relief well relative to the blowout was only
a
poorly educated guess. Consequently, successfid relief well operations
could not be assured. The standard procedure was
to
drill
into the zone
that was being produced
in
the blowout, manifold all the pumps in the
world together and pump like hell. Sometimes it worked and sometimes it
didn’t.
A
fire
broke out
at
Shell Oil
Co.’s
Platform
“B
at
Bay
Marchand, offshore Louisiana,
on
December 1, 1970.’ Of the 22
completed wells,
11
caught fire. Subsequent operations to control the
blowouts were reported by Miller.’o Production was from approximately
12,000 feet with an initial reservoir pressure of
6000
psia. The porosity
in the reservoir was 29% with a permeability
of
400
millidarcies.
Conventional directional surveys were available
on
all the wells. The
distances between wells were determined by analyzing the conventional
directional surveys and by running
ULSEL
logs
in
the
relief wells.
A
simplified reservoir model was used
to
predict performance of
the
relief
Relief
Well
Design
and
Opemtions
333
well control operations. Eleven relief wells were drilled. The
distance
between the relief well and the blowout varied between
12
feet and
150
feet.
In
each instance the blowout zone was penetrated and water was
pumped through the producing interval. Of the 1 1
,
4 compared fivorably
with predicted performance. The relief wells were 12
to
18 feet from the
blowouts.
Water volumes to establish communication ranged
from
450
barrels to 1,340 barrels. One well was killed with water while the other
three required
as
much
as
1,300 barrels
of
mud.
A
second four compared less favorably but experienced no major
problems
in
killing. The
distances
varied
fi-om 13 feet to
82
feet. Water
volumes varied between 1,250 barrels and 13,000 barrels.
All
four wells
required mud with the volumes varying
between
1,187 barrels and 3,326
barrels.
The remaining three wellbores had unfavorable comparisons with
predicted performance. The water volumes exceeded 100,000 barrels.
In
one instance, pumping into the relief well resulted in no noticeable effect
on
the blowout and control
had
to be regained from the surface.
The Bay Marchand operation was one
of
the more successhl
efforts. Often when an operation was successhl, the success was due to
as
much luck
as
skill. The
reasons
are fkirly obvious. Only the most
prolific reservoir rocks demonstrate sufficient permeability to permit the
flow
of kill fluids containing mud solids of every imaginable size,
including large quantities of barite guaranteed to be approximately 44
microns in size. If the zone fractured, there
was
no good reason for the
fi-acture to extend
to
the blowout. The blowout had
to
be killed with water
before kill mud could
be
pumped. If the kill mud was
unsuccessful
in
controlling the blowout, communication with the blowout was usually lost
because of kill-mud gel strengths and barite settling. Under these
conditions, communication might not
be
regained.
As
wells were drilled deeper, the reservoir parameters, such
as
permeability and porosity, were even less favorable
in
terms of their
ability to permit the flow of solids-laden kill fluids.
In
wells below
15,000
feet,
it
is not reasonable even to think about pumping kill fluids through
the formations.
With the current technology, intercepting the wellbore is the
preferred approach.
With
an interception, killing the blowout becomes
334
predictable. Further,
the
predictability
permits
more precise design of the
relief well. Kill rates and pressures
can
be determined accurately and
tubulars can be designed to accomplish specific objectives. With an
intercept, it is no longer necessary to manifold all the pumps in captivity,
as many blowouts
can
be controlled with the rig pumps. At the Apache
Key, for example, approximately 100 barrels of mud per hour were being
lost
to the blowout from the relief well, and control
was
instantaneous.
With
a
planned intercept, it is no longer necessary
to
drill the largest
diameter hole imaginable
in order to pump large volumes of kill fluid at
high
rates.
Perforating between wellbores
has
regained interest with the
introduction of tubing-conveyed perforating
guns.
There are very few
charges available for conventional wireline perforating of sufficient size
to
perforate meaningfid distances.
In
addition, orientation can be shown
mathematically
to
be difficult depending on the size of the casings
involved and the distance between casing.
However, using tubing-
conveyed perforating
guns,
large charges
can
be
run
and orienv. Such a
system was successfblly used at Corpoven’s Tejero blowout, northeast
Venezuela.
In
that
instance, it was reported
that
three attempts were
required
to
communicate the relief well with the blowout.
In
the first
attempt, two 6-inch
guns
with
14
300-gram
charges in each
gun
were
run.
The shots were aligned along the
gun
in three rows with
a
displacement
between each row of
5
degrees. The
two
guns were connected with
the
center rows displaced
10
degrees. On the second attempt,
two
4
5/8-inch
oriented
TCP
guns
were
run
with seventy-two 27-gram charges. The
center row
was
displaced 33 degrees. The relief well was believed to be
within 2 feet of the blowout.
With a planned wellbore intercept, it is no longer mandatory that
the
relief well be drilled into the blowout zone. Other intervals in
the
blowout wellbore may offer more attractive targets. At both the Apache
Key
and
the
TXO
Marshall, the intercepts were accomplished above the
producing formations. At the Shell
Cox,
the intercept was accomplished
approximately midway between the
sufice
and total depth. At
a
recent
North
Sea
operation,
the
intercept was
in
open hole approximately
100
feet below the end of
the
bit. At the Amerada Hess
-
Mil-Vid
#3,
the drill
string was intercepted several
hundred
feet above the blowout and the
relief well proceeded
in
direct contact with the drill string in the blowout
until the
final
bridge
was
drilled
and
the blowout
was
killed. In
that
Advanced Bowout
and
Well
Control
Relief Well Design
and
Operations
335
instance, less
than
20
barrels of mud controlled the blowout.
A
planned
intercept offers significant
advantages.
SURFACE DISTANCE BETWEEN RELIEF WELL AND
BLOWOUT
The distance at the surface
between
the relief well and the
blowout is a function of overall project management; however, the closer
the better. The cost of relief well operations is exponential with
displacement. However, some projects are managed in such
a
fashion
that
the relief well project manager
has
no choice but to put the relief well a
mile away
in
a bad direction. Ideally, overall project management will
permit the relief well to
be
drilled within
1,000
feet
of
the blowout with
deviation angles below
15
degrees. The
best
direction is that which takes
advantage of the regional
drift
and fixture orientation tendencies.
SUMMARY
There are many other considerations
in
relief well operations that
are related
to
overall project management. Large
sums
of money
can
be
saved by the operator if overall management is considered. The relief well
operations need
to
be coordinated with the total control effort.
This
will
affect relief well location, for example, which
can
make or break
an
operation.
Also,
a
relief well operation
is
not just a directional operation.
It
is a drilling operation, a well control operation and a logging operation
as
well
as
a
directional operation. Needless to say, these considerations
can impact the total cost significantly.
In
summary,
relief well technology
has
advanced to the extent that
relief well operations are now
a
viable, reliable alternative
in
well control
operations and should
be
considered in the overall planning and
management of a blowout.
A
recent blowout at
a
deep, high-pressure well
in the North
Sea
is
a
good example. More
than
a
year
of expensive
surface work failed
to
provide
a
solution
to
the problem.
After
many
expensive months, the blowout
was
finally controlled fiom the relief well.
There is
a
good chance that the relief well would have been just
as
successfid
in
the first 60 days of the operation.