Gogotsi Y. (Ed.) Nanotubes and Nanofibers
Подождите немного. Документ загружается.

As we move along the tube from position A to position D, the density of topological defects
increases, since the topological defects are concentrated in a smaller volume. As a result, the
effect of confinement on electronic structure becomes more and more pronounced. This does not
seem to be very striking in the case of the conduction band, where only a slight and broad
enhancement has been noted in the LDOS at the cone apex. The valence band, however, is found
to alter considerably, exhibiting sharp resonant states at the cone tip (Figure 3.14b, curve D). The
strength and position of these resonant states with respect to the Fermi level is, in addition, very
sensitive to the distribution and position of defects within the cone. This is illustrated with two
models of cones having different morphologies obtained by altering the position of pentagons
within the tip structure (Figures 3.14c and d). In the two examples, the (A), (B), and (C) LDOS
calculated by the tight-binding method are very similar. Strong and sharp peaks in (D) LDOS have
different shape and position in the case of models I and II. The values calculated for model II show
better fit to the experimental values given in Figure 3.14b. The distribution of the defects and their
effect on electronic properties of the cones have been studied in detail elsewhere.
91
LDOS of
helix-type carbon cones are obtained by establishing the tight-binding model of a screw disloca-
tion in graphite.
81
Localized resonant states are very important in predicting the electronic behavior of carbon
cones. They can also strongly influence the field emission properties of cones.
3.2.4.2 Raman Spectra
Owing to its sensitivity to changes in the atomic structure of carbons, Raman spectroscopy has
proven a useful tool in understanding the vibrational properties and the microstructure of graphitic
crystals and various disordered carbon materials.
92–97
The relationship between the spectra and the
structure has been extensively discussed in the literature, and the studies cover a wide range of car-
bon materials, such as pyrolytic graphite (PG)
94,95
and highly oriented pyrolytic graphite
(HOPG),
95,98,99
microcrystalline graphite, amorphous carbon and glassy carbon, fullerenes, carbon
onions, nanotubes, etc. Little work is carried out on the Raman scattering from graphite
whiskers,
100–102
which usually consist of carbon layers oriented parallel to the growth axes. For such
structures, it is expected that their Raman spectra will be similar to those of disordered graphite
crystals and carbon fibers.
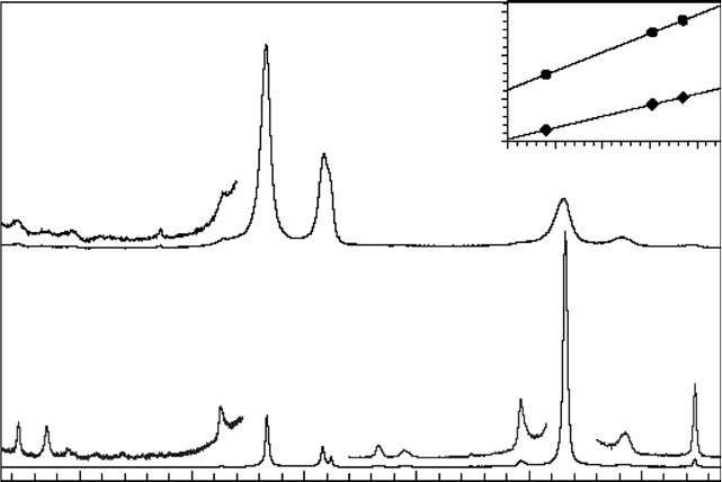
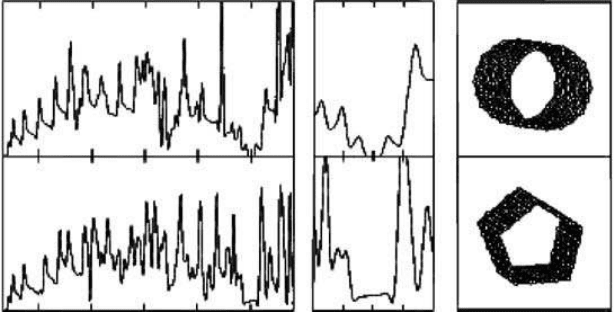
Figure 3.15 shows the Raman spectra of an individual graphite whisker and turbostratically
stacked particles, using 632.8 nm excitation wavelength. Whiskers were synthesized in a graphiti-
zation furnace using a high-temperature heat-treatment method.
23
Carbon layers in these whiskers
are almost perpendicular to their growth axes. Most of the first- and second-order Raman modes in
whiskers, such as the D, G, and D⬘ modes at ~1333, 1582, and 1618 cm
⫺1
, respectively, can be
assigned to the corresponding modes in HOPG and PG.
In contrast to other carbon materials, the Raman spectra of whiskers exhibit several distinct
characteristics. For example, the intensity of the 2D overtone is found to be 13 times stronger than
that of the first-order G mode in whiskers. The strong enhancement of the D and 2D modes is also
found in the Raman spectra of whiskers with 488.0 and 514.5 nm laser excitations.
100
Second, there
are two additional low-frequency sharp peaks located around 228 and 355 cm
⫺1
, and two additional
strong modes (around 1833 and 1951 cm
⫺1
) observed in the second-order frequency region. The
line widths of the D, G, D⬘, 2D, and 2D⬘ modes in whiskers are 17, 18, 10, 20, and 14 cm
⫺1
, respec-
tively. Because the frequencies of the L
1
and L
2
modes are in the frequency region of acoustic
modes, these two modes are supposed to be the resonantly excited acoustic modes in the transverse-
acoustic and longitudinal-acoustic phonon branches. The two high-frequency modes at 1833 and
1951 cm
⫺1
are designated as L
1
⫹ D⬘ and L
2
⫹ D′ modes, respectively. The observed excitation-
energy dependence (140 cm
⫺1
eV
⫺1
) of the 1833 cm
⫺1
mode is in excellent agreement with the the-
oretical value of 139 cm
⫺1
eV
⫺1
of the L
1
⫹ D⬘ mode.
100
122 Nanotubes and Nanofibers
Copyright 2006 by Taylor & Francis Group, LLC
The intensity enhancement of the dispersive modes indicates that double-resonance Raman
scattering may be responsible for this phenomenon.
103
Such enhancement of the 2D mode is also
observed in GPCs (Figure 3.17) that have a similar loop-edge structure in brim regions.
42
Raman spectra from tubular, helix-type, and naturally occurring carbon cones are available else-
where in the literature.
61,102
3.3 GRAPHITE POLYHEDRAL CRYSTALS — POLYGONAL MULTIWALL TUBES
3.3.1 SYNTHESIS
The structure of single- and multiwall carbon nanotubes, and single-wall carbon nanotube ropes have
been widely studied over the last 10 years.
2,31,71,104–108
While the ability of carbon to form multiwall tubular nanostructures is well known and these
tubes have been studied extensively, very little information is available about carbon nanotube struc-
tures having polygonal cross sections. Although an occurrence of polygonal vapor-grown carbon
fibers with a core carbon nanotube protrusion was noted by Speck et al.
109
as early as 1989, no
details were given about core fiber structure and its polygonization.
Zhang et al.
110
have studied the structure of an arc-discharge-produced carbon soot by the
HRTEM, and they were the first to indicate the possibility of polygonal multiwall carbon nanotubes,
assuming that the tubes consisted of closed coaxial concentric layers. The first evidence for occur-
rence of polygonized carbon nanotubes came from Liu and Cowley,
104,105,108
who used nanodiffrac-
tion in conjunction with HRTEM and selected area electron diffraction to investigate the structures
of carbon nanotubes having diameters of a few nanometers. Nanodiffraction is a form of convergent
beam electron diffraction, which allows one to obtain a diffraction pattern from regions of the spec-
imen about 1 nm or less in diameter. The tubes used in this study were produced by a variant of
Kratschmer–Huffman arc-discharge method
111
in helium gas at a pressure of 550 Torr. The DC
Graphite Whiskers, Cones, and Polyhedral Crystals 123
500
L
1
T
T+D
D+G
D
G,D′
2D′
2D
L
1
+L
2
L
1
+D′
L
2
+D′
L
2
2L
1
2L
2
632.8 nm
TS
200
Raman shift (cm
−1
)
1.8 2.0 2.2 2.4 2.6
Excitation energy (eV)
300
L
2
L
1
400
500
Whisker
×5
×50
×10 ×10
1000 1500 2000
Raman shift (cm
−1
)
2500 3000
FIGURE 3.15 Raman spectra of turbostratically stacked (TS) particles and an individual graphite whisker
excited with 632.8 nm laser excitation. The inset gives the energy dependence of the frequencies of the L
1
and
L
2
modes.
102
Copyright 2006 by Taylor & Francis Group, LLC
voltage applied to electrodes was 26–28 V and the corresponding current was 70 A. The carbon
nanotubes obtained at the given experimental conditions consisted of 3 to 30 carbon sheets and had
a length of up to 1 µm. The inner diameters of these tubes ranged from 2.2 to 6 nm, and the outer
diameters ranged from 5 to 26 nm. In addition to nanotubes of circular cylindrical cross section,
with zero, one or several helix angles, there were many tubes having polygonal cross sections, made
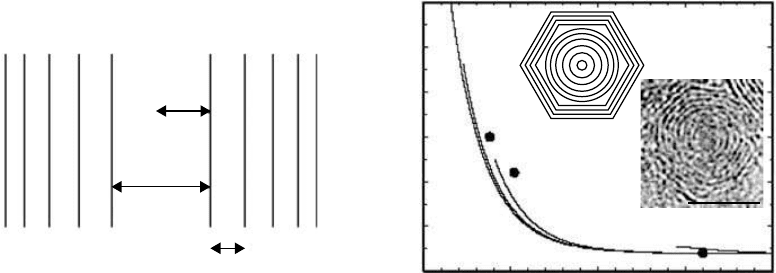
up of flat regions joined by regions of high and uniform curvature.
105
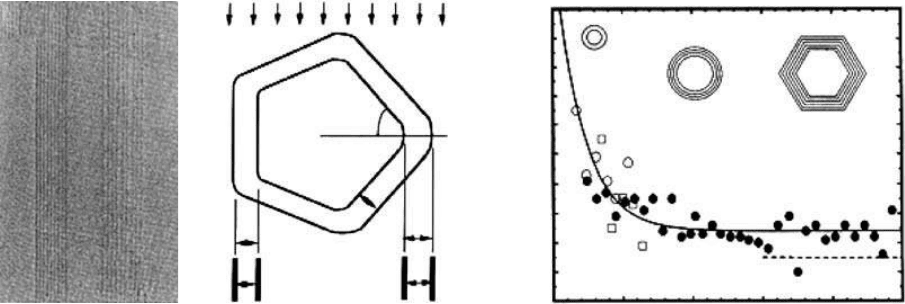
An HRTEM image of one such
structure is given in
Figure 3.16a. Polygonization of the cross section is observed indirectly through
formation of uneven patterns of lattice fringes on the two sides of the tube, with spacings varying
from 0.34 nm from the circular cylinder tubes, to 0.45 nm from the regions of high curvature
(Figure 3.16b).
In their study of the intershell spacing of multiwall carbon nanotubes prepared by the same
Kratschmer–Huffman arc-discharge method, Kiang et al.,
112
similarly, found that the intershell spac-
ing in carbon nanotubes ranged from 0.34 to 0.39 nm among different nanotubes, decreasing with
the increase in the tube diameter (Figure 3.16c). Some other reports have also shown variation of
the values from 0.344 nm (obtained by the electron and powder x-ray diffraction measurements)
113
to 0.375 nm (based on the HRTEM images).
114
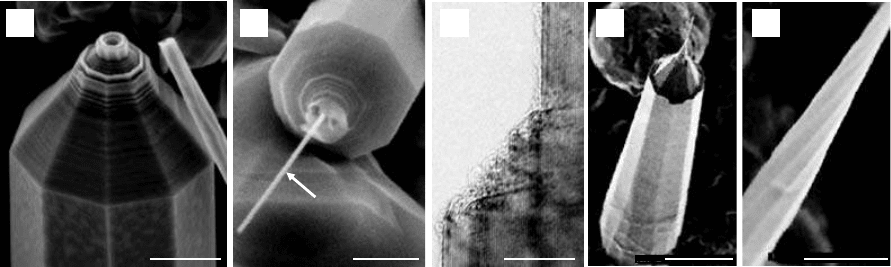
Faceted multiwall carbon nanotubes with larger diameters, called graphite polyhedral crystals
(GPCs), have been reported to grow at high temperatures in the pores of a glassy carbon material
(Figures 3.17a and b).
42
The glassy carbon containing polyhedral tubes was made from a thermoset
phenolic resin by carbonization at 2000°C in N
2
atmosphere at ~10 Torr. The density of glassy car-
bon was 1.48 g/cm
3
with an open porosity of ~1%; its microstructure and properties are typical of
other glassy carbons. After the structure of the matrix was set and some closed pores were formed,
polyhedral nanotubes grew from C–H–O (N
2
) gas trapped within these pores during the resin car-
bonization phase.
Graphite polyhedral crystals have a very complex morphology. Their size ranges from 100 to
1000 nm in diameter and up to few micrometers in length. The number of facets can vary from 5 to
14 and more, and they may possess a helical habit or be axially true. Many of the crystals terminate
with a thin protruding needle that appears to be a multiwall nanotube (Figure 3.17b), typically with
124 Nanotubes and Nanofibers
0.34 nm
d
d
°
=48
°
h
e
−
0.45 nm
0.0
d
sc
spacing (nm)
0.32
0.33
0.34
0.35
0.36
0.37
0.38
0.39
0.40
0.41
0.42
5.0 10.0
Diameter
D (nm)
15.0 20.0 25.0
(a) (c)(b)
FIGURE 3.16 (a) HRTEM image of a nine-sheet nonsymmetric tube. A d spacing of 0.34 nm is found on the
left side and a d spacing of 0.45 nm is seen on the right side.
108
(b) Model illustrating the formation of the non-
symmetric fringes from a tube (a) with polygonal cross section.
108
(c) The graphitic interplanar spacing
decreases as the tube diameter increases, and approaches 0.344 nm at roughly D ⫽ 10 nm. The data were meas-
ured from three different nanotubes indicated by different symbols. Hollow circles: from a seven-shell tube with
innermost diameter D
min
⫽ 1.7 nm. For large D, graphitization may occur resulting in a polygonal cross section.
The broken line indicates the expected decrease in interplanar spacing owing to local graphitic stacking.
112
Copyright 2006 by Taylor & Francis Group, LLC
a core diameter of about 5 to 20 nm and a conical, dome-capped, or semitoroidal tip. There is no
evidence about catalytic nucleation of the graphite polyhedral crystals. Formation of highly ordered
structures is promoted with the high temperature of treatment, the supersaturation of the environ-
ment with carbon atoms, slow reaction kinetics, and the presence of active species such as hydro-
gen and oxygen atoms that balance the crystal growth rate with the surface etching rate. This
explains the surprisingly large number of ordered carbon layers (up to 1500) growing on the core
nanotube, resulting in complex axis-symmetric structures. GPCs of somewhat less perfect struc-
tures (Figures 3.17c and d) have been successfully produced recently by using the flame combus-
tion method.
115
Annealing of carbon nanotubes with a circular cross section at high temperatures causes polyg-
onization of their walls. An HRTEM image of a CVD carbon nanotube sample before and after
annealing is shown in
Figure 3.18. The tubes were annealed for 3 h in a 10
−6
Torr vacuum at
2000°C. High-temperature annealing of carbon nanotubes in a vacuum or an inert environment
allows for the transformation of circular tubes into polygonal ones. However, polygonization will
not be uniform along the tube, nor will the cross section take the shape of a regular polygon.
To the best of our knowledge, natural counterparts of polygonal carbon multiwall nanotubes
have not been observed so far, but it would not come as a surprise if they are discovered in the near
future. Very short needle-like polygonal multiwall carbon nanotubes have also been synthesized
from a supercritical C–H–O fluid by hydrothermal treatment of various carbon precursor materi-
als
116,117
with and without the aid of a metal catalyst. Hollow carbon nanotubes, with multiwall
structures, comprising of well-ordered concentric graphitic layers, have been produced by treating
amorphous carbon in pure water at 800°C and 100 MPa.
117
HRTEM analysis of the reaction prod-
ucts indicates the presence of carbon nanotubes with polygonal cross sections (varying contrast and
lattice spacing along the tube diameter) within these samples. The experimental conditions for
hydrothermal synthesis of nanotubes resemble to a great extent the conditions of geological meta-
morphic fluids, and it is possible that some polygonal tubes are present in the Earth’s crust along
with the natural graphitic cones and tubules but have not been found yet.
3.3.2 STRUCTURE OF POLYGONAL TUBES
One of the earliest works dealing with the polygonization of the cross section of carbon nanotube,
is a report by Zhang et al.
110
Based on experimental observations, it was suggested that the fine
structure of carbon nanotubes is determined by two competing accommodation mechanisms (
Figure
3.19a). As a result of one of the mechanisms, the successive tube can adopt different helical shapes
to accommodate the change in circumference, therefore keeping an orientationally disordered (tur-
bostratic) stacking. As a result of the second mechanism, the rows of hexagons in successive tubes
Graphite Whiskers, Cones, and Polyhedral Crystals 125
MWNT
200 nm200 nm 10 nm
2 µm 4
(a) (b) (c) (d) (e)
µm
FIGURE 3.17 Graphite polyhedral crystals (GPCs). (a) SEM micrograph of a faceted GPC.
102
(b) A carbon
nanotube stylus is connected to a microsize body. (c) TEM image of a GPC’s lattice fringes indicates that GPCs
are highly graphitic and that the basal planes are terminated by a closed-loop structure.
102
(d–e) GPCs pro-
duced by using the flame combustion method.
115
Copyright 2006 by Taylor & Francis Group, LLC
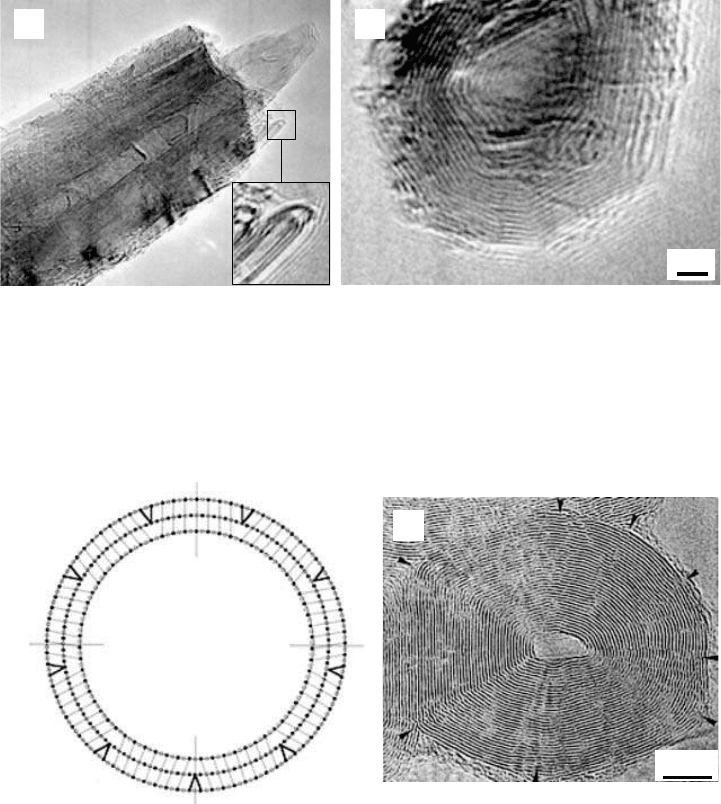
remain parallel and adopt a graphitic stacking, thus inducing some regions of stacking faults due to
the deformation of hexagons. The regions of stacking fault are assumed to be evenly distributed
along the tube circumference,
110
and are separated from the graphitic structure by interfacial dislo-
cations (bold lines in Figure 3.19a). Polygonization of carbon nanotubes therefore may appear as a
result of the necessity to allow graphitic stacking of the layers, as often seen in carbon onions
(Figure 3.19b).
110,118,119
It is easy to envision a trade-off between the energy associated with tur-
bostratic stacking vs. the strain energy associated with shape changes and stacking faults. The
mechanism prevailing depends strongly on the tube size. The relative strain required to maintain
graphitic order is smaller with increasing tube size; therefore thicker tubes are expected to have
graphitic ordering and polygonal cross sections with discrete regions of stacking faults, while thin-
ner tubes are more likely to retain turbostratic concentric structures with cylindrical cross section
and varying helicity between the individual shells.
In the near-planar regions of the polygonized tubes, an ordering of the stacking sequence of
the carbon layers gives rise to hexagonal and possibly rhombohedral graphite structure.
108
The near-
planar regions are connected into seamless shells through the regions of high curvature (
Figure 3.16b).
126 Nanotubes and Nanofibers
(a) (b)
2 nm
FIGURE 3.18 Transformation of multiwall carbon nanotubes into polygonal GPC-like structures by anneal-
ing in vacuum at 2000°C. (a) TEM image of a tube with a core nanotube in the form of stylus extension.
Arched semitoroidal structures, similar to that of GPCs, have been also formed (inset) through elimination of
dangling bonds at high temperature. (b) Polygonized cross section and graphitic walls of an annealed hollow
tube. TEM micrographs courtesy of H. Ye.
(a) (b)
5 nm
FIGURE 3.19 (a) Schematic model of a nanotube cross section. “Interfacial dislocations” (bold lines) are
introduced to accommodate the strains on the tube surfaces. The graphite stacking is maintained in the tube
walls (as indicated by lines). The full circles represent the atoms in the paper plane and the open circles are
projected positions of the atoms of the paper plane. (b) Defect regions in the HRTEM image of a carbon
“onion.” The defect regions are characterized by their abnormal image contrast.
110
Copyright 2006 by Taylor & Francis Group, LLC
A small value for the radius of curvature is preferred in regions of bending of the carbon sheets
between the extended near-planar regions because of the nature of local perturbations of the carbon
bonding arrangement.
104,105,108
A tube structure model has been proposed to explain the variation of intershell spacing as a
function of tube diameter (
Figure 3.20a). Individual intershell spacings as a function of tube diam-
eters were measured in real space from HRTEM images of various nanotubes.
112
The empirical
equation for the best fit to these data is given as
d
ˆ
0 0 2
⫽ 0.344 ⫹ 0.1e
⫺D/2
(3.10)
The function is plotted in Figure 3.20b. The large full circles show experimental values.
The increase in the intershell spacing with decreased nanotube diameter is attributed to the high
shell curvature of small diameter tubes and it has also been suggested that polygonization of the
tube cross section will occur for inner tube diameters larger than ~12 nm (see
Figure 3.16c). This
observation is in agreement with the model suggested by Zhang et al.
110
Furthermore, it has also been proposed that multiwall nanotubes most likely consist of circular
core shells and polygonal outer layers.
120
In their pioneering work on nanodiffraction from carbon
nanotubes, Liu
104
and Cowley
105
noted a possibility that there might be some nanotubes with nei-
ther entirely polygonal nor fully cylindrical cross sections. Such tubes could be considered as a mix-
ture of the two possible morphologies, with structure varying along the tube length and the shell
diameter. A schematic illustrating this model, taking into account variations of intershell spacing, is
given in Figure 3.20.
In order to obtain direct evidence of tube microstructure, there have been several cross-sectional
TEM studies.
121–124
These studies were conducted on both carbon nanotubes produced by arc-
discharge method and the tubes produced by a chemical vapor deposition. A large number of defects
in CVD tubes is very common, and it is an intrinsic property of the CVD process and, therefore,
will not be discussed further here. HRTEM images of the cross sections of tubes reveal their nested
structure, but they do not confirm models proposed by Liu,
105
Zhang,
110
and others.
112,120
Instead,
rather random dislocation lines extending radially have been recorded.
121
Graphite Whiskers, Cones, and Polyhedral Crystals 127
0.0
0.34
(a)
(b)
0.35
0.36
0.37
0.38
0.39
0.40
n=2
n=5
n=10
n=40
41
7
6
5.0 10.0
Average diameter
D
s
(nm)
15.0 20.0
d
002
spacing (nm)
∧
R
min
D
min
d
0 0 2n
∧
FIGURE 3.20 Effect of tube diameter on interplanar spacing. (a) Model for a nanotube crystal with a vary-
ing intershell spacing. (b) The d spacing is given an exponential function of tube diameter (Equation 3.10).
The intershell spacing d is plotted as a function of the average tube diameter (D
a
), where n is the number of
shells in a nanotube. The curves are calculated for n ⫽ 2, 5, 10, and 40, using the above model and Equation
3.10. The three data points shown by the large full circles were obtained based on experimental observa-
tions.
112
Insets: Model illustrating change of interplanar spacing d and polygonization of tube cross section
with increase of tube diameter, as observed in some TEM micrographs. (TEM image: courtesy of S. Welz;
scale bar, 5 nm).
Copyright 2006 by Taylor & Francis Group, LLC
Aside from their polygonal cross section, GPCs
42,115
possess another important feature that may
affect their electrical, chemical, and mechanical properties to a great extent. This is the several
nanometer thick loop-like layer (
Figure 3.17c and inset in Figure 3.18a) formed by zipping of the
adjacent graphitic shells at their terminations.
125,126
This phenomenon is also observed in edge
planes of some high-temperature planar graphites,
125,127
and on the surfaces of cup-like multiwalled
carbon nanotubes annealed in argon atmosphere above 900°C.
128
In the case of planar graphite, zip-
ping of graphitic layers (also known as “lip–lip” interactions) forms nanotube-like sleeves, while in
the case of multiwall nanotubes, the resulting structure resembles concentric polygonal hemi-
toroidal structures.
126
“Lip–lip” interactions are especially pronounced when samples are annealed
at temperatures above 1600°C.
42,51,125,128–130
The reactive edge sites transform into stable multiloops
through the elimination of dangling bonds due to enhanced carbon mobility at higher temperatures.
Multiloops are typically built by 2 to 6 adjacent graphitic layers. Typically, single-loop structures
are formed between 900 and 1200°C, while 1500°C is considered as the threshold for the formation
of multilayer loops.
128
The radius of curvature of the outer layer is similar to the average radius of
double-walled nanotubes.
131
3.3.3 PROPERTIES AND APPLICATIONS
3.3.3.1 Electronic Band Structure
Electronic properties of cylindrical single- and multiwall carbon nanotubes have been widely stud-
ied both theoretically and experimentally over the past 15 years, and findings have been summarized
in several books about carbon nanotubes,
71,132
as well as in
Chapter 1 of this book.
Electronic structure of polygonal single-wall carbon nanotubes has been investigated theoreti-
cally within a tight-binding and ab initio frameworks,
133,134
and it has been found that polygoniza-
tion changes the electronic band structure qualitatively and quantitatively. An example of a zigzag
nanotube is given. Considered is the (10, 0) tube with: a circular (a) and pentagonal (b) cross sec-
tion (Figure 3.21). The (10, 0) carbon nanotube with a circular cross section is a semiconductor,
with a band gap of 0.82 eV. In calculating the band structure of a polygonal tube, it is reasonable to
assume that the zones of strong curvatures near the edges of the polygonal tube will introduce a
σ
*–
π
* hybridization of carbon bonds. This local variation of bonding with strong sp
3
character in
the folds creates a sort of defect line in the sp
2
carbon network.
135
In addition to the effect of bond
hybridization, polygonization of the cross section lowers the symmetry from a ten- to a fivefold
128 Nanotubes and Nanofibers
−20 −15 −10 −6 −2 −1
0
Density of states (arb. units)
0 1 2
E−E
F
(eV) E−E
F
(eV)
(b)
(a)
(b)
(a)
FIGURE 3.21 Tight-binding densities of states (states/eV/cell) for the (10, 0) cylindrical (a), and the (10, 0)
5
pentagonal (b) cross-section nanotubes. The Fermi level is positioned at zero energy. Both nanotubes are also
represented in the inset on the right of their respective DOS.
134
Copyright 2006 by Taylor & Francis Group, LLC
axis. Furthermore, out-of-plane bending of the hexagonal carbon rings along the polygonal edges
brings new pair of atoms closer than the second-neighbor distance in graphite. All this leads to the
modification of the electronic band structure, and as a consequence, the semiconducting band gap
of the (10, 0) polygonal tube is almost completely closed (
Figure 3.21b). The ab initio calcula-
tions
134
confirm these tight-binding results and predict a gap of 0.08 eV for the pentagonal cross
section. Electronic behavior of metallic armchair nanotubes is not so strongly altered with polyg-
onization because the
σ
*–
π
* hybridization is not possible in the case of armchair configurations.
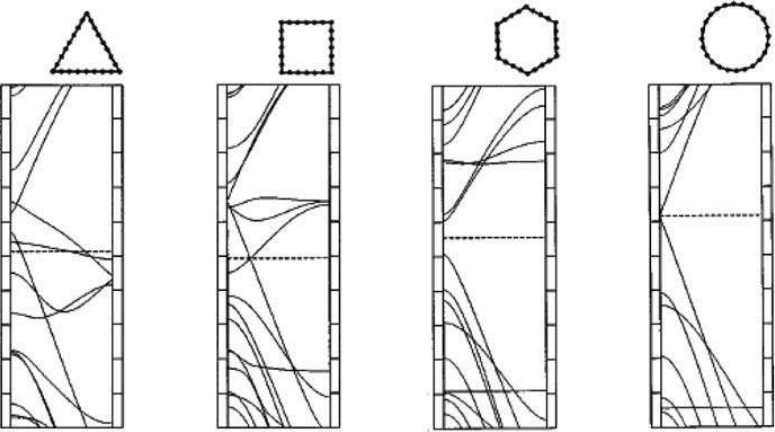
Theoretical studies also suggest that the perturbation of electronic properties of carbon nan-
otubes will be different for various degrees of polygonization (i.e., various numbers of facets).
134
An example is given for a (12, 0) nanotube. Zigzag (12, 0) nanotube of circular cross section is
metallic. When different polygonal cross sections (triangle, square, and hexagon) are considered,
the results indicate that all kinds of electronic properties arise (
Figure 3.22). The first two cases are
metallic, while the third is a 0.5 eV band gap semiconductor. It is important to remember here that
these calculations are given for a carbon nanotube comprised of a single shell.
3.3.3.2 Raman Spectra
Vibrational properties of GPCs have been studied by means of Raman spectroscopy,
42,102,115
and it
has been confirmed that they are highly graphitized structures with the extinct disorder-induced (D)
band and the strong graphitic (G) band of about the same full width at half maximum
(FWHM = 14 cm
⫺1
) as in crystals of natural graphite.
136
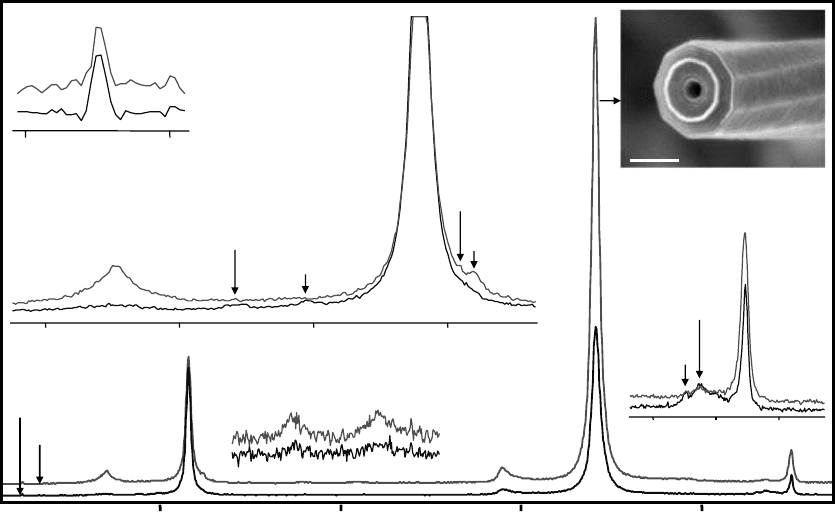
The selective micro-Raman spectra from
the crystal’s side face and tip are shown in
Figure 3.23. Spectra from the crystal faces correspond
to perfect graphite with a narrow G band at 1580 cm
−1
. In addition to 1580 cm
⫺1
peak, the spectra
from the tips feature a weak D band at 1352 cm
−1
, and an unusually strong 2-D (2706 cm
⫺1
) over-
tone that exceeds the intensity of the G band. A similar effect was observed on graphite scrolls
(Figure 3.15). Raman spectra of GPCs contain two additional bands in the second-order frequency
range at ca. 1895 and 2045 cm
⫺1
(Figure 3.23). A number of weak low-frequency bands including
a doublet at 184/192 cm
⫺1
has been observed in some samples.
42
These low-frequency bands, typ-
ical for single-wall nanotubes,
137
may come from the innermost carbon nanotube shells protruding
Graphite Whiskers, Cones, and Polyhedral Crystals 129
−2.5
−2.0
−1.5
−1.0
−0.5
0.0
E
F
Γ
E
F
E
F
E
F
0.5
1.0
1.5
Energy (eV)
2.0
−2.5
−2.0
−1.5
−1.0
−0.5
0.0
0.5
1.0
1.5
2.0
(a)
(b)
(c)
(d)
−2.5
−2.0
−1.5
−1.0
−0.5
0.0
0.5
1.0
1.5
2.0
−2.5
−2.0
−1.5
−1.0
−0.5
0.0
0.5
1.0
1.5
2.0
(12,0)
3
(12,0)
4
(12,0)
6
(12,0)
X
Γ
X
Γ
X
Γ
X
FIGURE 3.22 Tight-binding band structures of the metallic (12, 0) nanotube, illustrating the effect of the
degree of polygonization of the cross section on electronic behavior. Given here are examples of (a) the trian-
gle (12, 0)
3
, (b) square (12, 0)
4
, and (c) hexagonal (12, 0)
6
geometries that are compared to the pure cylinder
case tube (d).
134
Copyright 2006 by Taylor & Francis Group, LLC
sometimes from the GPCs (see Figure 3.17b). Low-intensity bands are also present in the range
1440 to 1500 cm
⫺1
(
Figure 3.24), the origin of which has not been unambiguously determined yet.
3.3.3.3 Chemical, Thermal, and Mechanical Stability
Functionalization and chemical activity of carbon nanotubes is the subject of intensive study, and
many breakthroughs have been made in this field over the past 5 years. Sidewalls of single-wall
carbon nanotubes have been successfully functionalized with fluorine,
138
carboxylic acid groups,
139
isocyanate groups,
140
dichlorocarbene,
141
poly-methyl methacrylate,
142
and polystyrene.
143
Various
functional groups have been attached to tube edge sites. This has made it possible to utilize carbon
nanotubes and other tubular carbon materials in the fabrication of sorbents,
144
catalyst sup-
ports,
145,146
gas storage materials,
147
and polymer matrix composites.
148,149
The effect of polygoni-
zation on chemical behavior of carbon nanotubes has not been thoroughly investigated yet; however
it is expected that polygonal tubes have chemical properties similar to those of circular multiwall
carbon nanotubes and graphite, and that they may be more reactive (less stable) along the polygo-
nal edges than in the extended near-planar regions.
120
Another interesting property of GPCs is poly-
gonized hemitoroidal edge plane terminations.
150
Transformation of active sites into loops
promotes the GPC into a more stable (or chemically inert) structure. Moreover, due to their spe-
cific spatial conformation, they allow for easier intercalation with foreign atoms such as lithium
and others.
127,151
Several methods have been utilized to probe the chemical activity of polygonal tubes. In one of
them, GPCs were intercalated with 50:50 H
2
SO
4
/HNO
3
for 1 h, washed in deionized water, dried for
24 h and then exfoliated by rapid heating at about 980°C for about 15 sec or until maximum volume
expansion is reached. GPCs survived very severe intercalation and exfoliation conditions, most of
them retaining their original shape of faceted axial whiskers, although damage in the form of cracks
along the axis and striations on the hemitoroidal surfaces was observed on most of the crystals.
130 Nanotubes and Nanofibers
100 nm
Along the crystal axis
1100 1140
1120 cm
−1
3151 cm
−1
3100 3200 3300
3174 cm
−1
3246 cm
−1
1300 1400 1500 1600
1442 cm
−1
1495 cm
−1
1609 cm
−1
1580 cm
−1
1352 cm
−1
2045 cm
−1
1895 cm
−1
1500 2000 2500 3000
1618 cm
−1
Raman shift (cm
−1
)
2706 cm
−1
2446 cm
−1
The tip
Side face
FIGURE 3.23 Fundamental modes, combination modes, and overtones in Raman spectra taken from the side
face and the tip of an individual graphite polyhedral crystal (514.5 nm excitation). Inset: an SEM micrograph
of a different crystal having structure similar to the one used to record Raman spectra.
102
Copyright 2006 by Taylor & Francis Group, LLC
Corrosion studies of graphitic polyhedral crystals showed that exposure of GPCs to overheated
steam at normal pressure for 1 h will cause their complete oxidation at temperatures between 600
and 700°C. Similarly, 700°C was determined as an onset temperature for oxidation in air. However,
they were more stable than disordered glassy carbon in supercritical water.
42
Polygonization of the cross section of a tube is not expected to significantly affect its tensile
strength, nor should it drastically affect the bending modulus of the tube. However, for a helical
polygonal multiwall nanotube, the pull-out strength is expected to be higher than in the case of its
cylindrical counterpart, because of the more favorable stress distribution upon loading.
3.4 CONCLUSIONS
Extended growth of nanotubes or fullerene cones leads to formation of a myriad of nano- and
microstructures, which are larger relatives of carbon nanotubes. Graphite cones and whiskers have
much in common with carbon nanotubes and nanofibers. They inherit the conical structure of
scrolled tubes (also known as “herring-bone” structure in carbon nanotubes). Seamless graphite
nano- and microcones can have five different apex angles with “magic” numbers of 19.2, 38.9, 60.0,
83.6, and 112.9°, which correspond to 60, 120, 180, 240, and 300° disclinations in graphite.
Scrolled conical structures may have virtually any apex angle, and very small (2 to 3°) angles have
been observed. A few other specific values also occur more frequently as they are energetically pre-
ferred because they allow the registry between graphene sheets in the cone.
Polygonization of nanotubes accompanied by growth in the radial direction leads to the forma-
tion of GPCs. They have nanotube cores and graphite crystal faces. Unusual symmetries have been
observed in GPCs. Most of them are built of co-axial graphite shells.
Cones and large nanotubes have been produced synthetically in the laboratory, and several
methods for their synthesis are known. GPCs have only been discovered in synthetic carbon mate-
rials and can be grown by CVD or hydrothermally. However, since many natural graphites have
been formed from hydrothermal deposits in nature, it would not be surprising to learn that GPCs
exist in nature as well. Large carbon nanotubes have already been observed in natural deposits along
with carbon cones.
Cones, whiskers, and GPC can bridge the nano- and microworlds and may have numerous appli-
cations, where sizes between nanotubes and carbon fibers are required. They may also have inter-
esting electronic and mechanical properties determined by their geometry. However, while their
structure has been well understood, very little is known about their properties. Properties need to be
studied before their wide-scale applications can be explored.
Graphite Whiskers, Cones, and Polyhedral Crystals 131
1300
(a) (b)
1350 1400 1450 1500
1353
1381
1452
1442
1477
1495
1478
1468
1464
Raman shift (cm
−1
) Raman shift (cm
−1
)
3100 3150 3200 3250
3151
3174
3246
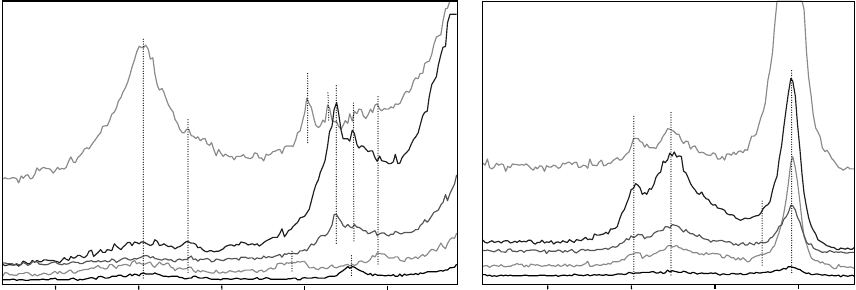
FIGURE 3.24 Raman spectra of graphite polyhedral crystals showing additional weak bands in the range:
(a) 1400 to 1500 cm
⫺1
and (b) 3100 to 3200 cm
⫺1
(for 514.5 nm excitation).
102
Copyright 2006 by Taylor & Francis Group, LLC