Gebali F. Analysis Of Computer And Communication Networks
Подождите немного. Документ загружается.

646 E Using MATLAB
4 ifA<0
5 error(’area must be positive’);
6 end
7 r = sqrt(A/pi);
Line 1 defines the new function radius and indicates that it accepts a value A
as input and produces the number r as output. Lines 2 and 3 describe briefly the
purpose of this function, and typing the command
help radius
will print out the commented lines 2 and 3 to remind the user about the function.
Line 5 prints out an error message if we attempt to find the radius of a circle with
negative area.
We could now use this function in our MATLAB code by typing
x = radius(100)
which would return x = 5.6419.
Suppose we need to evaluate two properties of the circle, such as the radius r and
the associated circumference c when the circle area is given. The above function
should be changed to
1 function radius [r,c] = radius(A)
2 % RADIUS finds the radius and circumference of
3 % a circle if the area A is given.
4 ifA<0
5 error(’area must be positive’);
6 end
7 r = sqrt(A/pi);
8 c=2*pi*r;
We could now use this function in our MATLAB code by typing
[r, c] = radius(100)
which would return r = 5.6419 and c = 35.4491.
E.15 Statistical Functions
MATLAB has two random number generators RAND and RANDN. The command
x = rand
(
m, n
)

E.15 Statistical Functions 647
Table E.5 The different formats for using the rand function
Y = rand(n) Returns a square n ×n matrix of random
entries
Y = rand(m, n) Returns an m × n matrix of random entries
Y = rand(m, n, p,...) Generates random arrays
Y = rand(size(A)) Returns an array of random entries that is the
same size as matrix A
Table E.6 The different formats for using the hist function
HIST(Y ) Draws a histogram of the elements in Y
HIST(Y, x) Draws a histogram using n bins, where n is
length(x). x also specifies the locations on
the x-axis where hist places the bins.
returns an m ×n matrix of random numbers having a uniform distribution between
0 and 1. The command
x = randn
(
m, n
)
returns an m ×n matrix of random numbers having a Gaussian distribution between
0 and 1 with zero mean and unity variance. Table E.5 explains the different ways
the rand function could be invoked.
The command
x = randperm
(
n
)
;
returns a random permutation of the integers 1 to n.
To plot the pdf of a random number sequence, the hist and stairs functions
could be used. Table E.6 explains the different ways the hist function could be
invoked. For example, if x is a 5-element vector, HIST distributes the elements of
Y into five bins centered on the x-axis at the elements in x.
Example E.1 The following MATLAB code generates a Gaussian random variable
Y with mean 0 and standard deviation 1. The number of samples will be denoted
by n. The resulting data are plotted in one curve and the histogram is plotted in an
adjacent window.
n=1000; %number of samples
y=randn(1,n);
%plot theresulting dat
subplot(1,2,1)
plot(y);
box off
axis square
xlabel(’Sample index’)
ylabel(’Randomnumber value’)

648 E Using MATLAB
%generate a histogram of the data to view thepdf
x = -2.9:0.1:2.9;
subplot(1,2,2)
hist(y)
box off
axis square
xlabel(’Sample index’)
ylabel(’Bin count’)
The output of that code can be found in Fig. 1.9 on page 18.
E.16 System of Linear Equations
Solving a system of linear equations is perhaps one of the important problems en-
countered in linear algebra. We certainly encountered this problem in our queuing
analyses. The system of linear equations is expressed as
Ax = b (E.1)
where A is a matrix, x is the vector to be found, and b is a given vector. The solution
to this equation is simply
x = A
−1
b (E.2)
where A
−1
is the inverse of A and in MATLAB this translates to
x = inv
(
A
)
∗b (E.3)
This is actually a misuse of the inv function. A better way, from both an execu-
tion time and numerical accuracy standpoint, is to use the matrix division operator
and we should write
x = A\b (E.4)
This produces the solution using Gaussian elimination without forming the
inverse.
E.16.1 A Is Overdetermined
If matrix A has more rows than columns, the system of equations is overdetermined
since the number of equations is greater than the number of unknowns. In that case
the \ and / operators find the solution that minimizes the squared error in Ax −b.
E.17 Solution of Nonlinear Equations 649
E.16.2 A Is Underdetermined
If matrix A has more columns than rows, the system of equations is underdetermined
since the number of equations is less than the number of unknowns. In that case, the
backslash \ and forwardslash / operators find the solution that has the maximum
number of zeros in x.
E.16.3 b = 0 (Homogeneous Equations)
When b = 0, we have the equation
Ax = 0(E.5)
and x is a null-vector of matrix A. A solution exists only if det
(
A
)
= 0, which
indicates that A must be rank deficient. Assuming rank
(
A
)
= n − 1, where n is the
size of A, we can find a solution by assuming a value for one of the components
of x and solving for the other components since we would have a system of n − 1
linear equations that can be solved using the backslash \ and / operators.
E.17 Solution of Nonlinear Equations
MATLAB has functions to obtain a solution for nonlinear equations or systems of
nonlinear equations.
FMINBND finds the local minimum of a nonlinear function of one variable within
an interval specified by the user
x = fminbnd(fun, x1, x2)
where FUN is a function that is described in an M-file and x1 and x2arethelower
and upper values of the interval such that x1 < x < x2.
FZERO tries to find the zero of the function near a value specified by the user:
x = fzero(fun, x0)
where FUN is a function that is described in an M-file and x0 is the value near which
the zero is expected.
FMINSEARCH is a multidimensional unconstrained nonlinear minimization based
on Nedler–Mead technique [3], [4]:
x = fminsearch( fun, x0)
returns a vector x that is a local minimizer of the function that is described in FUN
(usually an M-file: fun.m) near the starting vector x0.
650 E Using MATLAB
E.18 Formatting Output
The command format compact allows closer presentation of MATLAB results.
Reference
1. The Math Works, Inc. info@mathworks.com.
2. Scientific Work Place. http://www.mackichan.com.
3. J.C. Lagarias, J.A. Reed, M.H. Wright, and P.E. Wright, “Convergence properties of the Nedler-
Mead simplex algorithm in low dimensions”, SIAM Journal on Optimization, vol. 9, no. 1,
pp. 112–147, 1998.
4. Nedler, J.A. and Mead, R., “A Simplex Method for Function Minimization”, Computer Journal,
vol. 7, pp. 308–313, 1965.
Appendix F
Database Design
F.1 Introduction
Each switch or router has a routing table or a lookup table, which is basically a
database associating the packet header information with routing and control infor-
mation such as priority, service class, updated VPI/VCI values, and destination out-
put port. Because it is a database, standard database issues are encountered such as
1. The sorting scheme used
2. How a search is performed
3. Inserting data
4. Deleting data
5. Average access time for insert, search, and delete operations
6. Percentage of memory utilized
We shall explain two schemes for implementing the database using hashing func-
tions and trees.
F.2 Hashing
Hashing is a technique used to implement databases where insert, search, and delete
operations are performed. Hashing is the transformation of a search key into a num-
ber by means of mathematical calculations. The search time using hashing is small,
which is an advantage over other search algorithms [1–3]. The mathematical opera-
tion is usually called hash function and the resulting number is called the hash value.
The number of bits required to represent the hash value is substantially smaller than
the number of bits required to represent the key itself.
If x is the key and h
(
x
)
is the resulting hash value, then we can divide our mem-
ory into Bbuckets. The entries corresponding to key z are stored in the bucket whose
label is h
(
x
)
. Each bucket stores the data in the form of a heap, which is nothing but
a linked list that links all the data in the bucket with no particular order (i.e., like a
heap).
651
652 F Database Design
A good hashing function must be able to equally distribute all possible entries of
x among the buckets. In other words, we are hoping that the lengths of the linked
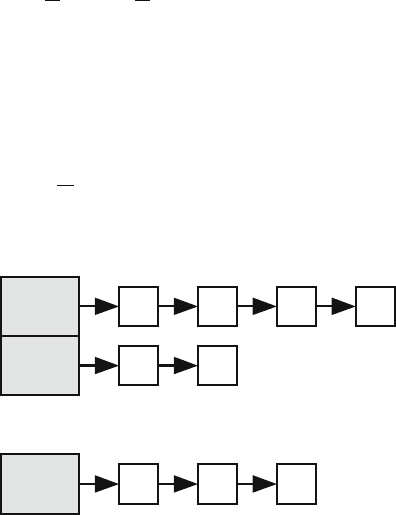
lists in all buckets be equal so that the search time becomes small. Figure F.1 shows
the open hashing data organization where each bucket has associated with it a linked
list. Assume N is the number of entries in the set, which could be the number of
connections established in an ATM switch or the number of available routes in an
IP router.
Some hash functions are better than others at randomizing the hash values. The
use of linear feedback shift registers (LFSR) for polynomial division is one such
function, which is sometimes known as cyclic redundancy check (CRC). If the num-
ber of bits in the LFSR is b, then the number of buckets used is B = 2
b
. Another
hashing function that was based on the linear congruential method calculates h using
modulo arithmetic:
h =
(
x × y + 1
)
mod B (F.1)
where y is a number with no particular pattern in its digits except that it should end
with ···x21, with x even [2].
Assume N to be the number of data items stored in the database and B to be
the number of buckets. The probability that a certain bucket contains i data items is
given by
p
i
=
N
i
1
B
i
1 −
1
B
N−i
(F.2)
The average length of the linked list in a bucket is given by
L =
N
i=0
ip
i
(F.3)
=
N
B
(F.4)
Fig. F.1 Storage of data
using hashing
Bins
2
B
1
Linked lists associated with each bin
. . .
. . .

F.3 Trees 653
When N ∼ B, then each linked list will have only one entry and the search time
will be small independent of N. The time required to implement insert, search, and
delete operations will be on the average equal to
T = T
h
+
T
m
+ T
a
2
N
B
(F.5)
where the time delays encountered account for the following operations:
T
h
= Hashing function
T
m
= Memory access
T
a
= Arithmetic operations (e.g., comparison)
We must have N > B and (F.5) becomes
T ≈
T
m
+ T
a
2
N
B
(F.6)
We see that the delays T
m
and T
a
dominate our table lookup delay. It is worth-
while investigating how to speed up the memory and the arithmetic operations re-
quired than investigating fast hashing functions.
F.3 Trees
The search time is not deterministic in hashing or in binary tree types of data orga-
nization. Balanced trees (B-tree) guarantee that the worst-case search time will not
occur.
F.3.1 Binary Trees
Assume that we have to store numbers between 0 and 15. Later, we will want to
check if a number has been stored or not. For that, we sort our numbers using binary
sorting and store our data in a binary tree structure. Each node in the tree contains
a key and the left branch is used if the number is smaller than the key. The right
branch is used if the number is larger than the key.
Figure F.2 shows the binary search tree structure after several insertion and dele-
tion operations. Each node stores data which doubles also as keys while performing
a search.
It is apparent that the tree is unbalanced and the search time for a data item could
be very short or very long. In the worst case, the depth of the tree could be equal
to the number of data stored in it unless some ordering strategy is enforced. These
techniques are called balancing and will be discussed in the next sections.
654 F Database Design
Fig. F.2 Binary search tree
structure after several
insertion and deletion
operations
5
6
7
8
13
12
14
In addition to the worst-case time delay problem, we should mention that search-
ing a tree implies comparing the search key to the contents of the nodes. This is
really a subtraction operation and its delay depends on the speed of the adder in the
switch processor. Typically, the number of bits used to represent the keys is 48 and
this could require a significant adder delay.
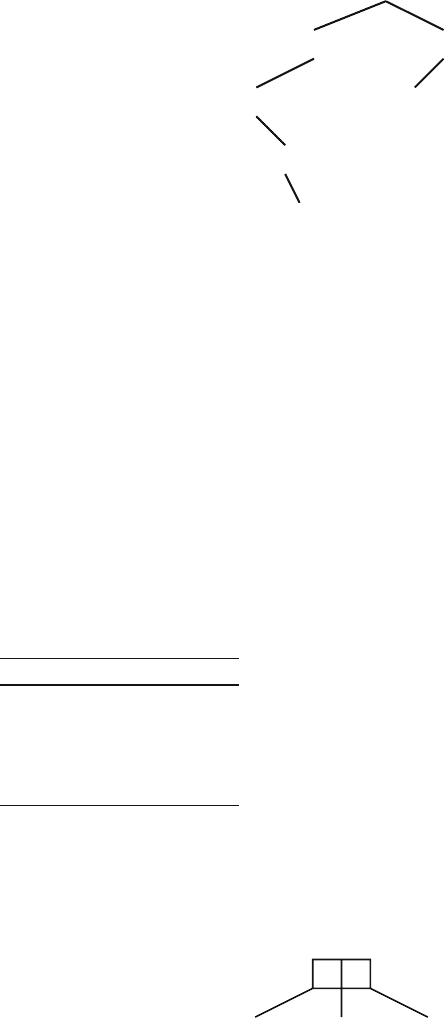
F.3.2 Multiway Trees
Multiway trees offer a short search time for large databases where the worst-case
time is guaranteed not to occur. In a multiway tree, each node stores several keys,
not just one as in the binary tree such that each node can have up to m children.
Figure F.3 shows a node in a multiway tree containing two keys k
0
and k
1
.
Assuming m−1 keys and m branches per node, the keys are ordered in each node
and the branches out of the node are for keys that have the following properties:
Branch Property
0 k < k
0
1 k
0
< k < k
1
.
.
.
.
.
.
m − 2 k
m−2
< k < k
m−1
m − 1 k
m−1
< k
Multiway trees suffer from the same problem as binary trees when adding and
removing data results in an unbalanced tree with potentially long search times. This
Fig. F.3 A node in a
multiway tree where each
node contains two keys
k < k
o
k
1
k
o
k
o
< k < k
1
k
1
< k
F.3 Trees 655
Fig. F.4 State of a multiway
2-tree after several insertion
and deletion operations. Like
the binary tree, it is also
unbalanced
37
4015
11
25 45
12
4 10
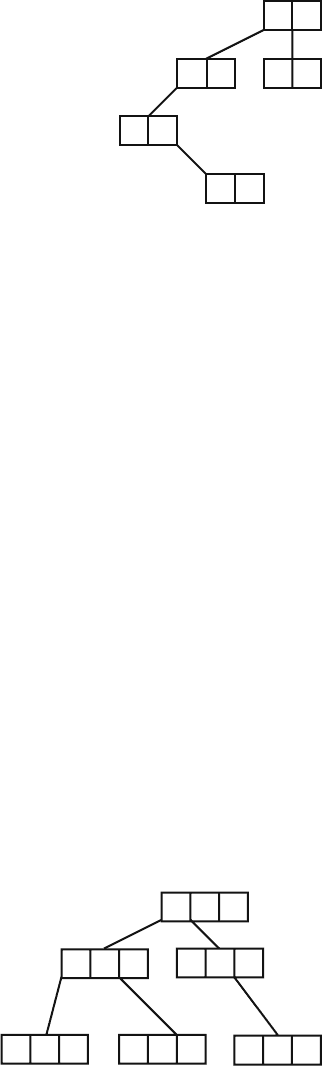
is illustrated in Fig. F.4 which shows the state of a 2-tree after some insertions and
deletions. Multiway trees form the basis for the B-trees as explained in the next
section.
F.3.3 B-Trees
There are many ways to define a B-tree. We choose a simple definition here. A
B-tree of order m is a multiway tree with certain restrictions or properties that
insure that the tree will always remain balanced. The properties of the B-tree are
as follows:
1. The root node contains 1 to 2m keys.
2. The root node contains up to m children (pointers to other nodes).
3. Any other node that is not the root node contains m/2 to m − 1 keys. Thus
each node is at least half-full, except for the root node.
4. Any other node that is not the root node contains m/2 to m children.
These properties ensure that no more than 50% of the memory space is wasted.
In the worst case, all nodes are half-full and the parent node has only one key and
two children.
Figure F.5 shows an example of a B-tree of order 5 after several insertion and
deletion operations. Since m = 5, the number of keys in any node, except the root,
is at most m −1 = 4. The number of children per node must be between m/2 = 3
(after rounding up) and m = 5asshown.
Fig. F.5 The structure of a
B-tree of order 5 after some
insertion and deletion
operations
25
810
40
3630
61215
20
37 39
4