Ellis A.M., Feher M., Wright T. Electronic and Photoelectron Spectroscopy: Fundamentals and Case Studies
Подождите немного. Документ загружается.

17 Photoionization spectrum of diphenylamine
145
N
H
f
f
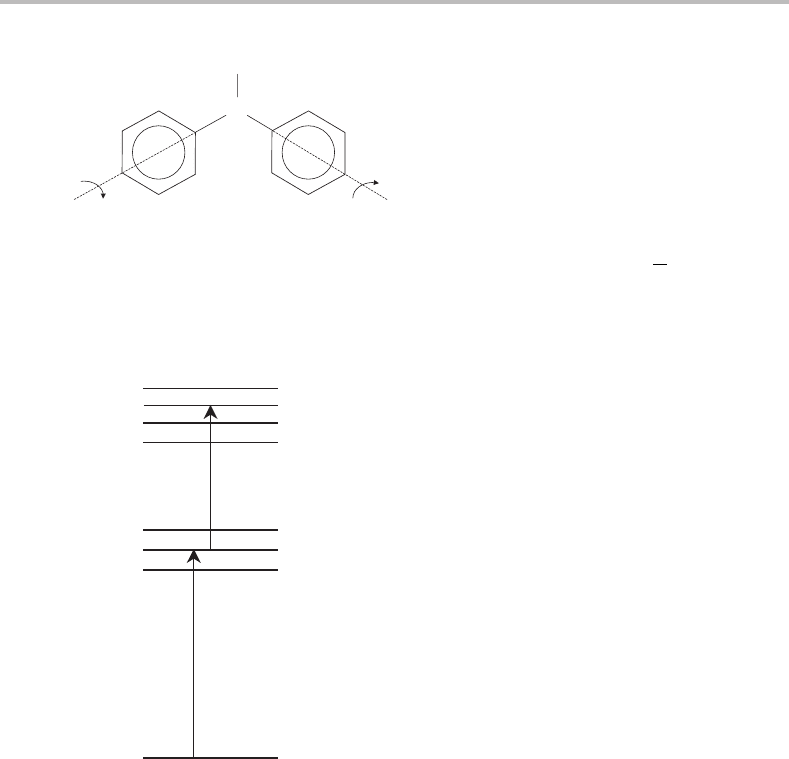
Figure 17.1 The structure of diphenylamine (DPA). The angle φ is the torsional coordinate and
corresponds to twisting (in opposite senses) of the two phenyl rings about the C
N bonds. φ = 0
◦
corresponds to a planar arrangement of the two phenyl rings. When planar, DPA has C
2v
point group
symmetry, as in the ground electronic state, but when φ = 0 the symmetry is lowered to C
2
.Itisthe
torsional vibration that is responsible for the bulk of the vibrational structure in Figure 17.3.
v″ = 0
v′ = 0
1
2
v
ion
= 0
2
3
DPA
DPA*
DPA
+
hn
1
hn
2
Figure 17.2 Laser excitation process employed in the MATI spectroscopy of DPA. The first laser
pulse, of wavelength λ
1
,excites the DPA from the zero-point level in S
0
to a specific vibrational
level in S
1
.Avery short time later (∼1 ns) a second dye pulse, of wavelength λ
2
, produces resonant
excitation to a specific vibrational level of the DPA cation in its ground electronic state. A single
active vibrational mode is assumed in this simple diagram.
kinetic energy is zero (see Sections 12.5 and 12.6 for more details). The excitation process
is summarized in Figure 17.2.Itisimportant to recognize that the delay between the light
pulses from the two dye lasers must be carefully controlled and kept very short, on the
order of nanoseconds, otherwise the S
1
state will depopulate by mechanisms other than
photoionization, e.g. by fluorescence back down to the ground electronic state.
Since the ionization process is channelled through a resonant intermediate state, S
1
,
the photoionization spectrum can be treated as if originating from that state. As mentioned
above, it is possible to vary the specific vibrational level of the S
1
state from which ionization
takes place by appropriate choice of λ
1
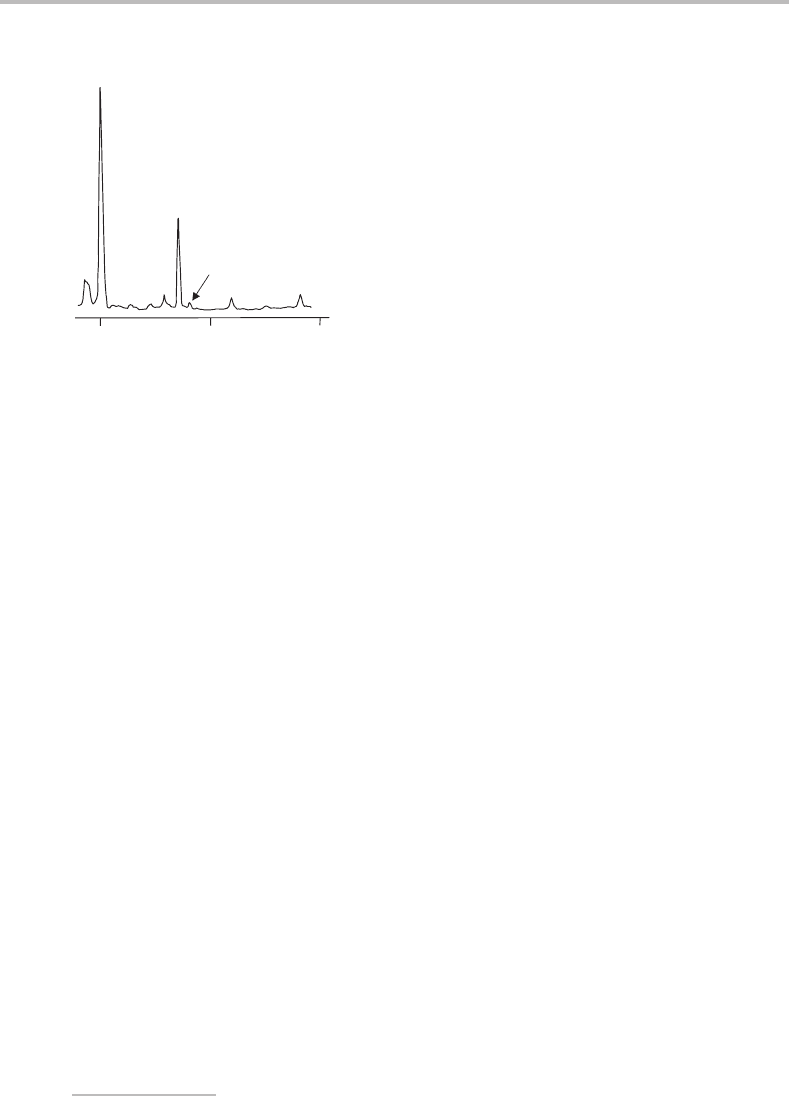
.Figure 17.3 shows spectra originating out of v
=0, 1,
and2ofS
1
,where v
refers to the vibrational quantum number of the torsional mode of DPA
146 Case Studies
Two-photon wavenumber/cm
−1
58400 5920059000
v
ion
0510
15
v′
′′
′ = 2
v′
′′
′ = 1
v′
′′
′ = 0
59400
58800
58600
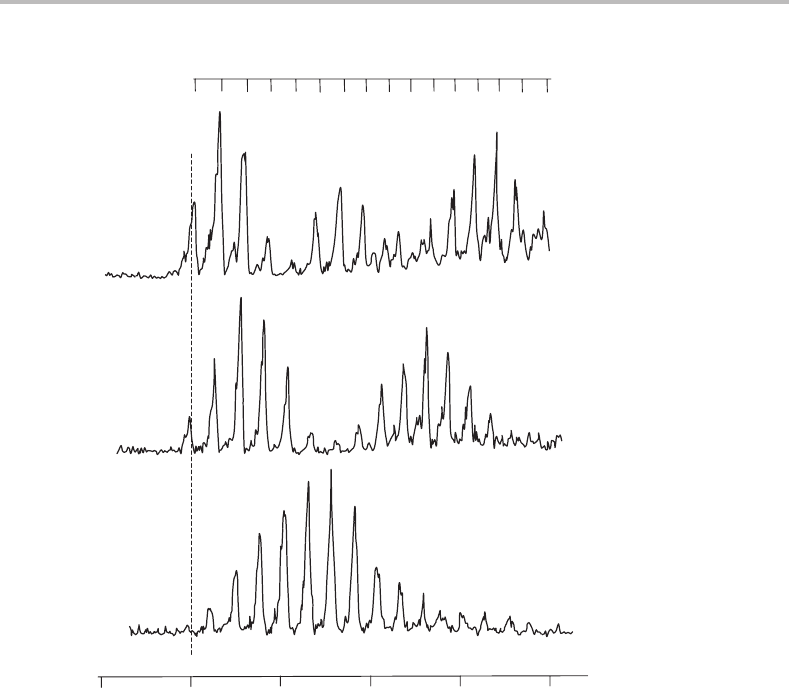
Figure 17.3 Photoionization spectra of DPA recorded by resonance-enhanced photoionization via the
(a) v
=0, (b) v
=1, and (c) v
=2 torsional levels of the S
1
state. The total energy needed for adiabatic
ionization of DPA is indicated by the dashed vertical line and is 58 600 ± 5cm
−1
. (Reproduced from
M. G. H. Boogaarts, P. C. Hinnen, and G. Meijer, Chem. Phys. Lett. 223 (1994) 537, with permission
from Elsevier.)
in S
1
. The torsional mode involves twisting of the two phenyl rings relative to each other,
and corresponds to the motion in the angle φ in Figure 17.1.IfDPA w ere planar in both
the S
0
and S
1
states then Franck–Condon arguments would preclude significant torsion
vibrational structure in the S
1
← S
0
spectrum. The fact that such structure is observed
indicates a change in geometry in the direction of the phenyl torsion normal coordinate, i.e.
a change in equilibrium value of angle φ.Infact DPA is known to be planar in the S
0
state
but in the S
1
state the two phenyl rings twist relative to each other by about 35
◦
in opposite
directions relative to the C–N–C plane to produce a non-planar equilibrium geometry [2].
Thus in the state with lowest symmetry, the S
1
state with C
2
point group symmetry, the

17 Photoionization spectrum of diphenylamine
147
phenyl torsion is a totally symmetric normal mode and so there is no vibrational selection
rule, i.e. v can take any value in the S
1
–S
0
transition.
A number of conclusions can be drawn from inspection of Figure 17.3.First, the vibra-
tional structure is dominated by a progression in a single mode, as is especially evident for
photoionization from v
= 0. The vibrational interval is rather small, about 53 cm
−1
, and
therefore a low frequency vibration in the cation is responsible. The phenyl torsion would
be expected to be a low-frequency mode, since it involves the twisting of two relatively
heavy phenyl groups, and is therefore the likely candidate for the progressions. In fact it
is possible to discern a small contribution from another active mode, with a frequency of
∼400 cm
−1
,which is most noticeable in the spectrum for photoionization from v
= 2.
However, this additional active mode will be ignored since it gives only very weak features.
The vibrational numbering for the torsional mode in the ion is given at the top of
Figure 17.3 and applies to all three spectra. How was this numbering arrived at? It is
not always easy to establish the vibrational numbering in an electronic spectrum by simple
inspection, since it is not unusual to find that the early members of a progression are too
weak to observe. Consider the bottom trace in Figure 17.3,which is the spectrum for pho-
toionization via v
=0inthe S
1
state. The most intense band clearly corresponds to v
ion
0,
which reveals that there is a substantial change in the torsion angle in moving from S
1
to
the ground electronic state of the cation. It is not obvious that the very weak peak attributed
to v
ion
= 0, which is barely perceptible above the background noise, is correctly assigned.
However, confirmation is provided by the middle and top spectra in Figure 17.3,where the
observed band at lowest wavenumber is the same for these spectra. The first band becomes
much stronger for excitation through v
= 1 and v
= 2 and yet no additional band appears
at lower wavenumber, proving conclusively that the first band corresponds to v
ion
= 0.
The different intensity distributions in the three spectra are rather interesting and can
be explained by employing the quantum mechanical form of the Franck–Condon principle.
This states that the transition probability for a particular member of a vibrational progression
is proportional to the square of the vibrational overlap integral for the two electronic states
involved in the electronic transition (see Section 7.2.2). Key to interpreting the intensity
distributions is to recognize that the long progression in the torsional mode indicates a
substantial change in the torsional angle φ on excitation from S
1
to the ground electronic
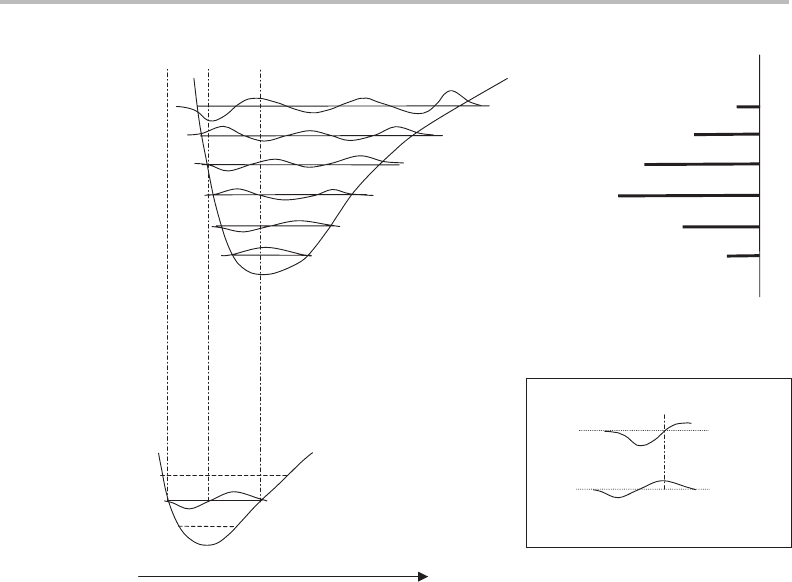
state of the ion. This is represented in Figure 17.4 by a displacement of potential energy
curves for these two states. Consequently, to explain the intensity profiles it is only necessary
to consider those parts of the vibrational wavefunctions where significant overlap is possible.
This region is marked on Figure 17.4 by the dashed vertical lines for the specific case
of transitions out of v
= 1, and corresponds to the full spatial extent of the lower state
vibrational wavefunction, ψ
v
=1
.
Projecting ψ
v
=1
vertically upwards, overlap with the ion vibrational wavefunction
improves from v
ion
= 0 → 2. Thereafter the overlap decreases because of cancellation
of regions of positive and negative overlap. This is specifically illustrated in the inset of
Figure 17.4 in the lower right corner, which brings together the wavefunctions for v
= 1
and v
ion
= 5. The peak of the wavefunction for v
ion
= 5 lies almost directly above the node
for v
= 1. As usual in integration, a definite integral evaluated between the limits a and c
148 Case Studies
2-0
0-0
1-0
3-0
4-0
5-0
v
′
= 0
v
′
= 1
v
′
= 2
v
ion
= 0
v
ion
= 2
v
ion
= 1
v
ion
= 4
v
ion
= 3
v
ion
= 5
v
′
= 1
v
ion
= 5
DPA*
DPA
+
Torsional angle
Figure 17.4 This diagram (not to scale) provides the basis for understanding the relative band inten-
sities in the torsional progressions in Figure 17.3. The upper potential energy curve is for the DPA
cation, while the lower curve is for the S
1
excited electronic state of neutral DPA. The horizontal
coordinate corresponds to a change in torsional angle, φ.Vibrational wavefunctions in the ion up
to v
ion
= 5 are shown, while only that for v
= 1inthe S
1
state is explicitly shown. On the upper
right-hand side a stick drawing of the MATI spectrum is shown with the lines coinciding with the
specific ion vibrational levels accessed. The inset in the bottom right corner shows an expanded view
of the v
= 1 and v
ion
= 5wavefunctions (see text for more details).
can be rewritten as
c
a
f (x)dx =
b
a
f (x)dx +
c
b
f (x)dx
where f (x)isthe function being integrated, and b lies between a and c.Inother words, the
overlap integral between v
= 1 and v
ion
= 5 can be expressed as the sum of the overlap
integrals originating either side of the node in v
= 1. These overlap integrals will have
similar magnitudes but opposite signs, since the phase of ψ
v
=1
changes as the node is
crossed whereas the vibrational wavefunction in the ion has the same sign over most of this
region. Consequently, a small overlap integral will result and this explains why the transition
v
ion
= 5 ← v
= 1isrelatively weak.
A particularly interesting feature of the MATI spectrum via v
= 1isthat the intensity
of the progression begins to rise again above v
ion
= 6. This is because the ion torsional

17 Photoionization spectrum of diphenylamine
149
wavefunction becomes increasingly peaked near the inner turning point of the potential
energy curve, and this turning point shifts increasingly to the left as the vibrational ladder
is climbed. The overlap is now concentrated on the left-hand lobe of ψ
v
=1
, reducing the
effect of overlap cancellation due to the change in phase of ψ
v
=1
.Eventually, above v
=13
according to the spectrum in Figure 17.3, the main lobe of the ion wavefunction moves
beyond the inner turning point of the potential curve for S
1
, and so the Franck–Condon
factor decays towards zero as v
ion
increases further.
What is clear for the MATI transitions via v
=1isthat the spectrum reflects the shape of
the v
=1 vibrational wavefunction. This fascinating result is mirrored for MATI transitions
via v
=0 and v
=2, where zero and two ‘nodes’ are seen, respectively. (One of the nodes for
the v
= 2 case is partly obscured by activity in an additional vibrational mode mentioned
earlier.) The observation of intensity ‘nodes’ in long vibrational progressions is a well-
known phenomenon that has been used in some cases as a means of assigning vibrational
quantum numbers. Notice that in this case the original assignment of torsional vibrational
quantum numbers in S
1
is confirmed by the intensity distributions.
Finally, notice that the onset of the photoionization spectra in Figure 17.3 provides a
rather precise value for the adiabatic ionization energy of DPA.
References
1. M. G. H. Boogaarts, P. C. Hinnen, and G. Meijer, Chem. Phys. Lett. 223 (1994) 537.
2. J. R. Huber and J. E. Adams, Ber. Bunsenges. Phys. Chem. 78 (1974) 217.

18
Vibrational structure in the
electronic spectrum of
1,4-benzodioxan: assignment
of low frequency modes
Concepts illustrated: low frequency vibrations in complex molecules; ab initio
calculation of vibrational frequencies; laser-induced fluorescence (excitation and
dispersed) spectroscopy; vibrational assignments and Franck–Condon principle.
This Case Study demonstrates some of the subtle arguments that can be employed in assign-
ing vibrational features in electronic spectra. It also provides an illustration of how impor-
tant structural information on a fairly complex molecule can be extracted. The original
work was carried out by Gordon and Hollas using both direct absorption spectroscopy of
1,4-benzodioxan vapour and laser-induced fluorescence (LIF) spectroscopy in a supersonic
jet [1]. The direct absorption spectra were of a room temperature sample and were therefore
more congested than the jet-cooled LIF spectra. Nevertheless, the direct absorption data
provided important information, as will be seen shortly. For the LIF experiments, both exci-
tation and dispersed fluorescence methods were employed (see Section 11.2 for experimental
details). Only a few selected aspects of the work by Gordon and Hollas are discussed here;
the interested reader should consult the original papers for a more comprehensive account
[1, 2].
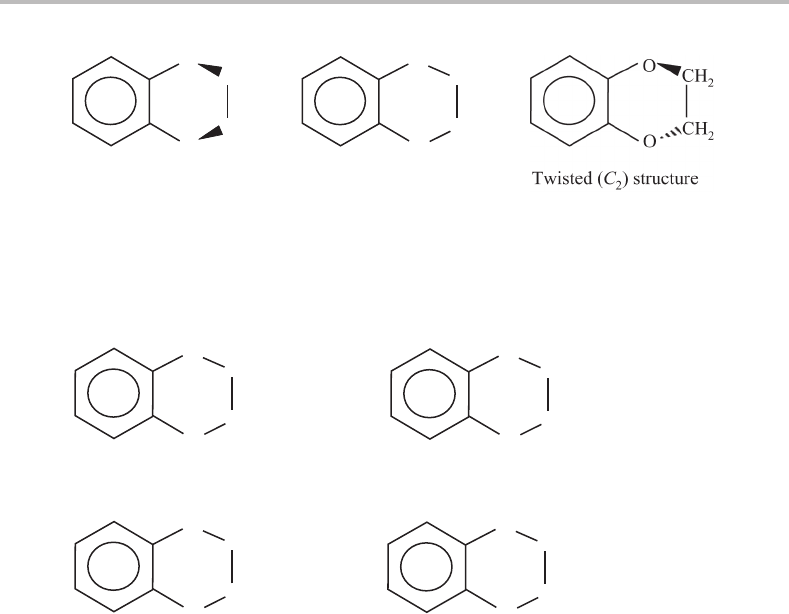
Possible structures of 1,4-benzodioxan are shown in Figure 18.1. Assuming planarity of
the benzene ring, there are three feasible structures that differ in the conformation of the
dioxan ring. One possibility is that both C
O bonds are displaced above (or equivalently
below) the plane of the benzene ring yielding a folded structure with only a plane of
symmetry (C
s
point group symmetry). Alternatively, the dioxan ring could be in the same
plane as the benzene ring (C
2v
), or a twisted structure might occur in which the C2 C3
bond bisects the plane defined by the benzene ring by some non-zero angle (C
2
). It should
occur to the reader that it might be possible to distinguish between these possibilities on
the basis of vibrational structure in the electronic spectrum, since the vibrational selection
rules will be altered by a change of point group symmetry.
On further reflection the potential complexity of the vibrational structure might seem
discouraging given that 1,4-benzodioxan has 3N − 6 = 48 normal modes! However, three
150
18 Vibrational structure in spectrum of 1,4-benzodioxan
151
O
O
CH
2
CH
2
Folded (C
s
) structure Planar (C
2v
) structure
O
O
CH
2
CH
2
Figure 18.1 Possible structures for 1,4-benzodioxan which differ in the conformation of the dioxan
ring. The point group symmetries for each particular structure are in parentheses. Although not shown,
the convention for numbering the framework atoms is to number them 1 through 10, starting from the
upper O atom and continuing clockwise around the entire two-ring system.
O
O
CH
2
CH
2
−
−
+
+
+
+
n
47
O
O
CH
2
CH
2
−
−
+
+
n
48
+
+
O
O
CH
2
CH
2
−
−
+
+
n
24
O
O
CH
2
CH
2
−
−
+
+
n
25
Figure 18.2 Illustration of the four low frequency skeletal vibrations ν
24
, ν
25
, ν
47
, and ν
48
for a planar
(C
2v
) structure of 1,4-benzodioxan. These vibrations take on a similar appearance for the C
s
and C
2
structures, although their symmetries differ. The +and −symbols refer to out-of-plane displacements
of the atoms, the − displacement being in the opposite sense to the + displacement.
factors offer some hope. First, whichever of the three conformations is the actual global
equilibrium geometry, the fact that there is some symmetry in each case will limit the number
of totally symmetric modes, and it is these whichnearlyalwaysdominate in electronic spectra
for reasons explained in Section 7.2.3 (and seen also in the previous Case Study). Second,
many of the totally symmetric vibrational modes will not give rise to any detectable spectral
features if there is no significant geometry change in the direction of the respective normal
coordinates on electronic excitation. In other words, not all totally symmetric modes need
be significantly Franck–Condon active. Finally, there are many vibrations but only the out-
of-plane skeletal modes in the dioxan portion of the molecule will be significantly affected
by any changes in the conformation of the dioxan ring. By comparison with similar modes
in other molecules, the twisting and bending motions of the O1–C2–C3–O4 group would be
expected to have relatively low frequencies, typically <300 cm
−1
. Consequently, the focus
can be restricted to the region where higher frequency modes, such as skeletal stretching
vibrations, cannot be observed.
The four vibrations considered by Gordon and Hollas are shown schematically in
Figure 18.2. They are: the O1–C2–C3–O4 twist, designated v
25
; the O1–C10–C5–O4 twist,

152 Case Studies
v
24
; the puckering of the dioxan ring about O1–O4, v
48
; and the ‘butterfly’ bending of the
two rings about C5–C10, v
47
.IfC
s
symmetry pertains, then only v
47
and v
48
will be totally
symmetric, while if a twisted (C
2
) structure occurs then v
24
and v
25
will be totally symmetric
and v
47
and v
48
will be non-totally symmetric. All four of these modes will be non-totally
symmetric if the molecule has C
2v
symmetry.
18.1 Ab initio calculations
To help assign the spectrum, we will make use of the results from ab initio calculations. In
turning to ab initio calculations for help the question of structure is in one sense immediately
answered. However, it is always important to obtain experimental verification since the
calculations may involve approximations that give misleading predictions. It is also worth
noting that in the original spectroscopic work by Gordon and Hollas they did not have the
luxury of being supported by ab initio calculations.
The ab initio calculations we turn to were reported by Choo and co-workers [3]several
years after the studies by Gordon and Hollas. They made use of both Hartree–Fock (HF)
and density functional theory (DFT), both of which are described in Appendix B. The
DFT method, and especially a particular variant known as B3LYP, tends to be a significant
improvement on the Hartree–Fock method for predicting both structures and harmonic
vibrational frequencies without incurring much extra computational cost. The calculations
by Choo et al. predicted that the twisted structure (C
2
)isthe equilibrium structure. We now
use the spectra to confirm this prediction.
18.2 Assigning the spectra
Figure 18.3 shows a portion of the LIF excitation spectrum of jet-cooled benzodioxan. Two
main bands are seen, the strongest at 35 563 cm
−1
and another at 35 703 cm
−1
. All bands in
the spectrum, weak and strong, are due to transitions from the ground electronic state, which
is a spin singlet and will therefore be designated S
0
,tothe first excited singlet electronic
state, designated S
1
. The strongest band corresponds to the origin transition of the S
1
–S
0
system, i.e. it is due to excitation from the zero-point vibrational level in S
0
to the zero-
point level in S
1
.Byconvention, this is labelled 0
0
0
. The 140 cm
−1
separation between the
origin and the other strong band, labelled A in Figure 18.3,isconsistent with a vibrational
progression involving excitation of a low frequency mode in the S
1
electronic state. The
vibrational mode responsible will, for the moment, be left unassigned. Presumably the
transition is from v
A
=0inthe lower electronic state (S
0
) and v
A
=1inthe upper electronic
state (S
1
) and can therefore be labelled A
1
0
.
Confirmation that band A is due to vibrational excitation in S
1
comes from dispersed
fluorescence spectra. Dispersed fluorescence spectra obtained by laser pumping of the origin
(0
0
0
) and A
1
0
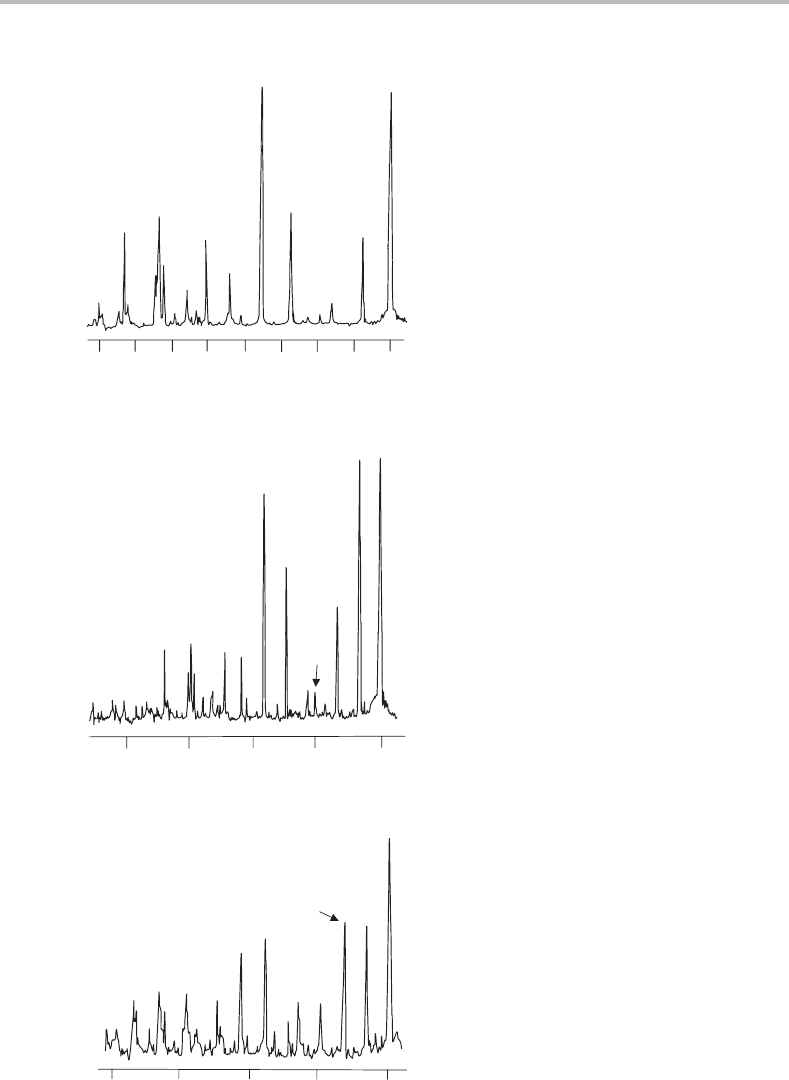
transitions are shown in Figures 18.4(a) and 18.4(b), respectively. A progres-
sion with an interval of ∼164 cm
−1
is obvious in the low frequency part of the spectrum in
Figure 18.4(a). There are also other strong vibrational features in Figure 18.4(a) but they
18 Vibrational structure in spectrum of 1,4-benzodioxan
153
0 200 400
0
0
0
A
B
Relative wavenumber/cm
−1
Figure 18.3 Laser-induced fluorescence excitation spectrum of 1,4-benzodioxan cooled in a super-
sonic jet. The wavenumber scale is relative to the position of the electronic origin band (0
0
0
), which
has an absolute wavenumber of 35 562.48 cm
−1
. The assignment of bands A and B is discussed in
detail in the text. (Reproduced with permission from R. D. Gordon and J. M. Hollas, J. Chem. Phys.
99 (1993) 3380, American Institute of Physics.)
involve modes above 400 cm
−1
and are therefore not of interest here. The 164 cm
−1
interval
is not dissimilar to the 0
0
0
–A
1
0
separation in the excitation spectrum and it is therefore
tempting to suggest that mode A is also responsible for the low frequency structure in
Figure 18.4(a). Proof that this is indeed the case comes from the dispersed fluorescence spec-
trum in Figure 18.4(b). Laser excitation of a particular mode in the excited electronic state
should lead to an enhanced progression in that mode in the dispersed fluorescence spectrum.
The same low frequency progression as seen in Figure 18.4(a) is clearly more prominent in
Figure 18.4(b) and therefore mode A must be responsible. This use of dispersed fluores-
cence spectra to confirm vibrational assignments in an excitation spectrum is frequently
employed by spectroscopists studying electronic spectra and is a powerful tool. The dis-
persed fluorescence spectrum also provides specific information on the vibrational levels
in the ground electronic state, whereas the excitation spectrum provides complementary
information for the excited electronic state.
Table 18.1 shows the predicted frequencies from the ab initio calculations by Choo and
co-workers for the low frequency vibrations [3]. Comparing the measured frequency for
mode A in the ground electronic state with the ab initio values, the only feasible assignment
is to the ring twist (v
25
). The agreement between theory and experiment is good, the differ-
ence being only 7 cm
−1
for the DFT calculation. Some differences would be expected due to
approximations inherent in the DFT method. Furthermore, the calculations give harmonic
vibrational frequencies whereas the experimental values are fundamental frequencies.
1
1
A transition between v = 0 and v = 1levels for a given vibrational mode is known as the vibrational fundamental
transition. The separation between these levels is approximately equal to the harmonic vibrational wavenumber, but
an exact value would take into account the small but non-negligible contributions from vibrational anharmonicity.
154 Case Studies
0
−400
−800−1200−1600
0
0
0
Relative wavenumber/cm
−1
0
1
A
0
2
A
−500−1000−1500−2000 0
1
0
A
1
1
A
1
2
A
1
3
A
Relative wavenumber/cm
−1
−1000−1500−2000 −500 0
B
B1
B2
Relative wavenumber/cm
−1
(a)
(b)
(c)
Figure 18.4 Dispersed fluorescence spectra obtained by laser excitation of the (a) 0
0
0
, (b) A, and (c) B
transitions shown in Figure 18.3. (Reproduced with permission from R. D. Gordon and J. M. Hollas,
J. Chem. Phys. 99 (1993) 3380, American Institute of Physics.)