Ellis A.M., Feher M., Wright T. Electronic and Photoelectron Spectroscopy: Fundamentals and Case Studies
Подождите немного. Документ загружается.


13 Ultraviolet photoelectron spectrum of CO
115
13.2 First photoelectron band system
From the discussion above, the first photoelectron band envelope is expected to arise from
the ionization process
CO
+
(X
2
+
) + e
−
← CO(X
1
+
)
A strong peak is observed at 14.01 eV and is followed by much weaker peaks at higher
ionization energies. The resolution is far too low (c.50meV ≡ 400 cm
−1
)toresolve
rotational structure, so any structure within this band must be vibrational in origin. The lack
of prominent vibrational structure is indicative of little change in the C
−O bond length on
ionization: this follows from the Franck–Condon principle (see Section 7.2.2) and suggests
that ionization is from a non-bonding orbital. In such a case the potential energy curves
for the neutral molecule and the cation will look very similar. Consequently, the strongest
feature must arise from the 0 ←0 transition, where the two numbers refer to the vibrational
quantum number in the ion and neutral molecule, respectively.
The weak peak at 14.28 eV is due to the 1 ← 0 transition. The difference in energy
between the first and second peaks corresponds to the energy difference between the v = 0
and v = 1 vibrational levels in the cation in its X
2
+
state. Converting to wavenumbers
(1 eV ≡ 8066 cm
−1
)gives a separation of 2180 cm
−1
.Byfeeding the quantum numbers into
equation (5.14), this separation is found to be equivalent to ω
e
− 2ω
e
x
e
for the ion. Without
observing further members of the progression, it is impossible to deduce both ω
e
and ω
e
x
e
.
However, ω
e
x
e
is normally much smaller than ω
e
and so it is a reasonable approximation to
associate ω
e
with the observed vibrational interval.
For the ground state of CO, infrared spectroscopy has yielded ω
e
= 2170 cm
−1
. This is
similar to the interval in the first photoelectron band and implies very similar force constants.
This in turn is consistent with the suggestion made earlier that the potential energy curves
in the ground electronic states of the neutral molecule and the cation are very similar. The
conclusion is therefore that the 5σ orbital is mainly non-bonding.
13.3 Second photoelectron band system
The second band system has a very different intensity profile from that of the first. A
regular vibrational progression is formed in which the first member, at 16.53 eV, is not the
most intense. This immediately indicates a substantial change in the C
O bond length on
ionization, and consequently the neutral and cationic potential energy curves are displaced
with respect to each other.
The separation between adjacent members of the progression is measured to be
∼1530 cm
−1
which, employing the argument made above, approximates to the harmonic
vibrational frequency. There is clearly a large decrease in vibrational frequency upon ioniza-
tion to the first excited state of the ion, demonstrating that the electron removed is strongly
bonding. Assuming the validity of our earlier MO model, the ionization is from the 1π MO
and the resulting state of the ion is the A
2
state. The conclusion is that the 1π orbital is
strongly bonding.

116 Case Studies
In principle, further information can be extracted from the vibrational progression. Due
to anharmonicity, the vibrational interval should decrease as the ionization energy increases.
If the peak positions are measured to sufficient precision, it should be possible to determine
both ω
e
and ω
e
x
e
. Using the term value expression given in equation (5.14), a vibrational
term interval can be derived as
G
v+1/2
= G(v + 1) − G(v) = ω
e
− 2ω
e
x
e
(v + 1) (13.1)
where v is the vibrational quantum number in the cation for the lower of the two adjacent
peaks. Consequently, if G
v+1/2
is plotted against (v +1), then ω
e
and ω
e
x
e
can be obtained
from the intercept and slope, respectively. Unfortunately, the resolution is so poor that there
is insufficient precision to obtain any more than a rough value of ω
e
x
e
. Consequently, we
will not pursue this any further.
13.4 Third photoelectron band system
The third band in Figure 13.2 bears qualitative resemblance to the first band. There is
clearly no major change in C
O bonding on ionization to the second excited state of CO
+
,
although the Franck–Condon activity is greater than in the first photoelectron band system.
The vibrational frequency of the B
2
+
state of the ion is found to be 1690 cm
−1
from the
short progression in the third band. This is not as low as the A
2
state, but it is substantially
below that of the neutral molecule. Assuming that (4σ )
−1
ionization is responsible, the
conclusion reached is that the 4σ orbital possesses some bonding character but not as much
as the 1π orbital.
13.5 Adiabatic and vertical ionization energies
In the first member of a vibrational progression, the ion is formed in the zero point vibrational
level, v = 0. The corresponding ionization process is said to be the adiabatic ionization
transition, so-called because the ion has no excess vibrational energy. The most intense
vibrational component is said to be due to a vertical ionization, because it most closely
corresponds to the vertical transition in a classical picture of the Franck–Condon principle.
In the first and third band systems in the photoelectron spectrum of CO, the adiabatic
and vertical ionization energies are one and the same. However, the vertical and adiabatic
ionization energies do not coincide for the second band system because of the substantial
change in C
O bond length on ionization.
According to Koopmans’s theorem, the negative of the ith vertical ionization energy
(IE
i
) can be equated with the energy (ε
i
)ofthe ionizing orbital. This result, which can be
derived from Hartree–Fock theory (see Appendix B), is exceedingly useful since it provides
a means of quantifying the energy scale on an MO diagram.
However, it is important to recognize the limitations of Koopmans’s theorem. First, it
applies only to closed-shell molecules. One of the complications with open-shell molecules
is that more than one ionic state may result from removal of an electron from a specific
orbital. In such circumstances more than one vertical ionization energy is associated with

13 Ultraviolet photoelectron spectrum of CO
117
the orbital, making Koopmans’s theorem meaningless. Even for closed-shell molecules
there are problems with Koopmans’s theorem. It assumes that orbital energies are the same
in the ion and the neutral molecule. However, this is not the case in practice, and nor would
one expect it to be since the loss of an electron will usually reduce the e–e repulsion and
lead to more tightly bound orbitals. In a more realistic model the link between ionization
energy and orbital energy must be modified to
IE
i
=−ε
i
+
i
(13.2)
where
i
is an orbital relaxation energy to account for the change in orbital energy from
neutral molecule to the ion. Since the relaxation energy may differ from one orbital to
another, the HOMO in the neutral molecule may no longer be the HOMO in the ion. In
other words the ordering of orbitals in terms of energy may switch on ionization, especially
if there are two or more orbitals that have quite similar energies. This does not occur for
CO but it is known to occur for N
2
,which is isoelectronic with CO. In fact for N
2
accurate
Hartree–Fock calculations show that the π orbital is the HOMO, but in the cation this
switches and the π orbital lies below the highest occupied σ orbital.
The comments made in this section are intended to provide a sense of perspective. It is
convenient to invoke a simple MO model to explain photoelectron (and electronic) spectra,
as was done above. However, one must also be prepared to recognize its limitations.
13.6 Intensities of photoelectron band systems
If the relative intensities of the band systems depended solely on the populations of the
orbitals from which photoionization occurs, then the second system of CO would be twice
as strong as the first and third systems because of the twofold degeneracy of π orbitals. To
compare intensities, it is necessary to sum over all vibrational components. In general, areas
under each vibrational band should be summed but, if the all the bands have approximately
the same widths,
2
then it is sufficient to sum peak heights.
It is found that the first band system is marginally more intense than the second, and both
are far more intense than the third. Clearly there are factors influencing the intensities other
than just orbital populations. One factor is the transmission of the electron energy analyser,
which may be a strong function of electron kinetic energy. For electrostatic dispersion
analysers, as used to record the spectrum in Figure 13.1, the ability to transmit electrons to
the detector falls markedly as the electron kinetic energy approaches low values.
In addition, there are quantum mechanical effects that influence photoionization proba-
bilities. The transition moment expression (7.13) applies but the upper state wavefunction
is more complicated than in electronic spectroscopy because it involves both the molecular
ion and the free electron. Factors such as the energy and angular momentum of the free
electron can have a major effect on the photoionization probability and it is often found that
this is a strong function of the photon energy. For a detailed discussion of photoelectron
band intensities the interested reader should consult the book by Rabalais [2].
2
By widths we mean full-widths at half-maximum. See Figure 9.1 for more details.
118 Case Studies
0.0
0.5
131415161718
19
1.0
r
e
= 1.165 Å
r
e
= 1.294 Å
0.0
0.5
13141516171819
1.0
r
e
= 1.115 Å
r
e
= 1.244 Å
0.0
0.5
13141516171819
1.0
r
e
= 1.065 Å
r
e
= 1.194 Å
Ionization energy/eV
Franck−Condon factor
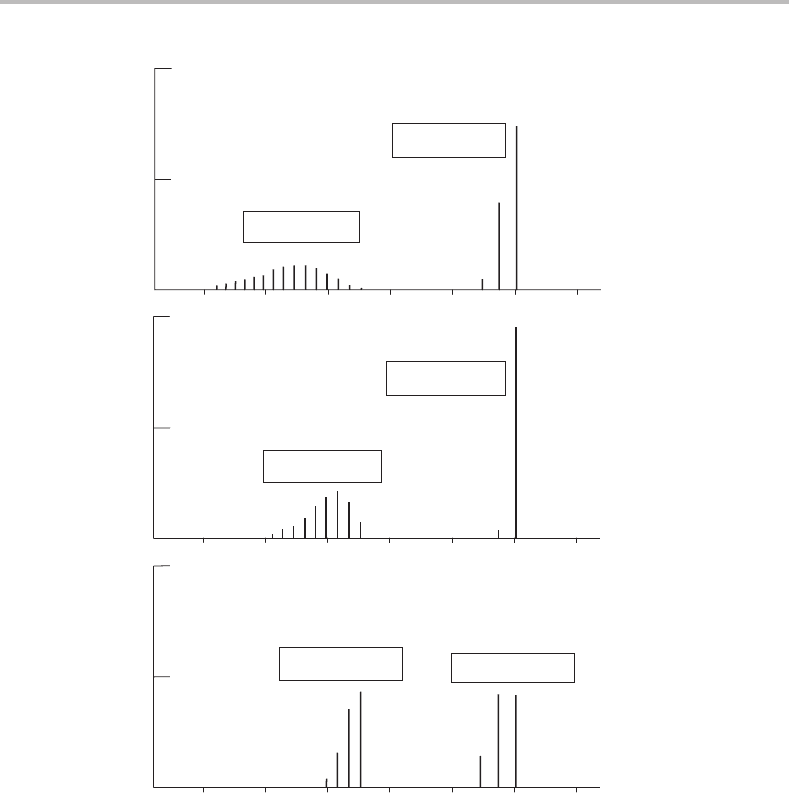
Figure 13.3 Calculated Franck–Condon factors for the first and second photoelectron bands of CO
using different values of the equilibrium bond length in CO
+
. Literature values for r
e
and ω
e
in the
neutral molecule were assumed. Best agreement with experiment (Figure 13.1)isobtained for the
middle spectrum, for which r
e
= 1.115 Å in the
˜
X state of the ion and 1.244 Å for the
˜
A state.
13.7 Determining bond lengths from Franck–Condon factor calculations
Although rotational structure cannot be resolved in ordinary photoelectron spectroscopy, it
is still possible to deduce the bond length of the ion, albeit with modest precision. This can
be achieved by comparing calculated Franck–Condon factors with those determined from
experiments.

13 Ultraviolet photoelectron spectrum of CO
119
Suppose that the equilibrium bond length (r
e
), the harmonic vibrational frequency (ω
e
),
and the anharmonicity constant (x
e
) are known for electronic states of both the neutral
molecule and the ion. This is sufficient information to be able to calculate vibrational
wavefunctions for these states, providing the potential energy in each state can be adequately
represented by Morse potentials.
3
A Morse potential (equation (5.12)) is completely defined
by three parameters, D
e
, r
e
, and a.Itcan be shown that D
e
and a are linked to ω
e
and x
e
by
the expressions
D
e
=
ω
e
4x
e
(13.3)
a = 2π
2cµω
e
x
e
h
(13.4)
The vibrational Schr¨odinger equation can be solved using a Morse potential to determine
the vibrational energies and wavefunctions. Although this can be done analytically, it is also
trivial to do using a numerical procedure on a computer. The advantage of the numerical
approach is that the overlap integral in the Franck–Condon factor (7.14)isalso easy to
evaluate numerically, e.g. using Simpson’s rule.
The quantities r
e
, ω
e
, and x
e
are normally known to high precision for the ground state of
a neutral molecule from techniques such as microwave spectroscopy or rotationally resolved
infrared spectroscopy. For the ion, the photoelectron spectrum will yield a reasonable esti-
mate of ω
e
,asseen for CO
+
. The anharmonicity constant may be more difficult to determine,
but a precise value for this is not particularly important unless transitions to relatively high
vibrational levels in the ion have significant probability (since the anharmonicity determines
the slope of the curve on the approach to dissociation). Consequently, since ω
e
is known and
x
e
can be estimated, the only unknown is r
e
. This can therefore be used as a trial parameter
from which Franck–Condon factors are calculated and compared with the actual relative
intensities of the vibrational components in a given photoelectron band. When the best
possible agreement is found, a good estimate of the bond length of the ion can be obtained.
This approach to estimating ion bond lengths is illustrated in Figure 13.3,where calculated
Franck–Condon factors are shown for selected values of the bond lengths of the ground and
first excited electronic states of CO
+
.
References
1. Molecular Photoelectron Spectroscopy,D.W.Turner,C.Baker, A. D. Baker and C. R.
Brundle, London, Wiley, 1970.
2. Principles of Ultraviolet Photoelectron Spectroscopy,J.W.Rabalais, New York, Wiley,
1977.
3
The potential energy curves of many electronic states are quite good approximations to Morse potentials, except
in the region very close to dissociation. However, it is also worth bearing in mind that there are some states where
a Morse potential is known to be a poor approximation even in the region near the potential minimum.

14
Photoelectron spectra
of CO
2
, OCS, and CS
2
in a
molecular beam
Concepts illustrated: supersonic expansion cooling; adiabatic and vertical ionization
energies; vibrational structure in the spectra of triatomic molecules; Franck–Condon
principle; link between photoelectron spectra and molecular orbital diagrams.
Asevere restriction of conventional photoelectron spectroscopy is its low resolution. The
main limitation is instrumental resolution, particularly that caused by the electron energy
analyser, as was discussed in Chapter 12. Resolving rotational structure is not a realistic
prospect for conventional photoelectron spectroscopy but even vibrational structure may be
difficult to resolve. In addition to the instrumental resolution must be added other factors
such as rotational and Doppler broadening which, if they could be dramatically reduced,
might make a sufficient difference to improve many photoelectron spectra. A potential
solution is to combine conventional photoelectron spectroscopy with supersonic molecu-
lar beams. Supersonic expansions can produce dramatic cooling of rotational degrees of
freedom and, if part of the expansion is skimmed into a second vacuum chamber, can be
converted to a beam with a very narrow range of velocities. This is precisely the approach
adopted by Wang et al.[1], the molecular beam being crossed at right angles by HeI VUV
radiation (58.4 nm) to produce a near Doppler-free photoelectron spectrum. The resolution
achieved is in the region of 12 meV (100 cm
−1
).
The ultraviolet photoelectron spectra of CO
2
, OCS, and CS
2
in molecular beams are
discussed here. These illustrate some of the important concepts involved in the interpretation
of the photoelectron spectra of polyatomic molecules. They are clearly related molecules
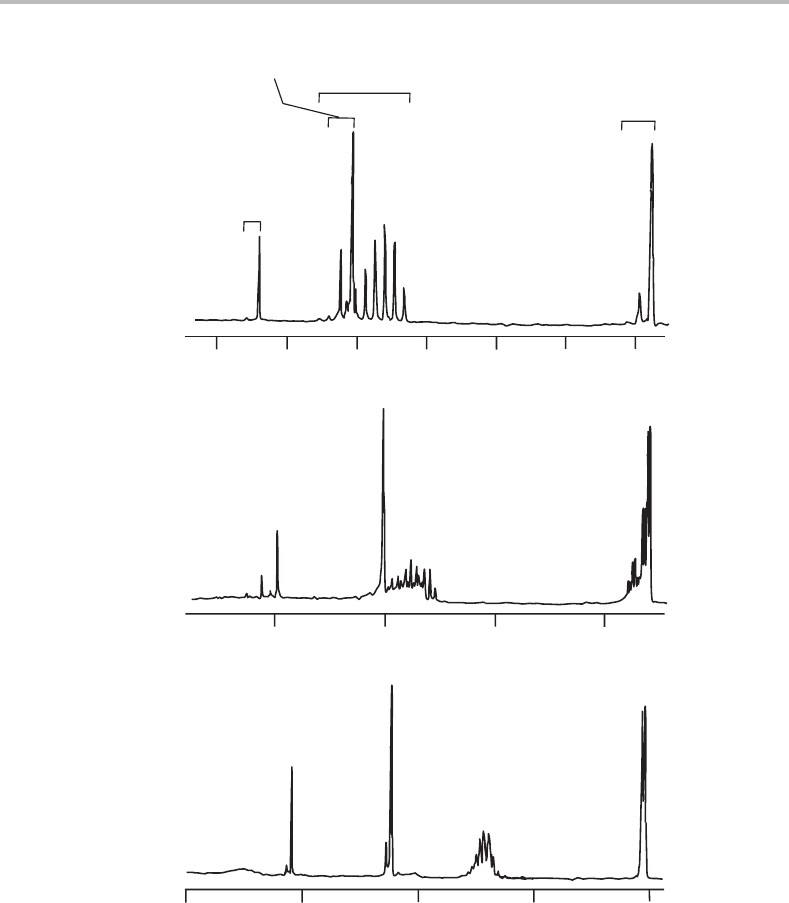
and therefore some similarities in their photoelectron spectra are to be expected. Figure 14.1
shows the overall HeI spectrum for each molecule. It would be inappropriate to discuss every
aspect of the spectrum of each molecule. Instead the focus is on the main bands and we shall
try to discover what each reveals about both the neutral molecule and the corresponding
molecular ion.
120
14 Photoelectron spectra of CO
2
, OCS, and CS
2
121
1618 14 12
14151617181920
12 10141618
CO
2
OCS
CS
2
Ionization energy/eV
(1p
g
)
−1
(1p
u
)
−1
(3σ
u
)
−1
(3σ
g
)
−1
Figure 14.1 Overall view of the HeI photoelectron spectra of CO
2
, OCS, and CS
2
. Justification for the
orbital ionization assignments above the CO
2
spectrum is given in the text. Similar assignments apply
to OCS and CS
2
, although for the former molecule the g and u subscripts on the orbital symmetries
are no longer applicable because OCS lacks a centre of symmetry. (Reproduced from L.-S. Wang,
J. E. Reutt, Y. T. Lee, and D. A. Shirley, J. Elec. Spec. Rel. Phen. 47 (1988) 167, with permission from
Elsevier.)
000
100
110
200
001
101
111
201
002
102
202
14.4 14.2 14.0 13.8
11.011.211.411.611.812.0
10.8 10.6 10.4 10.2 10.0
Ionization energy/eV
×25
×20
×40
000
100
200
002
102
004
OCS
CO
2
CS
2
000
010
020
100
011
200
002
102
202
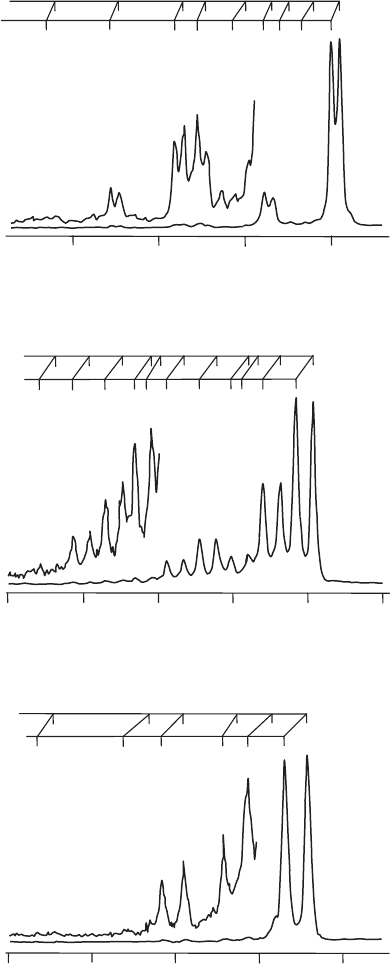
Figure 14.2 Expanded views of the first photoelectron bands of CO
2
, OCS, and CS
2
. The labels
lmn above the peaks refer to the vibrational quantum numbers in the ion, where l is the vibrational
quantum number for mode v
1
, m for v
2
, and n for v
3
. All peaks originate from the zero-point vibrational
levels in the respective neutral molecules, i.e. hot band contributions are negligible in these spectra.
(Reproduced from L.-S. Wang, J. E. Reutt, Y. T. Lee, and D. A. Shirley, J. Elec. Spec. Rel. Phen. 47
(1988) 167, with permission from Elsevier.)

14 Photoelectron spectra of CO
2
, OCS, and CS
2
123
14.1 First photoelectron band system
Figure 14.2 shows expanded views of the first photoelectron band system of each molecule.
Consider, initially, the spectrum of CO
2
. There is little vibrational structure associated with
the first band system, indicating that the electron removed on photoionization possessed
mainly non-bonding character in the neutral molecule. The adiabatic peak, which is also the
vertical peak,
1
shows a clear doublet splitting, as do all of the weak vibrational components
to higher ionization energy, indicating spin–orbit coupling in the ion (0.02 eV ≈160 cm
−1
).
The ground electronic state of the neutral CO
2
molecule, which is discussed in more detail
later, is a spin singlet and in fact has
1
+
g
symmetry. In order for spin–orbit coupling to
occur the molecule must have electronic orbital angular momentum and so it is reasonable
to conclude that a
2
cationic state has been formed upon ionization, i.e. an electron has
been removed from a π orbital (but note we cannot deduce whether it has g or u symmetry
on the basis of this information alone).
The most prominent vibrational feature in the first photoelectron band system is 0.157 eV
(∼1270 cm
−1
) above the adiabatic ionization energy, as measured from the mid-points of
the corresponding spin–orbit doublets. Following the arguments presented in Section 7.2.3,
the dominant vibrational features in the electronic and photoelectron spectra of polyatomic
molecules are usually from excitation of totally symmetric vibrational modes. Linear CO
2
has only one totally symmetric vibrational mode, the symmetric stretch (see Section 5.2.1),
which is normally designated by the shorthand notation ν
1
. Other spectroscopic studies
have shown that this mode has a harmonic frequency of 1388 cm
−1
for the ground state of
the neutral molecule. This is similar to the main observed vibrational interval in the first
photoelectron band, and it is therefore logical to assign that progression to ν
1
. The fact that
the frequency change is modest is consistent with the lack of extensive vibrational structure,
and leads to the conclusion that there is no significant change in bonding, and therefore
molecular structure, on photoionization.
There are other very weak peaks in the first photoelectron band system of CO
2
. The next
member in the progression in ν
1
, labelled 200 in Figure 14.2,
2
is observed. Near to the 200
doublet is a weak doublet assigned as double quantum excitation in ν
3
,atransition which
is Franck–Condon allowed but which we would predict to be very weak, as indeed it is.
The combination feature 102, which also has double quantum excitation of ν
3
, can also be
seen. In addition, notice that there is some evidence of single quantum excitation of ν
2
and
ν
3
, namely the 010 and 011 transitions, which are formally forbidden. If these assignments
are correct, and there is copious evidence from several studies that they are, then they
must gain their intensities through vibronic coupling, which represents a breakdown of the
Born–Oppenheimer approximation (and therefore the Franck–Condon principle). Vibronic
coupling is discussed in more detail later in several Case Studies, e.g. Chapter 25.
1
For definitions of adiabatic and vertical ionization energies, see the previous Case Study.
2
An alternative way of labelling this peak would be as 1
2
0
,which indicates that mode ν
1
has zero quanta in the
lower state and two quanta in the upper state. The absence of any reference to other modes is taken as implying
that there are zero quanta in all other modes in both upper and lower electronic states. The combination feature
102 would be labelled 1
1
0
3
2
0
in this scheme.
×5
12.612.813.013.213.4
15.015.516.016.5
19.0 18.5 18.0 17.5
000
001
002
003
B
2
Σ
+
000
100
200
300
400
500
600
700
800
900
CO
2
OCS
CS
2
B
2
Σ
+
000
020
100
200
120
300
220
400
320
500
420
600
520
700
620
800
900
1000
2
Π
u(1/2)
2
Π
u(3/2)
2
Π
u(3/2)
2
Π
u(1/2)
Ionization energy/eV
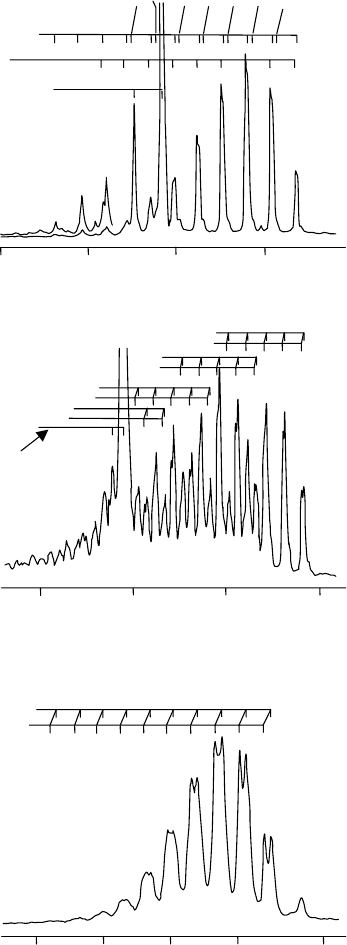
Figure 14.3 Expanded views of the second photoelectron bands of CO
2
, OCS, and CS
2
.AsinFigure
14.2, the labels lmn above the peaks refer to the vibrational quantum numbers in the ion, where
l is the vibrational quantum number for mode v
1
, m for v
2
, and n for v
3
.ForCO
2
and OCS the
third photoelectron band system (forming the
˜
B
2
+
state of the cation) overlaps with the second
photoelectron band system. (Reproduced from L.-S. Wang, J. E. Reutt, Y. T. Lee, and D. A. Shirley,
J. Elec. Spec. Rel. Phen., 47 (1988) 167, with permission from Elsevier.)