Ellis A.M., Feher M., Wright T. Electronic and Photoelectron Spectroscopy: Fundamentals and Case Studies
Подождите немного. Документ загружается.


14 Photoelectron spectra of CO
2
, OCS, and CS
2
125
The first photoelectron band system of CS
2
is simpler than that of CO
2
. There is a
doubling of peaks attributable to spin–orbit coupling in the ion, but the splitting (440 cm
−1
)
is considerably larger than for CO
2
. This is not surprising given the substitution of sulfur
for oxygen: atomic spin–orbit coupling increases rapidly as the atomic number increases,
and therefore if the unpaired electron density on the sulfur atoms in CS
+
2
is quite high then
the molecular spin–orbit splitting will be larger than in CO
+
2
. Put in reverse, the increase in
spin–orbit splitting from CO
2
to CS
2
reveals that the unpaired electron in the ground state
of the ion spends much of its time on the sulfur atoms. The vibrational structure in the first
band of CS
2
can be interpreted in much the same way as for CO
2
, and this is left as an
exercise for the reader.
Turning to OCS, linearity is maintained, and so spin–orbit coupling still occurs in the
excited state, with the splitting, 370 cm
−1
, being somewhat intermediate between CO
2
and
CS
2
.However, an important difference between OCS and the other two molecules is the
effectits lowersymmetry (C
∞v
) has on the vibrational structure. In particular both stretching
modes, ν
1
and ν
3
, are now totally symmetric (see Figure 5.6). Consequently, single quantum
excitation in these modes is possible and substantial Franck–Condon activity might occur
in both. In fact progressions in both stretching modes are seen in Figure 14.2. The main
vibrational features are formed from the strong spin–orbit doublet at 11.273 and 11.319 eV,
and the weaker but still prominent doublet at 11.443 and 11.489 eV. If these are due to single
quantum excitation of different modes, as indicated in the label above the figure, then one
must represent the C
O stretch and the other the C S stretch given the vibrational selection
rules.
3
Assuming the force constants for the two bonds are similar, then the C S stretch
will have the lower frequency on account of its larger reduced mass. Thus fundamental
frequencies of 710 and 2080 cm
−1
are deduced for the C S and C O stretches in the
ground electronic state of OCS
+
. There are several other very weak vibrational peaks of
OCS in Figure 14.2, and these are relatively straightforward to assign.
14.2 Second photoelectron band system
The second photoelectron band systems are shown in Figure 14.3.For all three molecules far
more extensive vibrational structure is seen than in the first photoelectron band systems, and
this time the adiabatic and vertical ionization energies no longer coincide. An immediate
conclusion is that a substantial change in equilibrium structure occurs on ionization to the
first excited electronic states of the cations. All three bands also show evidence of spin–orbit
coupling, although the splitting is not fully resolved for any of the molecules and is only
clear for CS
2
.Nevertheless, this shows that the cation is, as in the first photoelectron band
system, formed in a
2
state. Furthermore, the occurrence of spin–orbit structure is only
possible if the cation, like the neutral molecule, is linear at equilibrium. Any significant
3
The description of the two stretching modes of OCS as being C S and C Oisonly approximate (see Section
5.2.1). Notice also that the labelling of the C
S stretch as ν
1
rather than the C O stretch is illogical: the normal
labelling procedure is to assign the ν
1
label to the mode of highest frequency and highest symmetry. However,
this notation for OCS has persisted in the literature and is employed in Figure 14.2.

126 Case Studies
deviation from linearity would quench the orbital angular momentum due to the loss of π
orbital degeneracy.
The vibrational structure for CO
2
and CS
2
is particularly simple, being dominated by a
fairly long progression in a single mode. The only totally symmetric mode is the symmetric
stretch, ν
1
, and so the progression is assigned to this mode. The separations between adjacent
peaks in CO
2
and CS
2
spectra are c. 1130 and 590 cm
−1
, respectively, considerably smaller
than for the ground state of the ion, which indicates a substantial weakening of the C
O
and C
S bonds.
As in the first photoelectron band, both C
O and C S stretching vibrations are Franck–
Condon allowed in OCS and we might expect, and actually see (Figure 14.3), substantial
progressions in both modes.
14.3 Third and fourth photoelectron band systems
These systems are characterized by a lack of extensive vibrational structure (see Figure 14.1)
and therefore must, like the first band system, be the result of removing an electron from
a molecular orbital with little bonding or antibonding character. There is no evidence of
spin–orbit splitting in the bands, and therefore we can tentatively conclude that they arise
from removal of electrons from σ orbitals, leading to
2
states in the cation. Detailed
discussions of the structure can be found in the original research papers [1, 2].
14.4 Electronic structures: constructing an MO diagram from
photoelectron spectra
The photoelectron data can be used to construct a quantitative molecular orbital diagram
for each molecule. The basis for this is Koopmans’s theorem, which states that the orbital
energy is equal to the negative of the vertical ionization energy for a closed-shell molecule.
The formation of double bonds in the ground state of each neutral molecule means that all
occupied orbitals are full. These molecules are therefore closed-shell and so Koopmans’s
theorem will apply. The ground electronic states are
1
+
g
for CO
2
and CS
2
and
1
+
for
OCS.
The photoelectron spectra show that HeI radiation is capable of photoionizing four MOs
in each molecule. According to Koopmans’s theorem, there are therefore four MOs with
orbital energies > −21.22 eV. The first ionization energy corresponds to removal of an
electron from a largely non-bonding orbital, which we deduced earlier to be of π symmetry
because of the observation of spin–orbit splitting in the corresponding photoelectron band
system. For similar reasons, the next ionization process also involvesremovalof a π electron,
although the extensive vibrational structure, and in particular the substantial decrease in
stretching vibrational frequencies upon ionization, suggests that this orbital is strongly
bonding. The third and fourth bands correspond to removal of electrons from largely non-
bonding σ MOs, as mentioned earlier.
14 Photoelectron spectra of CO
2
, OCS, and CS
2
127
HeI
α
cut-off
−10
−15
−20
2s
2p
2p
Energy/eV
CCO
2
O
(×2)
3σ
g
3σ
u
1p
u
1p
g
Unoccupied orbitals
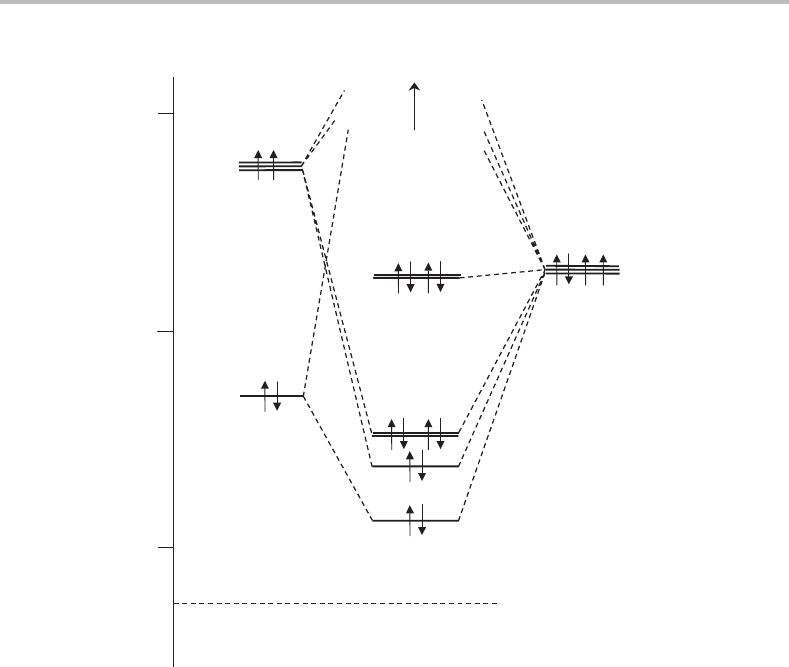
Figure 14.4 Partial MO diagram for CO
2
based on the ultraviolet photoelectron spectrum. The energy
scale is the negative of the vertical ionization energies (Koopmans’s theorem). The ionization energies
for the atoms have been taken from the tables compiled by Moore [3]. Notice that the 2s orbital has
an ionization energy far beyond the HeI limit (21.22 eV) and is therefore not shown.
These findings, taken together, provide important clues in the construction of an MO
diagram. Such a diagram for CO
2
is shown in Figure 14.4, concentrating on those occupied
orbitals that are photoionized by HeI radiation. To include the atomic orbitals on the same
energy scale, use has been made of atomic energy level data for carbon and oxygen [3]. The
HOMO is a largely non-bonding π orbital formed by combining 2pπ orbitals on the two
oxygen atoms with opposite phases. This gives a HOMO of π
g
symmetry, the 1π
g
orbital,
which can be thought of as the lone pairs on each oxygen atom. If the two oxygen atoms
have 2pπ orbitals with the same phases then a bonding interaction with C 2pπ orbitals is
possible giving rise to the 1π
u
MO.
The next two MOs are both σ orbitals. According to the diagram in Figure 14.4, the
highest occupied σ orbital (3σ
u
) looks to be bonding in character. However, the absence
of significant vibrational structure in the photoelectron spectrum indicates mainly non-
bonding character. The same arguments hold for the 3σ
g
MO. The explanation for this
apparent failing in the MO picture is the neglect of the O 2s atomic orbitals. Although far

128 Case Studies
more tightly bound than the C 2s orbital, and therefore not shown in Figure 14.4, the σ
g
and
σ
u
combinations formed from the two O 2s orbitals do make a significant contribution to the
3σ
u
and 3σ
g
MOs. In particular they add antibonding character, approximately cancelling
out the bonding character that would result in the absence of O 2s contributions.
Of course we have only obtained information on part of the MO diagram, and it would
be interesting to probe the more tightly bound orbitals, which could be done using HeII or
X-ray radiation. However, the important orbitals in chemical bonding, the valence orbitals,
will nearly always fall in the HeI region.
Analogous MO diagrams for OCS and CS
2
can be constructed, although for the former
care must be taken to distinguish the different contributions from oxygen and sulfur to
specific MOs. One should also be aware that OCS has no centre of symmetry so the g/u
notation is inapplicable when labelling orbitals and states of this molecule.
References
1. L.-S. Wang, J. E. Reutt, Y. T. Lee, and D. A. Shirley, J. Electron. Spectrosc. Rel. Phenom.
47 (1988) 167.
2. I. Reineck, C. Nohre, R. Maripuu, P. Lodin, S. H. Al-Shamma, H. Veenhuizen, L. Karlsson,
and K. Siegbahn, Chem. Phys. 78 (1983) 311.
3. Atomic Energy Levels,C.E.Moore, National Bureau of Standards, Circ. 467, Washington
DC, US Department of Commerce, 1949.

15
Photoelectron spectrum
of NO
−
2
Concepts illustrated: anion photoelectron spectroscopy; electron affinity; vibrational
structure and the Franck–Condon principle; link to thermodynamic parameters;
molecular orbital information and Walsh diagrams.
The photoelectron spectroscopy of anions is, in many respects, directly analogous to the
photoelectron spectroscopy of neutral molecules. However, an important difference is that
an electron in the valence shell of an anion is much more weakly bound than in a neutral
molecule. In fact there are some molecules, such as N
2
, that are unable to bind an additional
electron at all. The binding energy of an electron in an anion, which is known as the
electron affinity (EA), is the energy difference between the neutral molecule and the anion.
The electron affinity is defined as a positive quantity if the anion possesses a lower energy
than the neutral molecule, i.e. the electron is bound to the molecule and energy must be
added to remove it.
The photoelectron spectrum of an anion, also known as the photodetachment spectrum,
can provide information on both the anion and the neutral molecule. A good example of
this is the photoelectron spectrum of NO
−
2
,which was first recorded by Ervin, Ho, and
Lineberger [1].
15.1 The experiment
The most common method for generating anions in the gas phase is an electrical discharge.
Ervin et al. produced NO
−
2
by a microwave (ac) discharge through a helium/air mixture. A
variety of neutral and charged species would be expected under such conditions, including
several possible anions and cations. However, unlike neutral molecules, specific ions can
be readily separated from a mixture using a mass spectrometer. Ervin et al. used this idea
to obtain the photoelectron spectrum of NO
−
2
.
As will be seen later, NO
−
2
has a relatively large electron affinity. Consequently, while
it is usually possible to employ visible light to remove an electron from an anion, shorter
wavelength light proved necessary for NO
−
2
. The actual wavelength used was 351.1 nm,
which is in the near-ultraviolet, from a frequency doubled continuous dye laser.
As in all types of photoelectron spectroscopywherethe electron kinetic energyis scanned,
the resolution is limited primarily by the electron kinetic energy measurements. In the
129
130 Case Studies
0.5 1.0 1.5
Electron kinetic energy/eV
n
0
2
0
21
n
0
1
0
21
n
0
0
0
21
n =
6
7
543210
6 543210
7 65432108
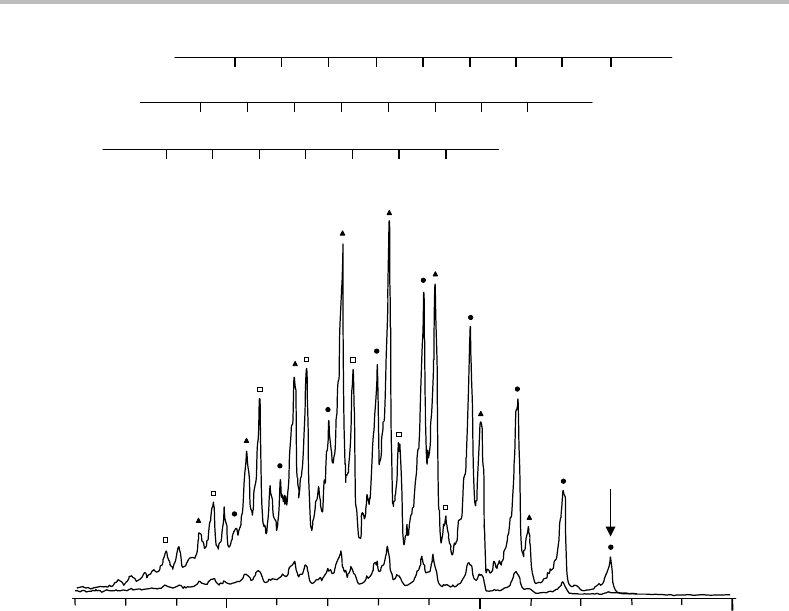
Figure 15.1 The photoelectron spectrum of NO
−
2
obtained with 351.1 nm laser photodetachment.
Two different scans are shown, the upper one with the laser polarized parallel to the path of electrons
entering the analyser, and the lower one oriented perpendicular to this direction. The arrow marks
the adiabatic electron detachment process. For an explanation of the vibrational structure labelling
shown above the spectrum see text. (Reproduced from K. M. Ervin, J. Ho, and W. C. Lineberger,
J. Phys. Chem. 92 (1988) 5405, with permission from the American Chemical Society.)
instrument used by Ervin et al., the electron energy analyser was of the hemispherical type
(see Section 12.1) with a resolution of approximately 9 meV (∼70 cm
−1
). The observed
resolution in the spectrum (FWHM) was 16 meV (130 cm
−1
), a convolution of instrumental
and substantial broadening due to (unresolved) rotational structure. The difference between
the photon energy (3.532 eV) and the electron kinetic energy gives the binding energy of
the electron to the anion.
15.2 Vibrational structure
Photoelectron spectra of NO
−
2
obtained using polarized laser light are shown in Figure 15.1.
The more prominent spectrum was obtained with the laser polarization parallel to the path

15 Photoelectron spectrum of NO
−
2
131
of electrons entering the energy analyser, while the weaker spectrum was obtained with per-
pendicular polarization. Although the absolute intensities are very different in the two cases,
the relative intensities of all observed features are roughly the same. Different responses of
parts of the spectrum to a change in laser polarization are likely if more than one photode-
tachment process contributes to the spectrum. It is therefore reasonable to conclude that a
single photodetachment process is responsible for the structure in Figure 15.1, presumably
leading to the formation of NO
2
in its ground electronic state (see later).
Extensive vibrational structure is evident in Figure 15.1.IfNO
−
2
is present in only its
zero-point vibrational level, then all the structure will be due to excitation of vibrations
in neutral NO
2
.Several regular progressions are easily identified and can be explained in
terms of two active vibrational modes with intervals of ∼1320 and ∼750 cm
−1
, respectively.
A lengthy progression in the lower frequency mode is built upon successive quanta in the
higher frequency mode, giving rise to three prominent vibrational progressions. Symbols
have been added to Figure 15.1 to distinguish these three progressions.
NO
2
and NO
−
2
possess three normal vibrational modes, two stretches and one bend. In
determining selection rules for these modes, by application of the Franck–Condon principle
(see Section 7.2.3), it is necessary to establish whether a particular vibration is totally or
non-totally symmetric with respect to the full set of symmetry operations of the molecular
point group. Microwave spectra of NO
2
show that it is bent at equilibrium in its electronic
ground state with an O
N O bond angle of 134
◦
and an N O bond length of 1.194 Å [2];
NO
2
therefore possesses C
2v
equilibrium symmetry. There will be two totally symmetric
(a
1
) normal modes, the totally symmetric N O stretch, ν
1
, and the O N O bend, ν
2
.
The remaining mode, the antisymmetric N
O stretch, is designated as mode ν
3
and has b
2
symmetry.
Assuming that NO
−
2
does not possess a lower equilibrium symmetry than NO
2
,a
reasonable assumption, then we can concentrate on the two totally symmetric modes of
NO
2
to explain the vibrational structure. The harmonic wavenumbers of ν
1
and ν
2
have
been measured previously with very high precision from IR spectra and are known to be
1325.33 ± 0.06 and 750.14 ± 0.02 cm
−1
, respectively [3]. These values are, within exper-
imental error, identical to those determined from the photoelectron spectrum of NO
−
2
and
confirm the assignment. The vibrational structure in the photoelectron spectrum can there-
fore be interpreted in terms of various combinations of quanta in modes ν
1
and ν
2
. The
standard notation for labelling the individual vibrational peaks is 1
m
n
2
p
q
,where 1 and 2 refer
to modes ν
1
and ν
2
and the superscripts and subscripts reveal the number of quanta in these
modes in the upper and lower electronic states (neutral molecule and anion), respectively.
Three bending progressions have been assigned in Figure 15.1 built upon different
degrees of excitation of ν
1
, the 1
0
0
2
n
0
,1
1
0
2
n
0
, and 1
2
0
2
n
0
progressions. The limited resolution
and signal-to-noise ratio prevents other, less prominent, progressions being identified. The
1
0
0
2
0
0
band, more commonly written as 0
0
0
, corresponds to the adiabatic photodetachment
process, i.e. NO
2
is formed in its zero-point level from NO
−
2
in its zero-point level. This
transition is marked with an arrow in Figure 15.1. The adiabatic electron affinity is obtained
as the difference between the photon energy and the electron kinetic energy. The assign-
ment of the adiabatic transition in any band in which there is extensive vibrational structure
should always be viewed with some suspicion since it is possible that this transition will

132 Case Studies
not be observed if its Franck–Condon factor (FCF) is small. However, the assignment made
in Figure 15.1 is supported by other data, notably a photodetachment threshold experiment
in which an intense tunable laser was used to accurately determine the onset wavelength
for electron photodetachment from NO
−
2
. The spectrum in Figure 15.1 yields an adiabatic
electron affinity of 2.273 ± 0.005 eV [1].
15.3 Vibrational constants
With all the vibrational structure assigned, the next step is to determine the vibrational
constants of NO
−
2
and NO
2
.ForNO
2
, there is ample vibrational information and adequate
resolution in the anion photoelectron spectrum to allow the determination of anharmonicity
constants as well as harmonic vibrational frequencies. The transition wavenumbers can be
fitted to the vibrational term value expression
G(v
1
, v
2
) = ω
1
v
1
+
1
2
+ ω
2
v
2
+
1
2
+ x
11
v
1
+
1
2
2
+ x
22
v
2
+
1
2
2
+x
12
v
1
+
1
2
v
2
+
1
2
where ω
1
and ω
2
are the harmonic frequencies of modes ν
1
and ν
2
and x
11
, x
22
, and x
12
are anharmonicity constants (see also Section 5.2.3). Linear regression yields the constants
presented in Table 15.1. These values can be checked against the results from high resolution
infrared spectroscopy and show good agreement.
Vibrational constants for NO
−
2
are rather more difficult to obtain because, as mentioned
earlier, all the main vibrational components in Figure 15.1 arise from transitions out of the
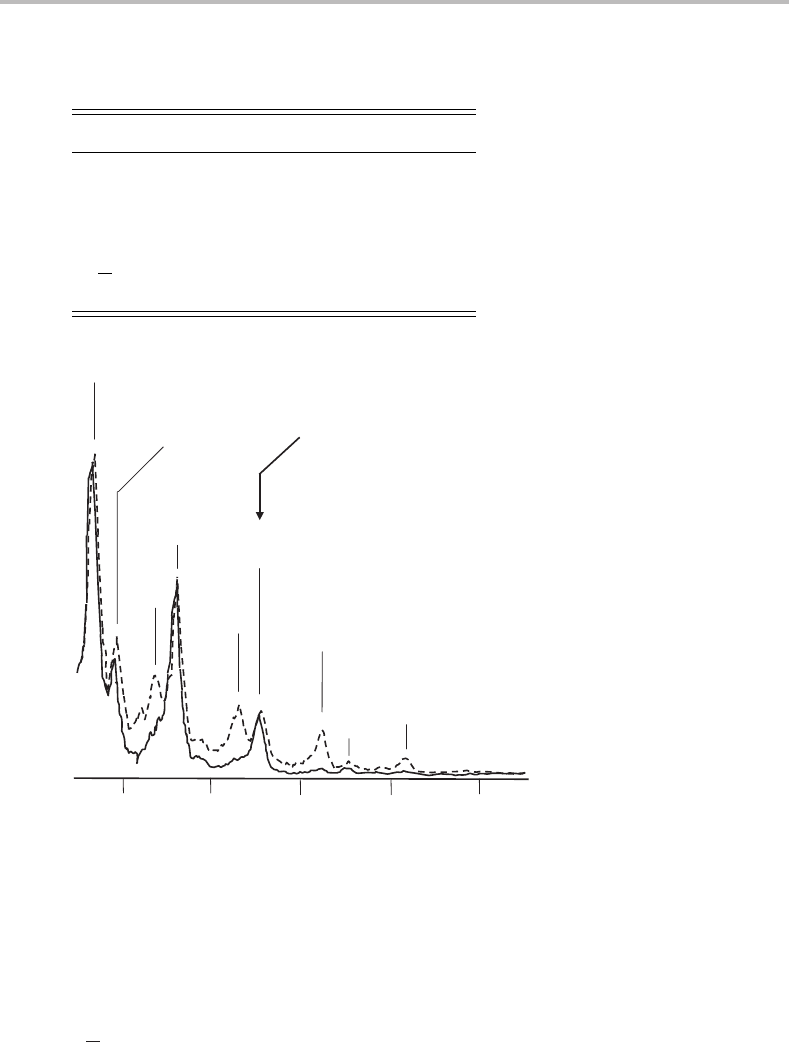
zero-point level of the anion. However, a magnified view (see Figure 15.2)ofthe region
beyond the origin transition, i.e. at lower electron binding energies, shows additional peaks
arising from hot band transitions. They are transitions out of excited vibrational levels
in NO
−
2
(hence the name ‘hot band’, since these grow in significance as the temperature
increases) and they therefore provide vibrational information on NO
−
2
. The number of peaks
is insufficient to determine meaningful anharmonicity constants but approximate harmonic
frequencies for the two totally symmetric modes can be extracted. These are listed in
Table 15.1.
15.4 Structure determination
The observation of substantial Franck–Condon activity in both ν
1
and ν
2
shows that the
equilibrium N
O bond length and the O N O bond angle of NO
−
2
must both differ sig-
nificantly from their values in NO
2
.Itispossible to quantify these changes by calculating
Franck–Condon factors (FCFs) for each possible vibrational component and comparing
with experiment. In order to calculate FCFs, vibrational wavefunctions are required. These
in turn require knowledge of the structures of the anion and the neutral molecule. As men-
tioned earlier, the structure of the neutral molecule is known to high precision and so the
15 Photoelectron spectrum of NO
−
2
133
Table 15.1 Vibrational and structural constants for
NO
2
and NO
−
2
Quantity NO
2
NO
−
2
ω
1
/cm
−1
1316.4 ± 9.2 1284 ± 30
ω
2
/cm
−1
748.0 ± 4.2 776 ± 30
x
11
/cm
−1
3.1 ± 2.6
x
22
/cm
−1
−0.59 ± 0.44
x
12
/cm
−1
−2.1 ± 1.3
r(N
O)/Å 1.194 1.25 ± 0.02
Bond angle/
◦
133.9 117.5 ± 2
1.1
1.2
1.3
1.4
1.5
Electron kinetic energy/eV
0
0
0
1
21
0
1
0
0
21
1
0
0
1
21
0
0
0
0
21
2
0
0
1
21
1
0
0
0
21
3
0
0
1
21
0
0
1
0
21
2
0
0
0
21
Adiabatic
electron detachment
Figure 15.2 Expanded view of photoelectron spectra of NO
−
2
near the adiabatic threshold at two
different temperatures. The dashed line spectrum corresponds to a warmer NO
−
2
sample than that
shown by the solid line. The population of excited vibrational levels in NO
−
2
is enhanced in the
warmer spectrum, giving more prominent hot bands. (Reproduced from K. M. Ervin, J. Ho, and W. C.
Lineberger, J. Phys. Chem. 92 (1988) 5405, with permission from the American Chemical Society.)
N O bond length and the ONO bond angle of the anion can be used as trial parameters to
bring theory and experiment into agreement.
Full details of the FCF calculations are quite involved; the interested reader should consult
Reference [1] for further information. It is important to recognize that FCF simulations on
their own yield only the magnitude of changes in internal coordinates, not their signs.
However, as will be seen later, it is usually possible to draw on other information, perhaps

134 Case Studies
from ab initio quantum chemical calculations or even just qualitative bonding arguments,
which allow the signs to be deduced as well. Ervin et al. found that r(N
O) =1.25 ±0.02 Å
and θ(O
N O) = 117.5 ± 2.0
◦
in NO
−
2
. The precision is nowhere near as good as would
typically be achieved from high resolution (rotationally resolved) spectra, but so far these
have proved elusive.
15.5 Electron affinity and thermodynamic parameters
The photoelectron spectrum allows thermochemical parameters to be determined for NO
−
2
that would be difficult to obtain by other means. Among the most important is the enthalpy
of formation of NO
−
2
,
f
H
◦
(NO
−
2
), which from a simple Hess’s law cycle can be expressed
as
f
H
◦
(NO
−
2
) =
f
H
◦
(NO
2
) − EA(NO
2
)
The enthalpy of formation of NO
2
has been measured previously and is 35.93 ±0.8 kJ mol
−1
[4]. Combining the adiabatic electron affinity from the photoelectron spectrum (2.273 ±
0.005 eV
219.3 ± 0.05 kJ mol
−1
) with
f
H
◦
(NO
2
) leads to
f
H
◦
(NO
−
2
) =−183.4 ±0.9
kJ mol
−1
.
Similarly, the dissociation energy (D
0
)ofNO
−
2
to give O
−
and NO, as well as the gas-
phase acidity,
a
H
◦
,ofnitrous acid (i.e. the enthalpy for the reaction HONO → H
+
+
NO
−
2
), can also be determined using the Hess’s law cycles
D
0
(O
−
−NO) = EA(NO
2
) − EA(O) + D
0
(NO−O)
a
H
◦
(HONO) = D
0
(H−ONO) + IE(H) −EA(NO
−
2
)
where IE(H) represents the ionization energy of the H atom (1312.05 ±0.04 kJ mol
−1
[5]).
The electron affinity of the O atom has been determined from photoelectron spectroscopy
[6]. Values are available from the literature for the other quantities on the right-hand side of
the above equations: D
0
(NO−O) = 300.64 ± 0.8 kJ mol
−1
and D
0
(H−ONO) = 324.6 ±
1.6 kJ mol
−1
. These lead to D
0
(O
−
−NO) = 379.4 ± 0.9 kJ mol
−1
and
a
H
◦
(HONO) =
1417.4 ± 1.7 kJ mol
−1
.
15.6 Electronic structure
Qualitative molecular orbital arguments can be employed to explain the change in structure
between NO
−
2
and NO
2
. The key is to understand how the energies of the occupied molecular
orbitals change as the structure is altered, in particular as the bond angle changes.
The 1s orbitals on both N and O can be ignored since theymake no significant contribution
to the bonding. The valence molecular orbitals, derived from the 2s and 2p orbitals on each
atom, will give rise to a total of twelve MOs. For NO
−
2
and NO
2
there are 18 and 17 electrons,
respectively, to be distributed amongst the valence MOs.