Egerton R.F. Physical Principles of Electron Microscopy. An Introduction to TEM, SEM, and AEM
Подождите немного. Документ загружается.

172 Chapter 6
different from the composition of underlying material. For example, most
specimens accumulate several monolayers of water and hydrocarbons when
exposed to normal air, and some of this material remains on the surface
when a specimen is placed in vacuum for electron-beam analysis.
As a result, Auger analysis is only useful for surfaces prepared in
vacuum, by cleavage (breaking apart by mechanical force) or by vacuum
deposition. Also, ultra-high vacuum (UHV; | 10
-8
Pa) is needed in order to
maintain the cleanliness of the surface during measurement. In a typical
electron-microscope vacuum of 10
-4
Pa, about one monolayer of ambient gas
molecules arrives at the surface per second, and some of these molecules
remain bonded to the solid. Therefore, Auger analysis is usually done using
UHV surface-science equipment that employs a relatively broad (e.g.,1 mm)
electron beam, rather than an electron microscope.
6.9 Electron Energy-Loss Spectroscopy
An alternative approach to the microanalysis of light (low-Z) elements is to
perform spectroscopy on the primary electrons that have passed through a
thin TEM specimen. Because these electrons are responsible for creating (in
an inelastic collision) the inner-shell vacancies that give rise to characteristic
x-rays or Auger electrons, they carry atomic-number information in the form
of the amount of energy that they have transferred to the specimen. Also, the
number of electrons having a given characteristic energy loss is equal to the
sum of the number of x-ray photons and Auger electrons generated in the
specimen. Therefore, the energy-loss signal ought to be large enough to
accurately measure light (as well as heavy) elements.
To perform electron energy-loss spectroscopy (EELS), it is necessary
to detect small differences in kinetic energy. Primary electrons enter a TEM
specimen with a kinetic energy of 100 keV or more, and the majority of
them emerge with an energy that is lower by an amount between few
electron volts and a few hundred electron volts. The only form of
spectrometer that can achieve sufficient fractional resolution (of the order
one part in 10
5
) is a magnetic prism, in which a highly uniform magnetic
field (B | 0.01 Wb) is produced between two parallel faces of an
electromagnet. This field exerts a force F = evB on each electron. The
magnitude of the force is constant (as the speed v of the electron remains
unchanged) and its direction is always perpendicular to the direction of
travel of the electron, so it supplies the centripetal force necessary for motion
in a circle. Equating the magnetic and centripetal forces gives:

Analytical Electron Microscopy 173
evB = F = mv
2
/R (6.10)
in which m is the relativistic mass of the electron. While in the field, an
electron therefore moves along the arc of a circle whose radius R = [m/(eB)]v
depends on its speed and its kinetic energy. Electrons that lose energy in the
specimen (through inelastic scattering) have smaller R and are deflected
through a slightly larger angle than those that are elastically scattered or
remain unscattered. The spectrometer therefore disperses the electron beam,
imilar to the action of a glass prism on a beam of white light.s
But unlike a glass prism, the magnetic prism also focuses the electrons,
bringing those of the same energy together at the exit of the spectrometer to
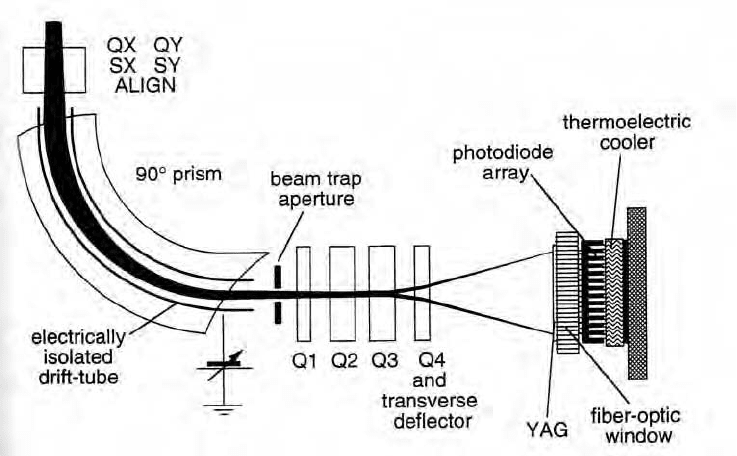
form an electron energy-loss spectrum of the specimen. This spectrum can
be recorded electronically, for example by using a CCD camera or a
photodiode array; see Fig. 6-9. The electrical signal from the diode array is
fed into a computer, which stores and displays the number of electrons
(electron intensity) as a function of their energy loss in the specimen.
Figure 6-9. Parallel-recording electron energy-loss spectrometer that can be mounted below
the viewing screen of a TEM. A uniform magnetic field (perpendicular to the plane of the
diagram) bends the electron trajectories and introduces focusing and dispersion. The
dispersion is magnified by quadrupole lenses Q1 Q4,. which project the spectrum onto a
thin YAG scintillator, producing a photon-intensity distribution that is imaged through a
fiber-optic window onto a photodiode or CCD array cooled to about 20ºC. Courtesy of
Ondrej Krivanek and Gatan Inc.
174 Chapter 6
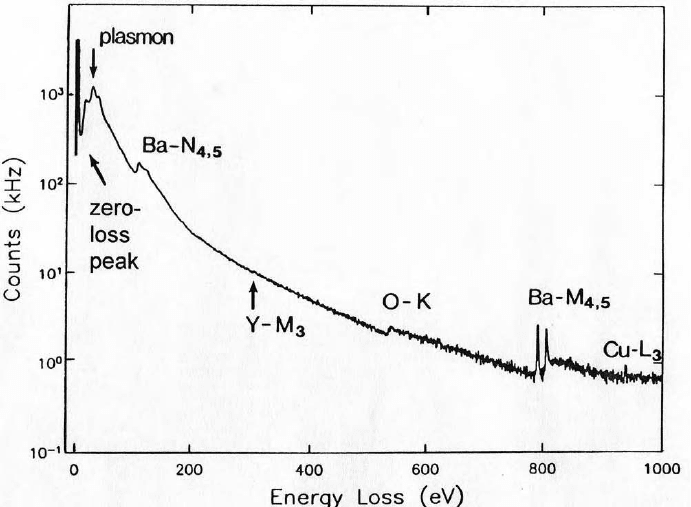
A typical energy-loss spectrum (Fig. 6-10) contains a zero-loss peak,
representing electrons that were scattered elastically or remained unscattered
while passing through the specimen. Below 50 eV, one or more peaks
represent inelastic scattering by outer-shell (valence or conduction) electrons
in the specimen. This scattering can take the form of a collective oscillation
(resonance) of many outer-shell electrons, known as a plasmon excitation.
Inelastic excitation of inner-shell electrons causes an abrupt increase in
electron intensity (an ionization edge) at an energy loss equal to an inner-
shell ionization energy. Because this ionization energy is characteristic of a
particular chemical element and is known for every electron shell, the energy
of each ionization edge indicates which elements are present within the
specimen. Beyond each ionization threshold, the spectral intensity decays
more gradually toward the (extrapolated) pre-edge background that arises
from electron shells of lower ionization energy. The energy-loss intensity
can be integrated over a region of typically 50 100 eV and the background
component subtracted to give a signal I
A
that is proportional to the
concentration of the element A that gives rise to the edge. In fact, the
concentration ratio of two different elements (A , B) is given by:
n
A
/n
B
= (I
A
/I
B
) (V
B
/V
A
) (6.11)
where V
A
and V
B
are ionization cross sections that can be calculated,
knowing the atomic number, type of shell, and the integration range used for
ach element.e
Because the magnetic prism has focusing properties, an electron
spectrometer can be incorporated into the TEM imaging system and used to
form an image from electrons that have undergone a particular energy loss in
the specimen. Choosing this energy loss to correspond to the ionization edge
of a known element, it is possible to form an elemental map that represents
he distribution of that element, with a spatial resolution down to about 1 nm.t
Other information is present in the low-loss region of the spectrum
(below 50 eV). In a single-scattering approximation, the amount of inelastic
scattering is proportional to specimen thickness, as in Eq. (4.16). Therefore,
the intensity of the plasmon peak relative to the zero-loss peak (Fig. 6-10)
can be used to measure the local thickness at a known location in a TEM
pecimen.s
Also, the energy-loss spectrum contains detailed information about the
atomic arrangement and chemical bonding in the specimen, present in the
form of fine structure in the low loss region and the ionization edges. For
example, the intensities of the two sharp peaks at the onset of the Ba M-edge
in Fig. 6-10 can be used to determine the charge state (valency) of the
barium atoms. For further details, see Brydson (2001) and Egerton (1996).

Analytical Electron Microscopy 175
Figure 6-10. Electron energy-loss spectrum of a high-temperature superconductor, showing
N- and M-shell ionization edges of barium, the K-ionization edge of oxygen, and weak
ionization edges from copper and yttrium. The plasmon peak represents inelastic scattering
from valence electrons. A logarithmic vertical scale has been used in order to accommodate
the large range of electron intensity. Courtesy of D.H. Shin (Ph.D. thesis, Cornell University).
Chapter 7
RECENT DEVELOPMENTS
7.1 Scanning Transmission Electron Microscopy
In Section 1.6, we noted that a field-emission STEM was the first instrument
to successfully image single atoms in the late 1960’s. Several years later, a
“dedicated STEM” (operating only in scanning mode) was manufactured by
the Vacuum Generators Company in the UK. A cross-sectional diagram of a
substantially modified version of this instrument (at IBM Watson Research
Laboratories) is shown in Fig. 7-1. Because there is no need for a viewing
screen inside the lens column, its electron gun is located at the bottom of the
instrument (with some advantage in terms of mechanical stability) and the
electron detectors are on top (making it easier to modify the detectors or add
ew ones).n
Most STEM images are recorded in dark-field mode, using an annular
dark-field (ADF) detector located just above the specimen. Its design is
similar to that of a Robinson or solid-state BSE detector used in the SEM
(Fig. 5-10) but it collects electrons that are transmitted through the specimen
and scattered within a certain angular range (T
min
to T
max
), determined by the
inner and outer diameters. By making T
min
large, only large-angle (mainly
elastic) scattering is collected. According to Eq. (4.15), its intensity is
proportional to Z
2
. Therefore the ADF image contains strong atomic-number
contrast and not much diffraction contrast (most of the diffracted electrons
have a scattering angle less than T
min
and pass through the central hole in the
detector). Although the signal is weak, the annular detector design provides
high collection efficiency, as all azimuthal angles of scattering are recorded
(unlike the case of dark-field imaging in a conventional TEM).

178 Chapter 7
Figure 7-1. Modified VG HB-501 STEM fitted with a gun monochromator, 120-kV Nion
spherical-aberration corrector, ADF detector, and aberration-corrected electron spectrometer.
Courtesy of Phil Batson, IBM Watson Research Laboratory, and Ondrej Krivanek, Nion Co.

Recent Developments 179
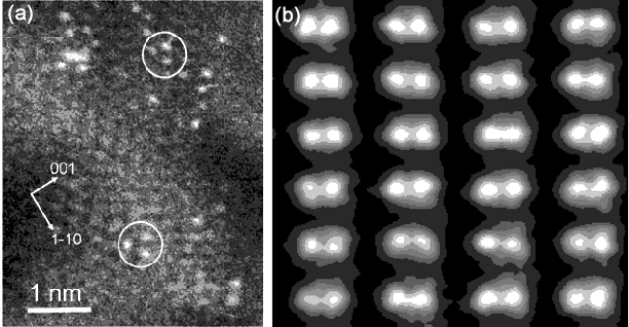
Figure 7-2. (a) ADF-STEM image of a catalyst specimen, showing individual Pt atoms on the
surface of an alumina support; the circles indicate Pt3 trimers. Courtesy of R.D. Adams and
M. Amiridis, University of South Carolina, A. Borisevich and S. Pennycook, Oak Ridge
National Laboratory. (b) Image of a silicon crystal recorded with the electron beam parallel to
(112), showing pairs of atomic columns 0.078 nm apart. Courtesy of Matthew F. Chisholm,
ORNL, reprinted with permission from Science 305 (2004) 1741; copyright 2004 AAAS.
Both of these images were recorded using the aberration-corrected VG603 STEM at ORNL.
Because the dedicated STEM has a field-emission source and a strongly
excited objective lens (low C
s
), it can form a probe of diameter | 0.2 nm,
offering the possibility of single-atom resolution. One area of application has
been the study of the structure of catalysts, which typically consist of very
mall metal particles on an oxide support; see Fig. 7-2a. s
The STEM can also produce atomic-resolution images of crystalline
specimens. If the specimen is oriented with a low-index crystal axis parallel
to the incident beam, columns of atoms can be resolved (Fig. 7-2b), as in the
case of phase-contrast TEM images. However, the ADF detector provides an
amplitude (scattering-contrast) signal that is relatively insensitive to the
objective-lens focus; there are no contrast reversals (Section 4.9) and the
mage is more directly interpretable in terms of atomic coordinates. i
As shown in Fig. 7-1, the STEM is usually fitted with an energy-loss
spectrometer that forms a spectrum from electrons (with scattering angle up
to T
min
) that pass through a central hole in the ADF detector. This
arrangement allows dark-field and energy-filtered bright-field images to be
recorded simultaneously. Also, after recording an atomic-resolution ADF
image, the electron probe can be set to a precisely known location on the
specimen and the electron spectrometer used to provide elemental or fine-
structure analysis with a spatial resolution down to the atomic level
(Browning et al., 1997).
180 Chapter 7
7.2 Aberration Correction
From analysis of the basic properties of electric and magnetic fields, the
German scientist Otto Scherzer showed that a conventional electron lens
(where the magnetic or electrostatic fields have axial symmetry) must suffer
from spherical and chromatic aberration, with aberration coefficients that are
always positive. Therefore, we cannot eliminate lens aberrations by careful
shaping of the lens polepieces, unlike the situation in light optics where
aspherical lenses can be fabricated with zero C
s
. In addition, it is not
possible (in electron optics) to design compound lenses in which axially-
symmetric lens elements have positive and negative aberration coefficients,
o that they compensate for each other. s
Because of the practical incentive to achieve better resolution, physicists
have for many years sought ways to circumvent Scherzer’s rule. One option
is to employ mirror optics. An electrostatic mirror involves an electrode
connected to a potential more negative than that of the electron source.
Before reaching the electrode, electrons are brought to rest and their
trajectory is reversed. As a result of this reversal of path, the mirror has
negative aberration coefficients and can be used as a compensating element.
By assembling an electron-optical system containing electrostatic lenses and
an electrostatic mirror, Rempfer et al. (1997) showed that both spherical and
chromatic aberrations can be corrected, for angles up to 40 mrad. Although
no TEM or SEM has made use of this principle, it is being applied to the
photoelectron microscope, in which electrons released from a specimen
(exposed to ultraviolet or x-ray radiation) are accelerated and focused to
orm an image. f
It has also been known for many years that weak multipole lenses have
the potential to correct for spherical aberration of an axially symmetric lens.
Their construction is similar to that of a stigmator (Fig. 2-16), but in general
there are n electrodes (n = 4 for a quadrupole, n = 6 for a sextupole, n = 8
for an octupole). A mixture of quadrupoles and octupoles (or sextupoles) is
required, and accurate alignment of each element is critical. With careful
design, accurate machining, and computer control of the lens excitations,
such correction has recently become feasible, and transmission electron
microscopes that incorporate this form of aberration correction are being
built. In Fig. 7-1, the field-emission STEM has been fitted with four
quadrupole and three octupole lenses, which correct the spherical aberration
of the probe-forming lenses and generate a scanning probe with a width

Recent Developments 181
below 0.1 nm, as evidenced in Fig. 7-2b. A recent commercial design for an
aberration-corrected dedicated STEM is shown in Fig. 7-3.
Figure 7-3. Nion UltraSTEM. The rectangular base houses a 200-kV cold field-emission gun.
The column (diameter 28 cm) includes two condenser lenses, a C3/C5 aberration corrector
that uses 16 quadrupoles, and 3 combined quadrupole/octupoles to correct both third and fifth
order spherical aberration, an objective lens, and two projector lenses. It incorporates an ADF
detector, retractable bright-field detector, CCD Ronchigram camera, and a Gatan magnetic-
prism spectrometer (located on top of the column). The large rectangular box attached to the
side of the gun houses circuitry generating tip and anode voltages and a high-voltage sensing
(feedback) resistor. Courtesy of Nion Co.
