Davis J.C. Statistics and Data Analysis in Geology (3rd ed.)
Подождите немного. Документ загружается.

Statistics and Data Analysis in Geology
-
Chapter
5
I
%/
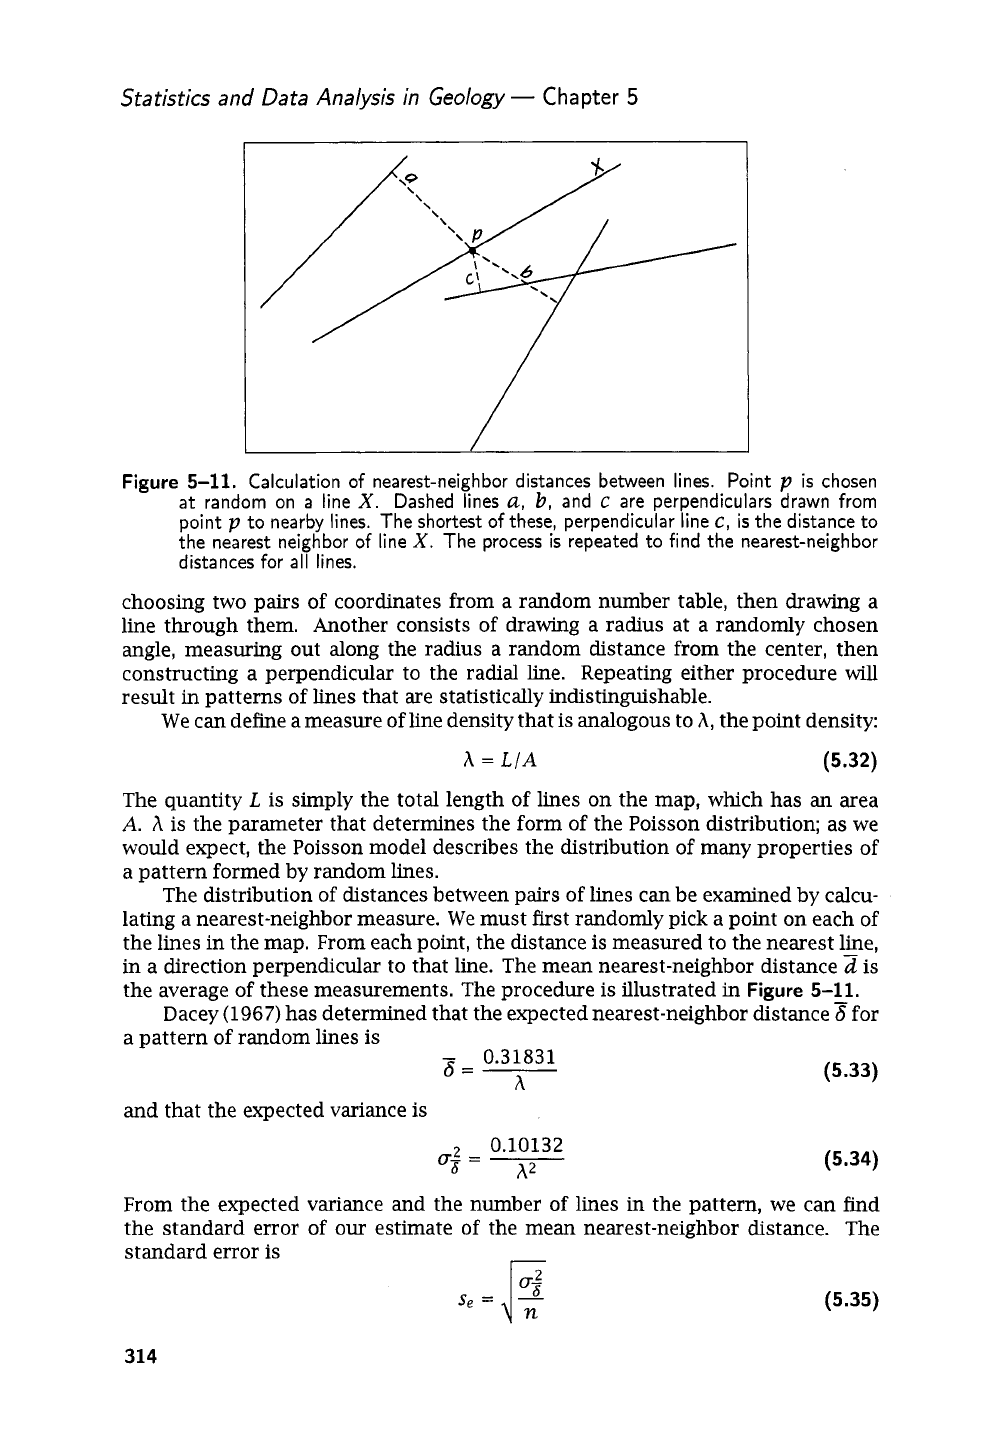
Figure
5-11.
Calculation of nearest-neighbor distances between lines. Point
p
is chosen
at random on a line
X.
Dashed lines
U,
b,
and
c
are perpendiculars drawn from
point
p
to nearby lines. The shortest of these, perpendicular line
c,
is the distance to
the nearest neighbor of line
X.
The process is repeated to find the nearest-neighbor
distances for all lines.
choosing two pairs of coordinates from a random number table, then drawing a
line through them. Another consists of drawing a radius at a randomly chosen
angle, measuring out along the radius a random distance from the center, then
constructing a perpendicular to the radial line. Repeating either procedure
will
result
in
patterns of lines that are statistically indistinguishable.
We can define a measure of line density that is analogous to
A,
the point density:
h
=
L/A
(5.32)
The quantity
L
is simply the total length of lines on the map, which has an area
A.
h
is the parameter that determines the form of the Poisson distribution; as we
would expect, the Poisson model describes the distribution of many properties of
a pattern formed by random lines.
The distribution of distances between pairs of lines can be examined by calcu-
lating a nearest-neighbor measure. We must first randomly pick a point on each of
the lines
in
the map. From each point, the distance is measured to the nearest line,
in a direction perpendicular to that line. The mean nearest-neighbor distance
2
is
the average of these measurements. The procedure
is
illustrated in
Figure
5-11.
Dacey (1967) has determined that the expected nearest-neighbor distance
8
for
a Dattern of random lines
is
-
0.31831
6=
h
and that the expected variance is
0.10132
0-2.
=
6
h2
(5.33)
(5.34)
From the expected variance and the number of lines in the pattern, we can find
the standard error of our estimate of the mean nearest-neighbor distance. The
standard error
is
r
n
314
(5.35)
Spatial Analysis
This allows
us
to calculate a simple z-statistic for testing the significance of the
difference between the expected and observed mean nearest-neighbor distance:
(5.36)
The test is two-tailed;
if
the value of
z
is not significant, we conclude that the
observed pattern of lines cannot be distinguished from a pattern generated by a
random (Poisson) process. We
can
also create a nearest-neighbor index identical to
that used for point patterns by taking the ratio
of
the observed and expected mean
nearest-neighbor distances, or
d/6.
The index is interpreted exactly as is the index
for point patterns.
This
test
will
work for sets of lines that are straight or curved, provided the
lines do not reverse direction frequently.
Also,
the lines should be at least one and
one-half times longer than the average distance between the lines.
If
the number of
lines on the map is small, the estimated density should be adjusted by the factor
(n
-
1)
In,
where
n
is the number of lines
in
the pattern. The estimate of the line
--
density is, therefore
(n-
l)L
nA
A=
(5.37)
A
simple alternative way
of
investigating the nature
of
a set of lines on a map
in-
volves converting the two-dimensional pattern into a one-dimensional sequence.
We can do this by drawing a
sampling
line
at random across the map and not-
ing where the line intersects the lines in the pattern. The distribution of intervals
between the points of intersection along the sampling line
will
provide informa-
tion about the spatial pattern. We can test this one-dimensional sequence using
methods presented in Chapter
4.
If
a single sampling line does not provide enough
intersections for a valid test, we can draw a randomly oriented continuation of
the sampling line from the point where the sampling line intersects the last line
on the map, and a second randomly oriented continuation from the last line on
the map intersected by this continuation, and
so
on
(Fig.
5-12).
The zigzag path
of the sampling line
is
a
random
walk,
and the succession of intersections can be
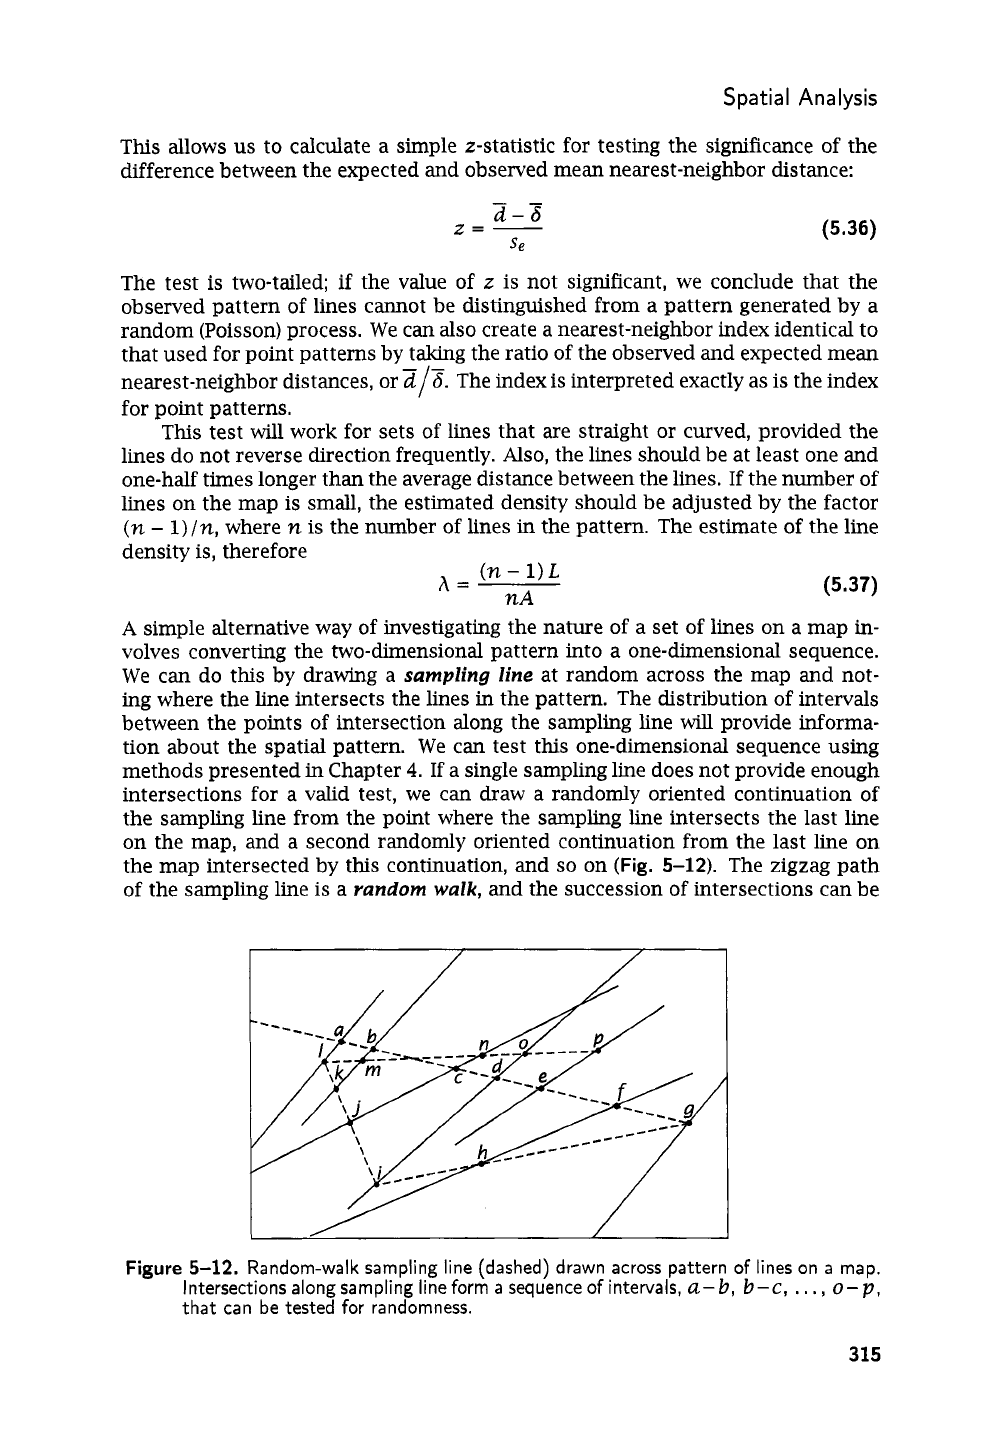
Figure
5-12.
Random-walk sampling line (dashed) drawn across pattern
of
lines on
a
map.
Intersections along sampling line form
a
sequence of intervals,
a-b,
b-c,
,
.
,
,
o-p,
that can be tested for randomness.
315
Statistics and Data Analysis in Geology
-
Chapter
5
treated as though they occurred along a single, straight sampling line.
This
and
other methods for investigating the density of patterns of lines are reviewed by
Getis and Boots (1978).
A
computer program for computing nearest-neighbor
dis-
tances, orientation, and other statistical measures of patterns of lines
is
given by
Clark and Wilson (1994).
Analysis
of
Directional
Data
Directional data are
an
important category of geologic information. Bedding planes,
fault surfaces, and joints are all characterized by their attitudes, expressed as
strikes and dips. Glacial striations, sole marks, fossil shells,
and
water-laid peb-
bles may have preferred orientations. Aerial and satellite photographs may show
oriented linear patterns. These features can be measured and treated quantitatively
like measurements of other geologic properties, but it is necessary to use special
statistics that reflect the circular (or spherical) nature of directional data.
Following the practice of geographers, we can distinguish between
directional
and
oriented
features. Suppose a car is traveling north along a highway; the car’s
motion has direction, while the highway itself has only a north-south orientation.
Strikes of outcrops and the traces of faults are examples of geologic observations
that are oriented, while
drumlins
and certain fossils such as high-spired gastropods
have clear directional characteristics.
We may also distinguish observations that are distributed on a circle, such
as paleocurrent measurements, and those that are distributed spherically, such as
measurements of metamorphic fabric. The former data are conventionally shown
as
rose
diagrams,
a form of circular histogram, while the latter are plotted as
points on a projection of a hemisphere. Although geologists have plotted direc-
tional measurements in these forms for many years, they have not used formal
statistical techniques extensively to test the veracity of the conclusions they have
drawn from their diagrams. This
is
doubly unfortunate; not only are these statis-
tical tests useful, but the development of many of the procedures was originally
inspired by problems in the Earth sciences.
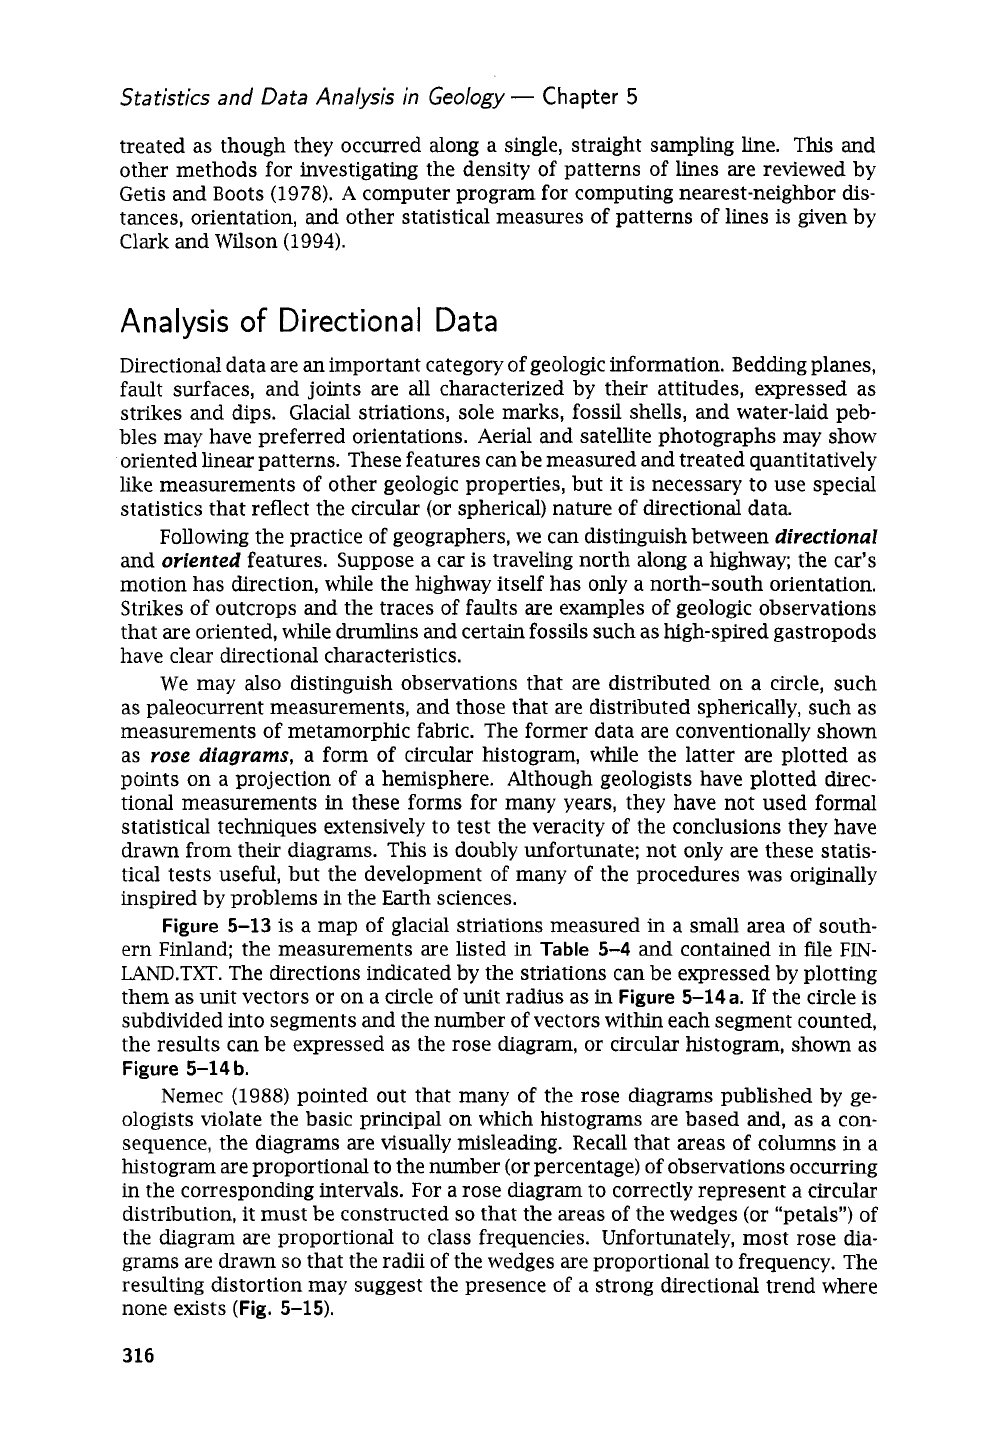
Figure
5-13
is
a map of glacial striations measured in a small area of south-
ern Finland; the measurements are listed in
Table
5-4
and contained in file
FIN-
LAND.TXT.
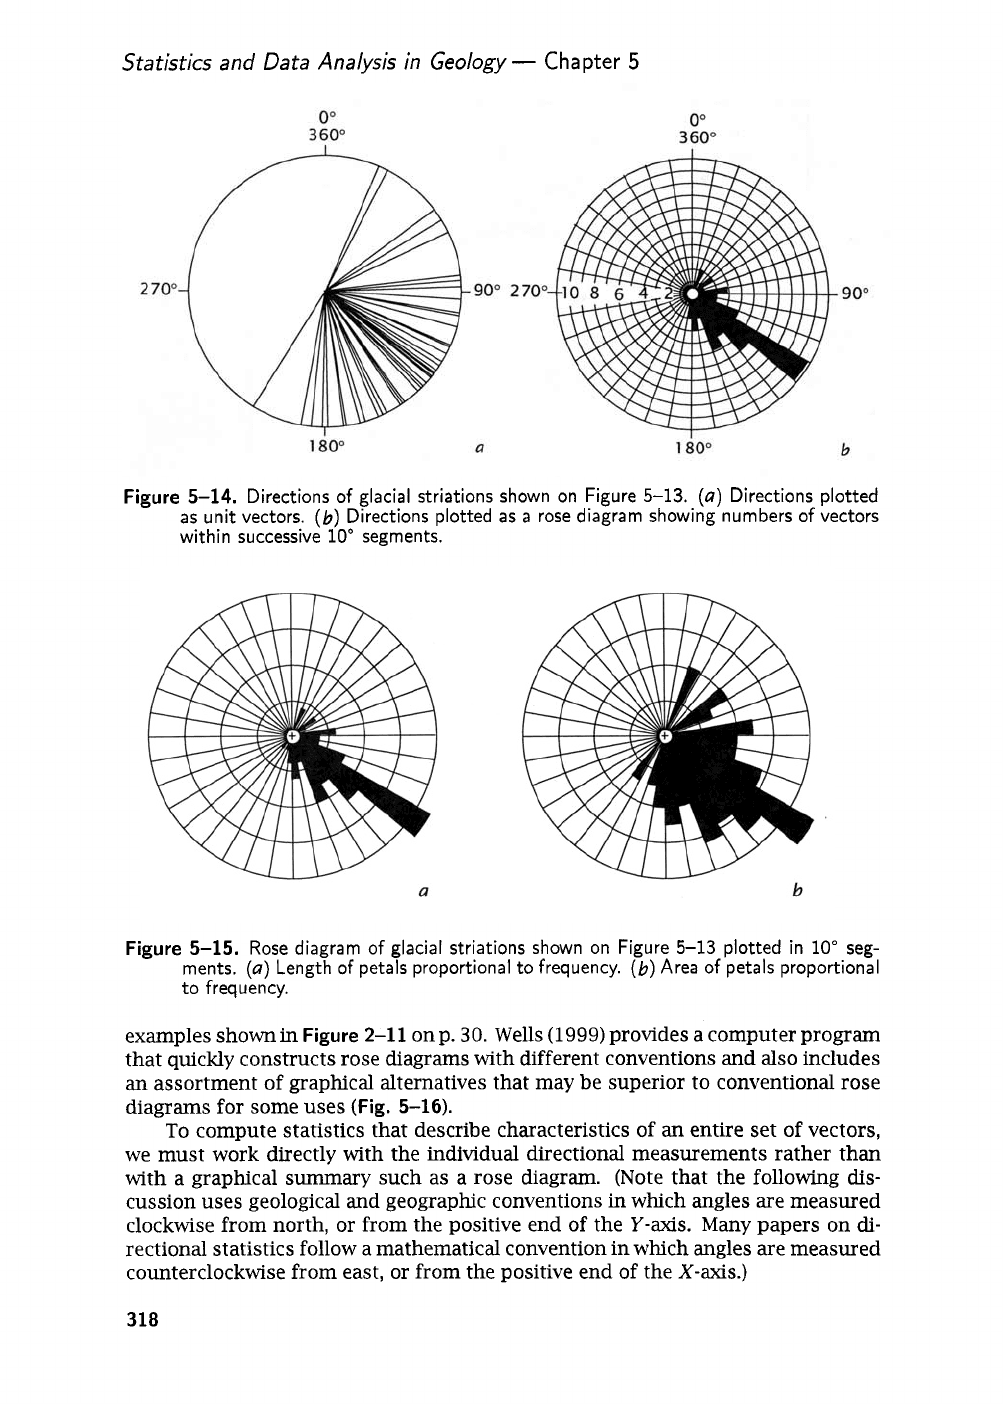
The directions indicated by the striations can be expressed by plotting
them as unit vectors or on a circle of unit radius as in
Figure
5-14
a.
If
the circle
is
subdivided into segments and the number of vectors within each segment counted,
the results
can
be expressed as the rose diagram, or circular histogram, shown as
Figure
5-14
b.
Nemec (1988) pointed out that many of the rose diagrams published
by
ge-
ologists violate the basic principal on which histograms are based and, as a con-
sequence, the diagrams are visually misleading. Recall that areas of columns
in
a
histogram are proportional to the number (or percentage) of observations occurring
in the corresponding intervals. For a rose diagram to correctly represent a circular
distribution, it must be constructed
so
that the areas of the wedges (or “petals”) of
the diagram are proportional to class frequencies. Unfortunately, most rose dia-
grams are drawn
so
that the radii of the wedges are proportional to frequency. The
resulting distortion may suggest the presence of a strong directional trend where
none exists
(Fig.
5-15).
316
Spatial Analysis
Figure
5-13.
Map showing location and direction
of
51 measurements of glacial striations
in
a
35-km2 area of southern Finland.
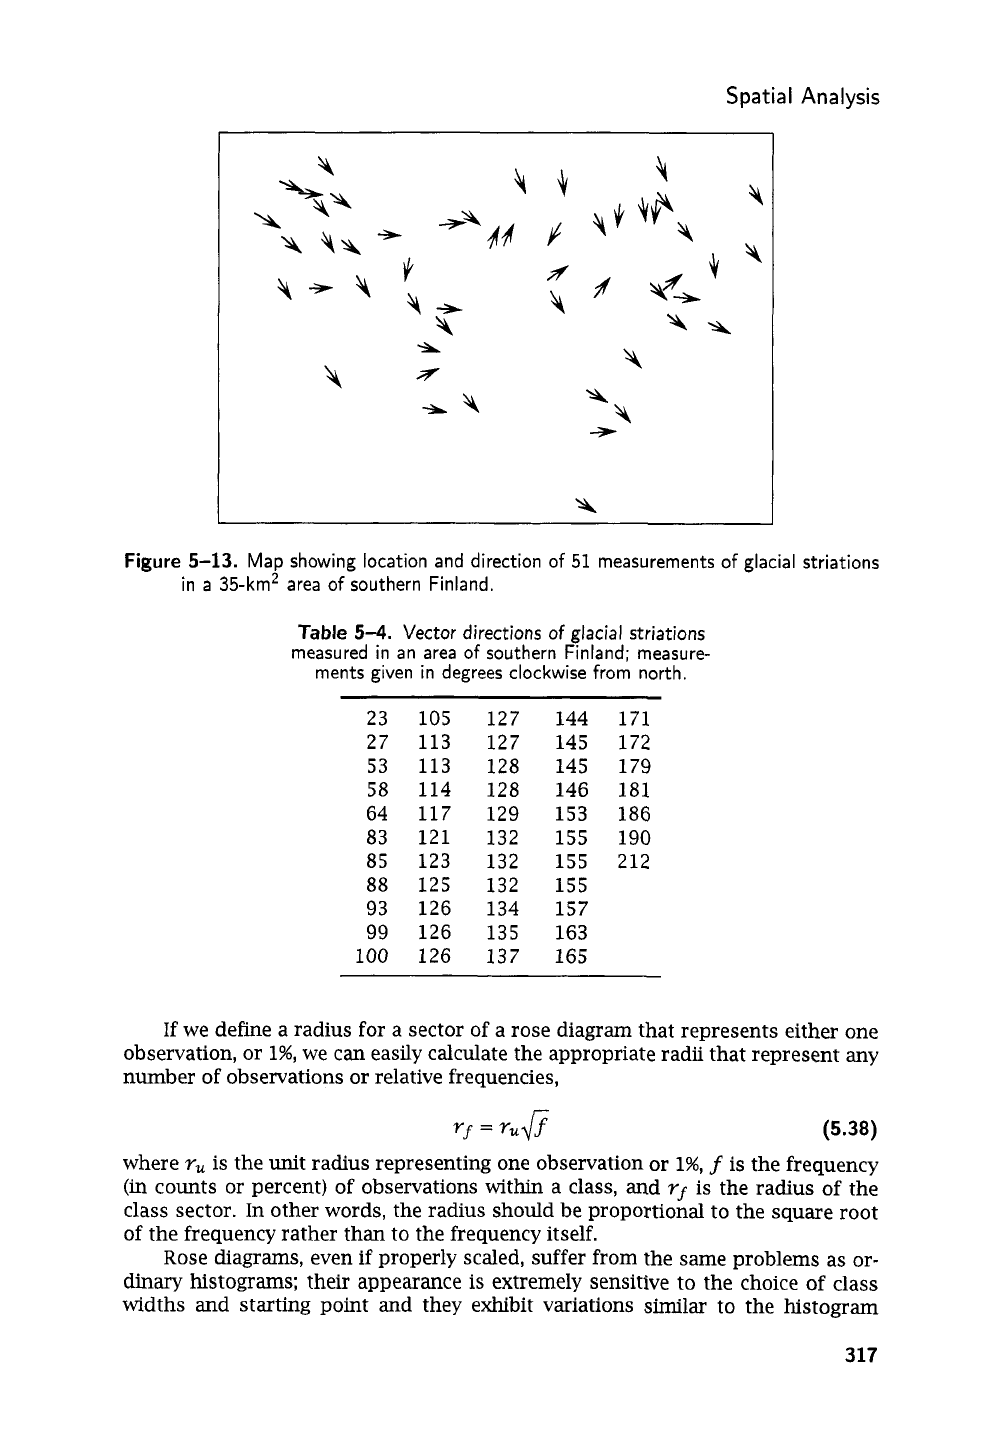
Table
5-4.
Vector directions
of
glacial striations
measured in an area
of
southern Finland; measure-
ments given in degrees clockwise from north.
23
105
127
144 171
27 113 127
145 172
53 113
128 145 179
58 114 128
146 181
64 117 129
153 186
83 121 132
155 190
85 123 132
155 212
88 125 132
155
93 126 134
157
99 126 135
163
100 126 137 165
If
we define a radius for a sector of a rose diagram that represents either one
observation, or
1%,
we can easily calculate the appropriate radii that represent
any
number of observations
or
relative frequencies,
Yf
=
Yufi
(5.38)
where
r,
is the unit radius representing one observation
or
1%,
f
is the frequency
(in
counts or percent) of observations within a class, and
yf
is
the radius of the
class sector. In other words, the radius should be proportional to the square root
of the frequency rather than to the frequency itself.
Rose diagrams, even
if
properly scaled, suffer from the same problems as or-
dinary histograms; their appearance is extremely sensitive to the choice of class
widths and starting point and they exhibit variations similar to the histogram
317
Statistics
and
Data
Analysis
in
Geology
-
Chapter
5
Figure
5-14.
Directions
of
glacial striations shown on Figure
5-13.
(a)
Directions plotted
as unit vectors.
(b)
Directions plotted as a rose diagram showing numbers
of
vectors
within successive
10"
segments.
Figure
5-15.
Rose diagram of glacial striations shown on Figure
5-13
plotted in
10"
seg-
ments.
(a)
Length
of
petals proportional to frequency.
(b)
Area
of
petals proportional
to frequency.
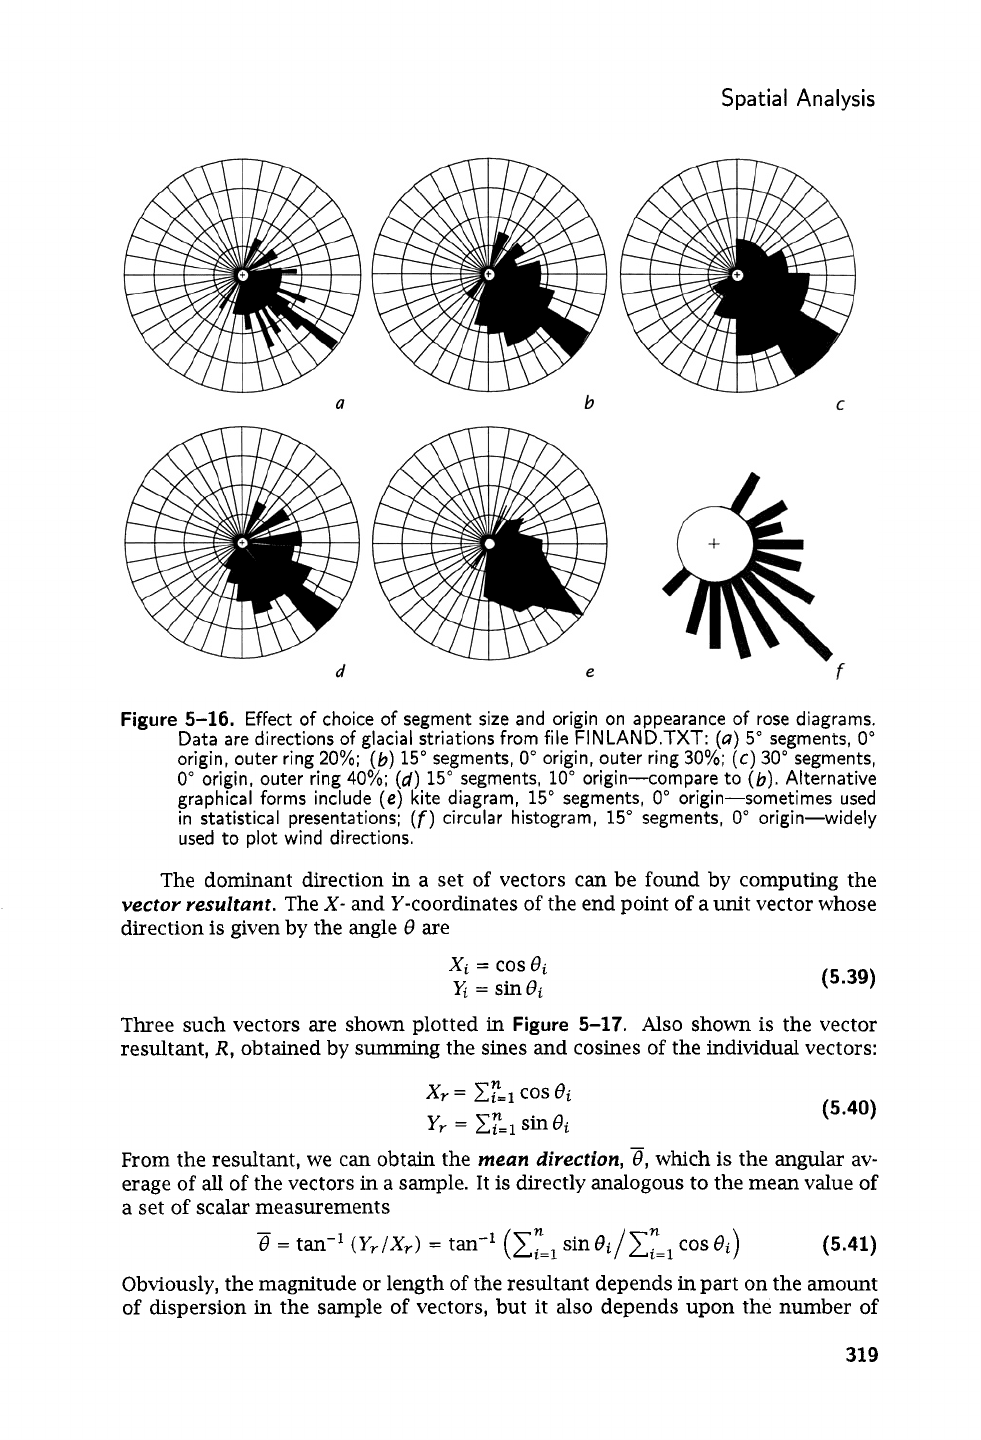
examples shownin
Figure
2-11
onp.
30.
Wells
(1999)
provides a computer program
that quickly constructs rose diagrams with different conventions and also includes
an assortment of graphical alternatives that may be superior to conventional rose
diagrams for some uses
(Fig.
5-16).
To
compute statistics that describe characteristics of
an
entire set of vectors,
we must work directly with the individual directional measurements rather than
with a graphical
summary
such as a rose diagram. (Note that the following
dis-
cussion uses geological and geographic conventions
in
which angles are measured
clockwise from north, or from the positive end of the
Y-axis.
Many papers on
di-
rectional statistics follow a mathematical convention in which angles are measured
counterclockwise from east, or from the positive end of the
X-axis.)
318
S
patia
I
Analysis
Figure 5-16.
Effect of choice
of
segment
size
and origin on appearance of rose diagrams.
Data
are directions of glacial striations from file FINLAND.TXT:
(a)
5"
segments,
0"
origin, outer ring
20%;
(b)
15"
segments,
0"
origin, outer ring
30%;
(c)
30"
segments,
0"
origin, outer ring
40%;
(d)
15"
segments,
10"
origin-compare to
(b).
Alternative
graphical forms include
(e)
kite
diagram,
15"
segments,
0"
origin-sometimes used
in statistical presentations;
(f)
circular histogram,
15"
segments,
0"
origin-widely
used to plot wind directions.
The dominant direction in a set
of
vectors can be found by computing the
vector resultant.
The
X-
and
Y-coordinates
of
the end point
of
a unit vector whose
direction
is
given by the angle
8
are
xi
=
cos
ei
=sin&
(5.39)
Three such vectors are shown plotted
in
Figure 5-17.
Also
shown is the vector
resultant,
R,
obtained by summing the sines and cosines
of
the individual vectors:
(5.40)
From the resultant, we can obtain the
mean direction,
3,
which is the angular av-
erage
of
all
of
the vectors in a sample. It is directly analogous to the mean value
of
a set
of
scalar measurements
(5.41)
Obviously, the magnitude or length
of
the resultant depends
in
part on the amount
of
dispersion in the sample
of
vectors, but it also depends upon the number
of
319

Statistics and Data Analysis in Geology
-
Chapter
5
I
R
U
b
Figure
5-17.
Determination
of
mean direction of
a
set
of
unit vectors.
(a)
Three vectors
taken from Figure
5-16.
(b)
Vector resultant,
R,
obtained by combining the three
unit vectors. Order of combination
is
immaterial.
a
b
Figure
5-18.
Use of length of resultant to express dispersion in
a
collection of unit vectors.
(a)
Three vectors tightly clustered around
a
common direction. Resultant
R
is
rela-
tively long, approaching the value of
n.
(6)
Three widely dispersed vectors; resultant
length
is
less
than
1.0.
vectors.
In
order to compare resultants from samples of different sizes, they must
be converted into a standardized form. This
is
done simply by dividing the coordi-
nates of the resultant by the number of observations,
n
(5.42)
Note that these coordinates also define the centroid of the end points of the indi-
vidual unit vectors.
'The resultant provides information not only about the average direction of a
set of vectors, but
also
on the spread of the vectors about this average.
Figure
5-18
a
shows three vectors that deviate only slightly from the mean direction. The
resultant
is
almost equal in length to the sum of the lengths of the three vectors.
In contrast, three vectors in
Figure
5-18
b
are widely dispersed; their resultant is
very short. The length of the resultant,
R,
is given by the Pythagorean theorem:
(5.43)
The length of the resultant can be standardized by dividing by the number of obser-
vations. The standardized resultant length can also be found from the standardized
end points
-
R
Jn
(5.44)
R=-=
C
+S
n
320
Next Page
In
previous
chapters
we have considered the analysis of data consisting of only
a single variable measured on each specimen or observational unit. In Chapters
4
and
5
we also considered the influence of the temporal or geographic coordinates of
the sample points. We
will
now examine techniques for the analysis of multivariate
data,
in
which each observational unit is characterized by several variables. Multi-
variate methods allow us to consider changes in several properties simultaneously.
Examples of data appropriate for multivariate analysis abound in geology. They
include chemical analyses, where the variables may be percentage compositions
or parts per million of trace elements; measures on streams, such as discharge,
suspended sediment load, depth, dissolved solids, pH, and oxygen content; and
paleontologic variables, perhaps a large number of measurements made on speci-
mens of an organism. Dozens of other examples quickly spring to mind. Some are
simple extensions of problems we have considered previously; others are entirely
new classes of problems.
Multivariate methods are extremely powerful, for they allow the researcher to
manipulate more variables than can otherwise be assimilated. They are compli-
cated, however, both
in
their theoretical structure and in their operational method-
ology. For some of the procedures, statistical theory and tests have been worked
out
only
for the most restrictive set of assumptions. The nature and behavior
of the tests under more relaxed, general assumptions (such as those necessary for
most real-world problems) are inadequately
known.
In fact, some of the procedures
we
will
consider have no theoretical statistical basis at all, and tests of significance
have yet to be devised. Nevertheless, these methods seem to hold the most promise
for fruitful returns in geological investigations.
Most
of the problems in geology
involve complex and interacting forces which are impossible to isolate and study
individually. Often a meaningful decision
as
to the relative worth
of
one
of
a
num-
ber of possible variables cannot be made. The best course of action frequently is
Statistics and Data Analysis in Geology
-
Chapter
6
to examine as many facets of a problem as possible, and sort out,
a
posteriori,
the
major factors. The methods discussed in this chapter
can
be a significant help.
Multiple Regression
The first topic we
will
consider in our final chapter is actually a familiar subject
under a new and more general guise. This is multiple regression, which includes
polynomial curve fitting (discussed in Chapter
4)
and trend-surface analysis
(dis-
cussed
in
Chapter
5).
However, we
will
now remove the restrictions that limited
us to considerations of change as a function
of
temporal or spatial coordinates.
Any observed variable
can
be considered to be a function of
any
other variable
measured on the same samples.
In
Chapter
4
we considered changes in moisture
content that occurred with changes in depth in the sediment.
We could equally
well have measured the montmorillonite content of the sediment in the core
and
examined the changes in water content that may accompany changes in montmo-
rillonite percentage. In fact we could have measured several variables, perhaps
organic content, mean grain size, and bulk density, and we could have examined
the differences in water content associated with changes
in
each or all of these
variables. In a sense, variables may be considered as dimensions, and their values
as coordinates,
so
we can envision changes occurring “along” a dimension defined
by
a variable such as mineral content. Casting variables as dimensions is nothing
new; we perform this every time we plot two variables against one another, because
we are substituting spatial scales
in
the plot for the original scales on which the
variables were measured. Such interchangeability is explicit
in
the references to
“p-
dimensional space” which abound in the literature of multivariate analysis. Just as
trend surfaces are a generalization of curve-fitting procedures to two-dimensional
space, multiple regression is a further generalization to “many-dimensional” space.
We will not consider multiple regression in great detail because the theoretical
and computational essentials have been presented in earlier chapters. You
will
re-
call
from Chapter
4
that polynomial regressions (having one independent variable)
can
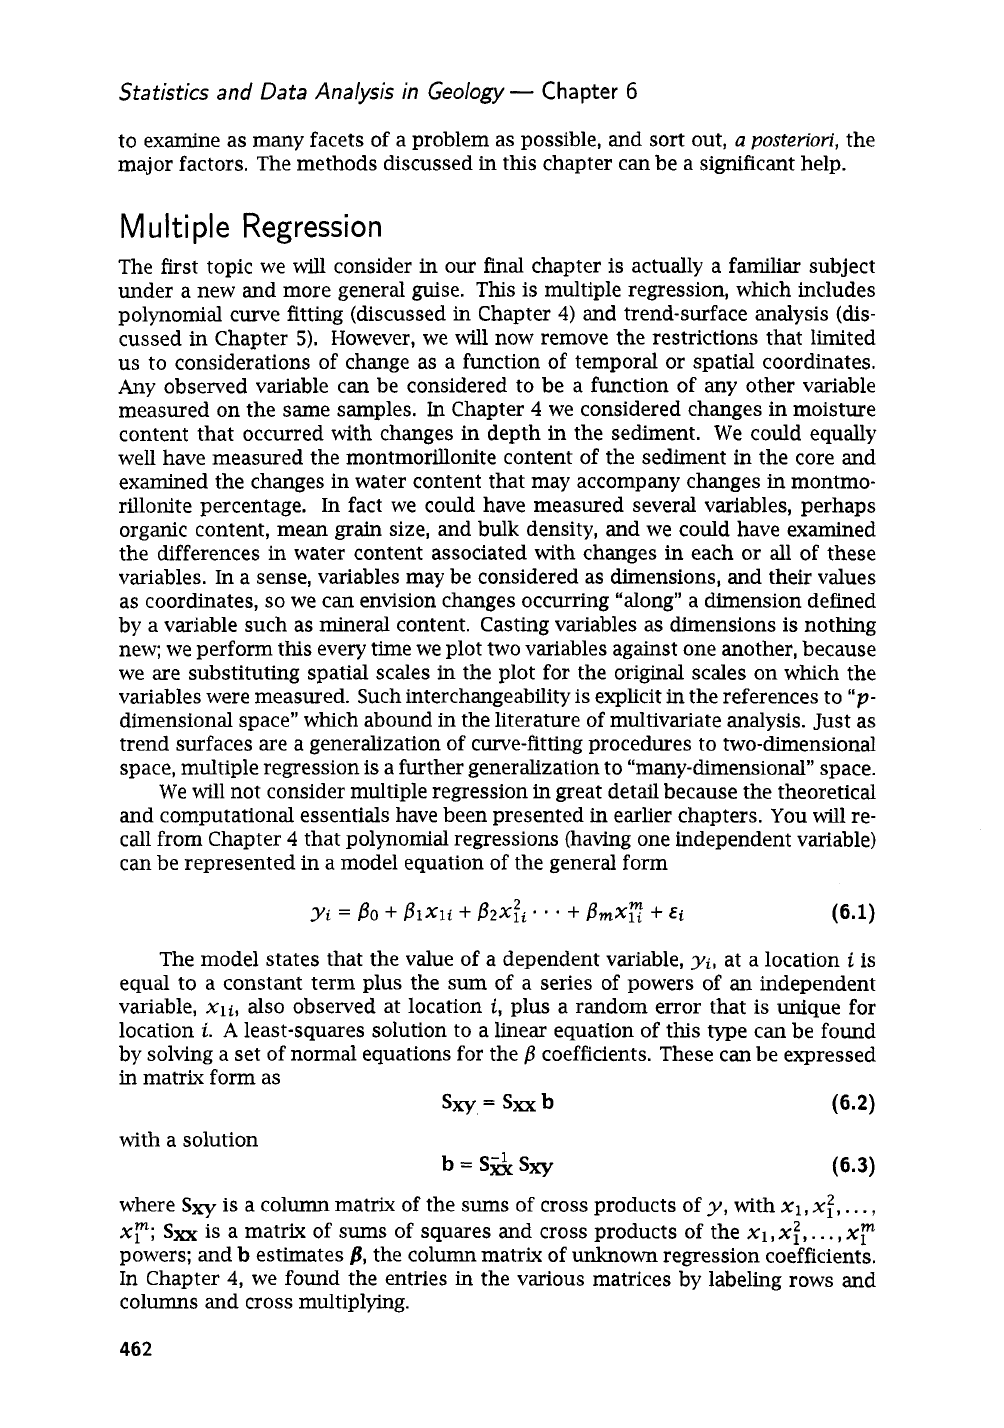
be represented in a model equation of the general form
The model states that the value of a dependent variable,
yi,
at a location
i
is
equal to a constant term plus the
sum
of a series of powers of
an
independent
variable,
xli,
also observed at location
i,
plus a random error that
is
unique for
location
i.
A
least-squares solution to a linear equation of this type can be found
by solving a set of normal equations for the
P
coefficients. These can be expressed
in matrix form as
Sxy=S=b
(6.2)
with a solution
b=S&Sxy
where
SX~
is
a column matrix of the
sums
of cross products of
y,
with
xl,
xf,
.
. .
,
xy;
SXX
is
a matrix of
sums
of squares and cross products of the
XI,
x:,
. .
. ,
x?
powers; and
b
estimates
8,
the column matrix of
unknown
regression coefficients.
In Chapter
4,
we found the entries
in
the various matrices by labeling rows
and
columns and cross multiplying.
462
Analysis
of
Multivariate
Data
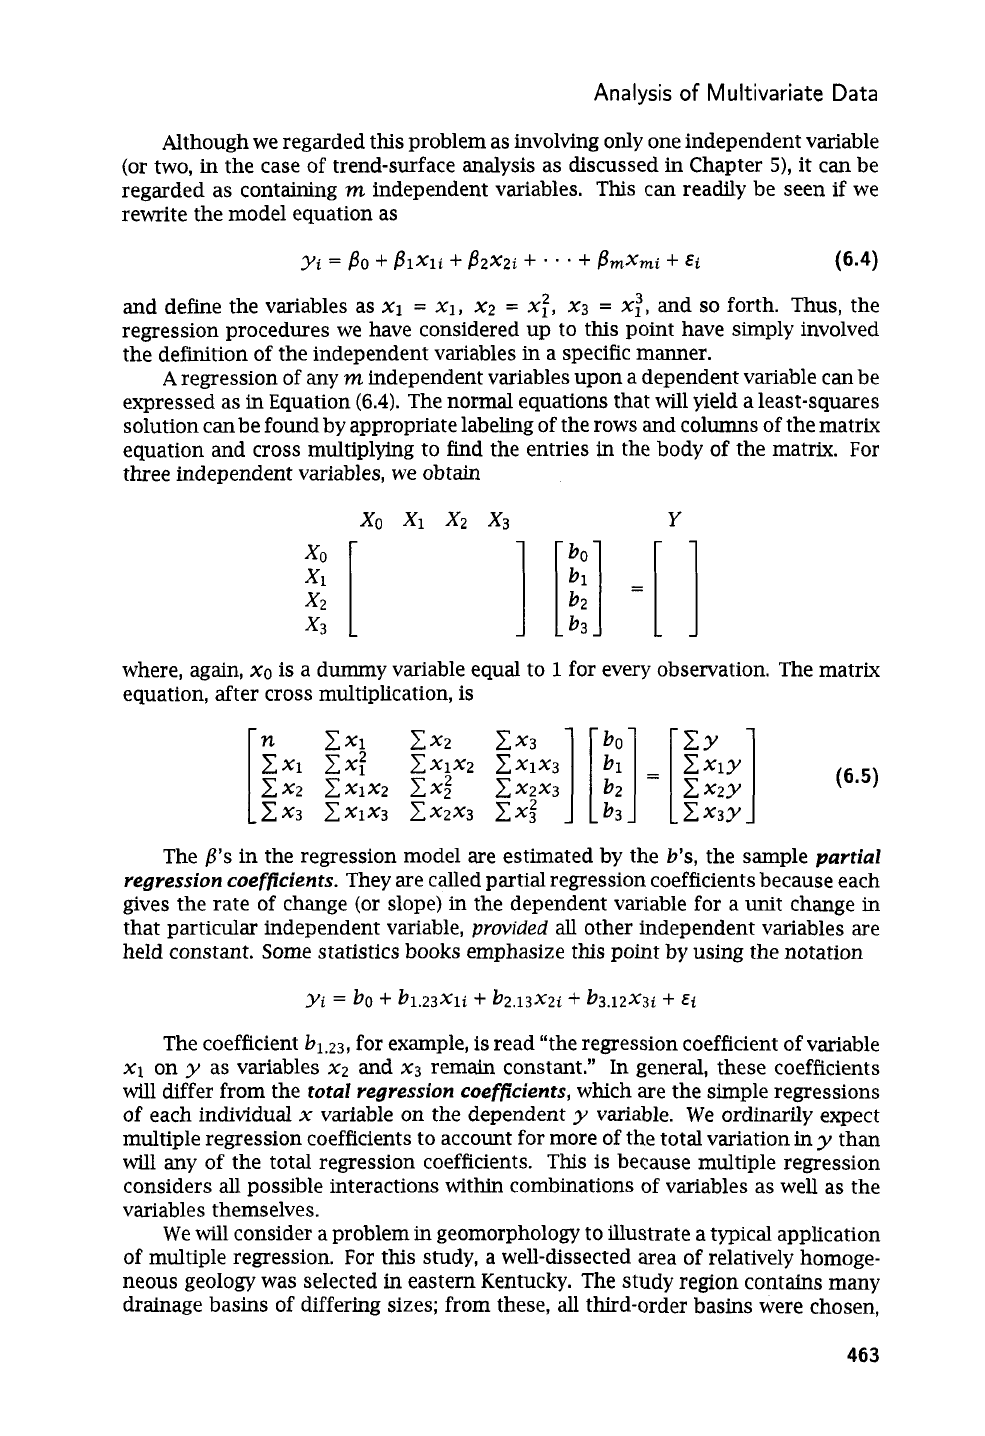
Although we regarded this problem as involving only one independent variable
(or two, in the case of trend-surface analysis as discussed in Chapter
5),
it
can
be
regarded as containing
m
independent variables. This can readily be seen
if
we
rewrite the model equation as
yi
=
/30
+
BlXli
+
/3ZXZi
+
-
*
‘
+
/3mxmi
+
Ei
(6.4)
and define the variables
as
x1
=
XI,
xg
=
x:,
x3
=
x:,
and
so
forth. Thus, the
regression procedures we have considered up to this point have simply involved
the definition of the independent variables in a specific manner.
A
regression of any
m
independent variables upon a dependent variable
can
be
expressed as in Equation
(6.4).
The normal equations that will yield a least-squares
solution can be found by appropriate labeling of the rows and columns of the matrix
equation and cross multiplying to
find
the entries
in
the body of the matrix. For
three independent variables, we obtain
where, again,
xo
is a dummy variable equal to
1
for every observation. The matrix
equation, after cross multiplication, is
The
6’s
in the regression model are estimated by the
b’s,
the sample
partial
regression coefficients.
They
are
called partial regression coefficients because each
gives the rate of change (or slope) in the dependent variable for a unit change in
that particular independent variable,
provided
all
other independent variables are
held constant. Some statistics books emphasize this point by using the notation
The coefficient
b1.23,
for example, is read “the regression coefficient of variable
x1
on
y
as variables
xg
and
x3
remain constant.”
In general, these coefficients
will differ from the
total regression coefficients,
which
are
the simple regressions
of each individual
x
variable on the dependent
y
variable. We ordinarily expect
multiple regression coefficients to account for more of the total variation
in
y
than
will any of the total regression coefficients. This is because multiple regression
considers
all
possible interactions
within
combinations of variables
as
well as the
variables themselves.
We will consider a problem in geomorphology to illustrate a typical application
of
multiple regression. For this study,
a
well-dissected area of relatively homoge-
neous geology was selected
in
eastern Kentucky. The study region contains many
drainage basins of differing sizes; from these,
all
third-order basins were chosen,
463