Davis J.C. Statistics and Data Analysis in Geology (3rd ed.)
Подождите немного. Документ загружается.

Statistics and Data Analysis in Geology
-
Chapter
6
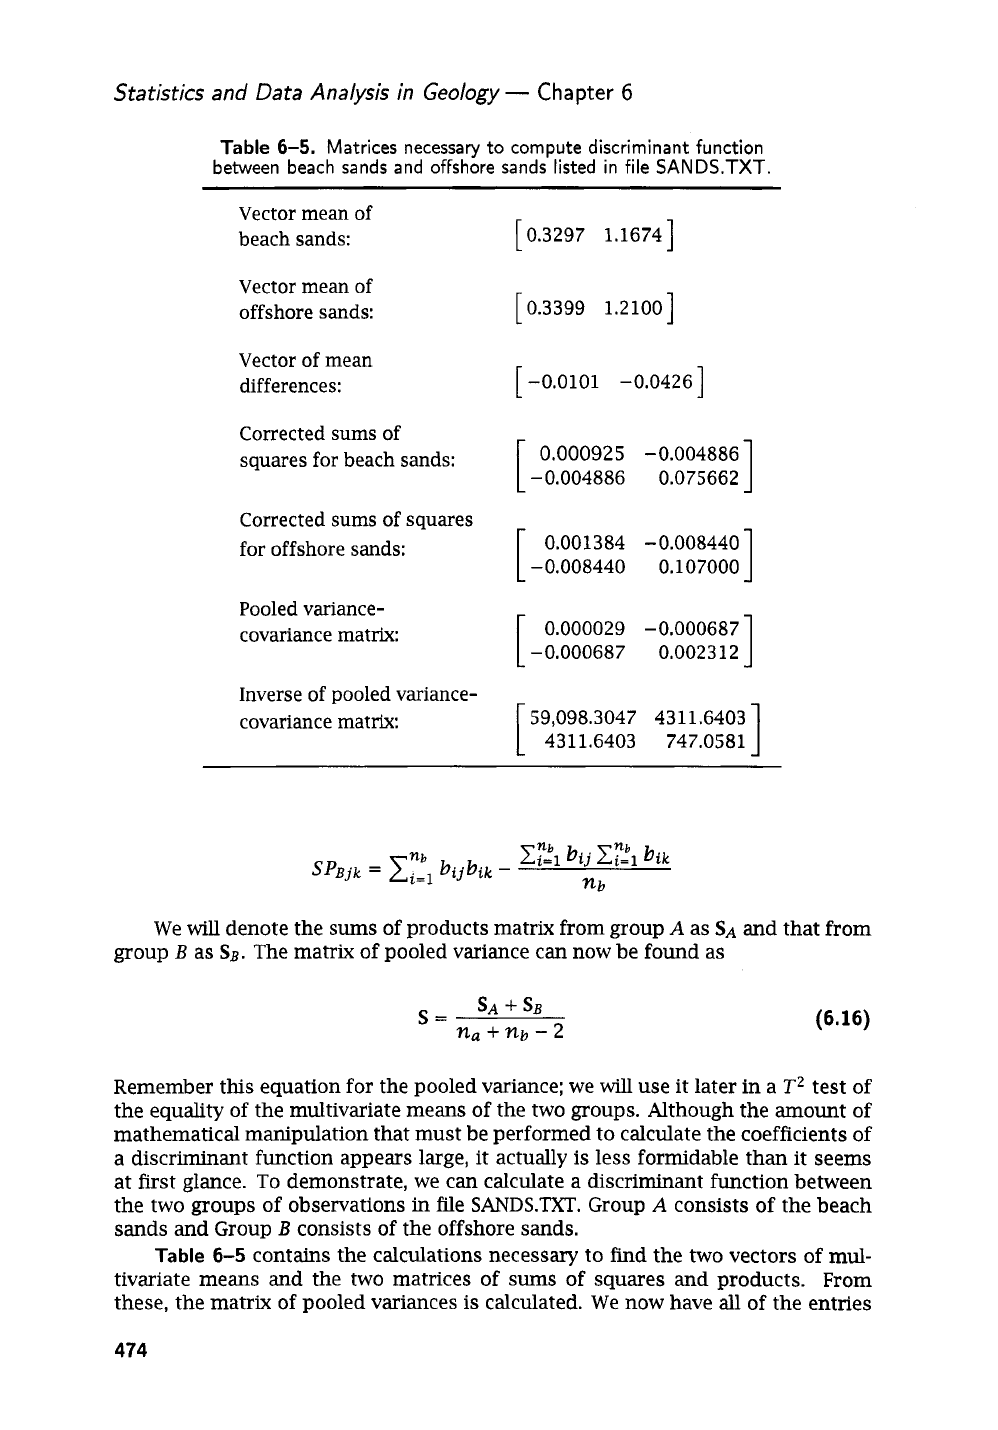
Table
6-5.
Matrices necessary
to
compute discriminant function
between beach sands and ofFshore sands listed
in
file
SANDS-TXT.
Vector mean of
beach sands:
Vector mean of
offshore sands:
Vector of mean
differences:
Corrected sums of
squares for beach sands:
Corrected sums of squares
for offshore sands:
Pooled variance-
covariance matrix:
Inverse of pooled variance-
covariance matrix:
[
0.3297 1.16741
[
0.3399 1.21001
[
-0.0101 -0.04261
0.000925
-0.004886
-0.004886 0.075662
0.001384 -0.008440
-0.008440 0.107000
1
0.000029 -0.000687
-0.000687 0.002312
1
59,098.3047 4311.6403
4311.6403 747.0581
We
will
denote the
sums
of products matrix from group
A
as
SA
and that from
group
B
as
SB.
The matrix of pooled variance can now be found as
SA
f
SB
S=
n,
+
nb
-
2
(6.16)
Remember this equation for the pooled variance: we
will
use it later in a
T2
test of
the equality of the multivariate means of the two groups. Although the amount of
mathematical manipulation that must be performed to calculate the coefficients of
a discriminant function appears large, it actually is less formidable than it seems
at first glance.
To
demonstrate, we can calculate a discriminant function between
the two groups of observations
in
file
SANDS.TXT.
Group
A
consists of the beach
sands
and Group
B
consists of the offshore sands.
Table
6-5
contains the calculations necessary to find the two vectors of
mul-
tivariate means and the two matrices of
sums
of
squares and products. From
these, the matrix of pooled variances is calculated. We now have all of the entries
474
Analysis
of
Multivariate Data
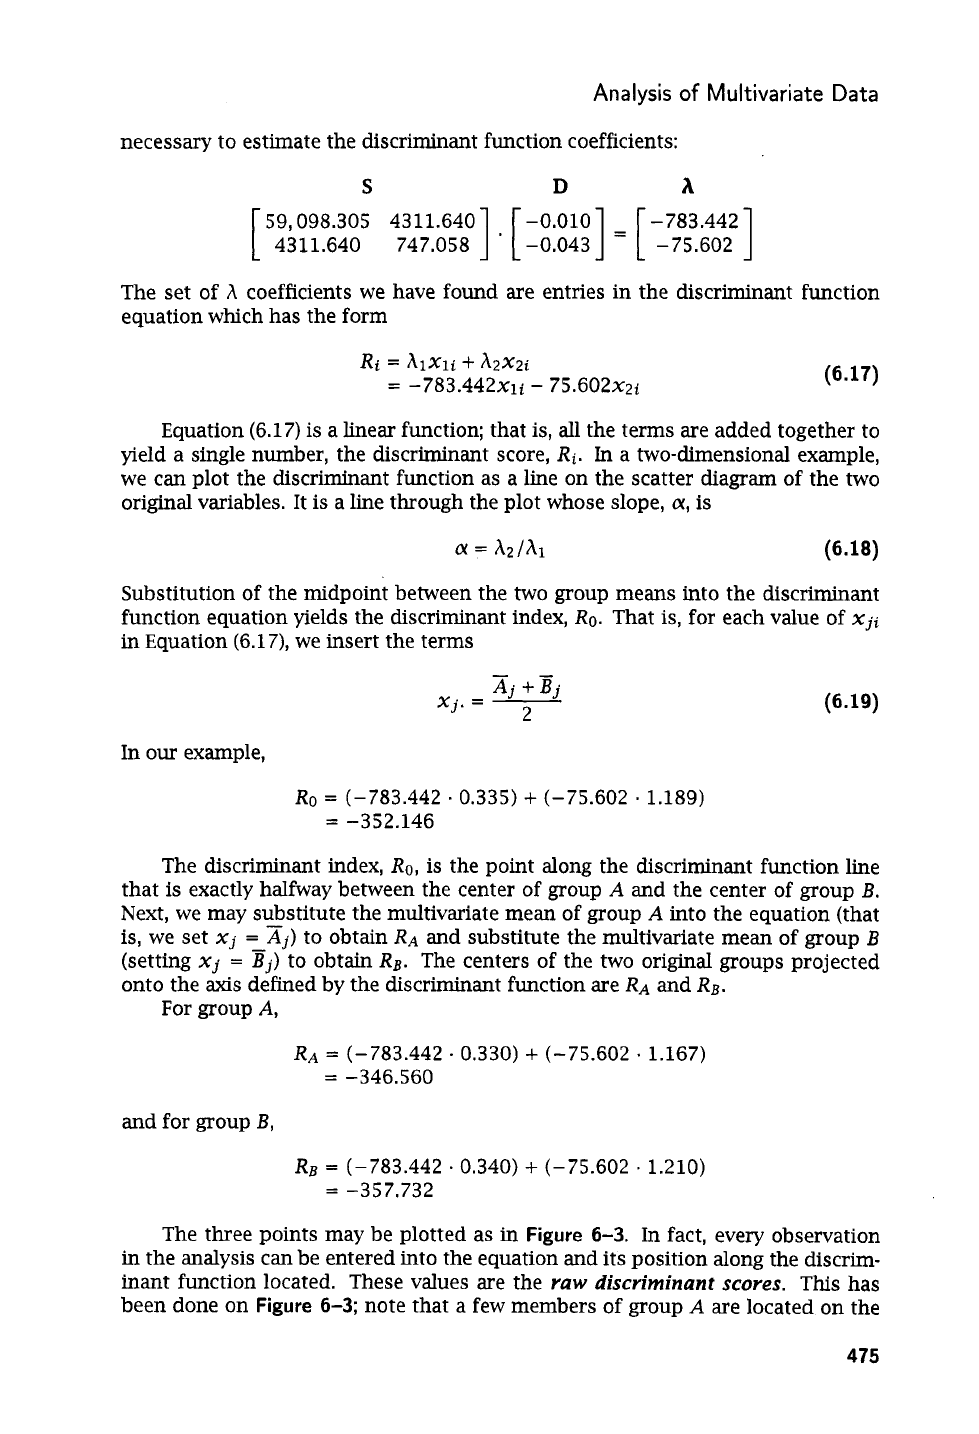
necessary to estimate the discriminant function coefficients:
S
D
h
-
783.442
]
’
[
1::::!]
=
[
-75.602
]
59,098.305 4311.640
4311.640 747.058
[
The set of
h
coefficients
we
have found are entries in the discriminant function
equation which has the form
Equation
(6.17)
is a linear function; that is, all the terms
are
added together to
yield a single number, the discriminant score,
Ri.
In
a two-dimensional example,
we
can plot the discriminant function as a line on the scatter diagram of the two
original variables.
It
is a line through the plot whose slope,
a,
is
a
=
h2Ihl
(6.18)
Substitution
of
the midpoint between the two group means into the discriminant
function equation yields the discriminant index,
Ro.
That is, for each value of
Xji
in
Equation
(6.17),
we insert the terms
-
Aj
+Bj
Xj.
=
-
2
(6.19)
In
our
example,
Ro
=
(-783.442
*
0.335)
+
(-75.602
.
1.189)
=
-352.146
The discriminant index,
Ro,
is the point along the discriminant function line
that is exactly halfway between the center of group
A
and the center of group
B.
Next, we may substitute the multivariate
mean
of group
A
into the equation (that
is,
we set
Xj
:Xj)
to obtain
RA
and substitute the multivariate mean of group
B
(setting
Xj
=
Bj)
to obtain
RB.
The centers of the two original groups projected
onto the
axis
defined by the discriminant function are
RA
and
RB.
For group
A,
RA
=
(-783.442
.
0.330)
+
(-75.602
*
1.167)
=
-346.560
and for group
B,
RB
=
(-783.442
*
0.340)
+
(-75.602
.
1.210)
=
-357.732
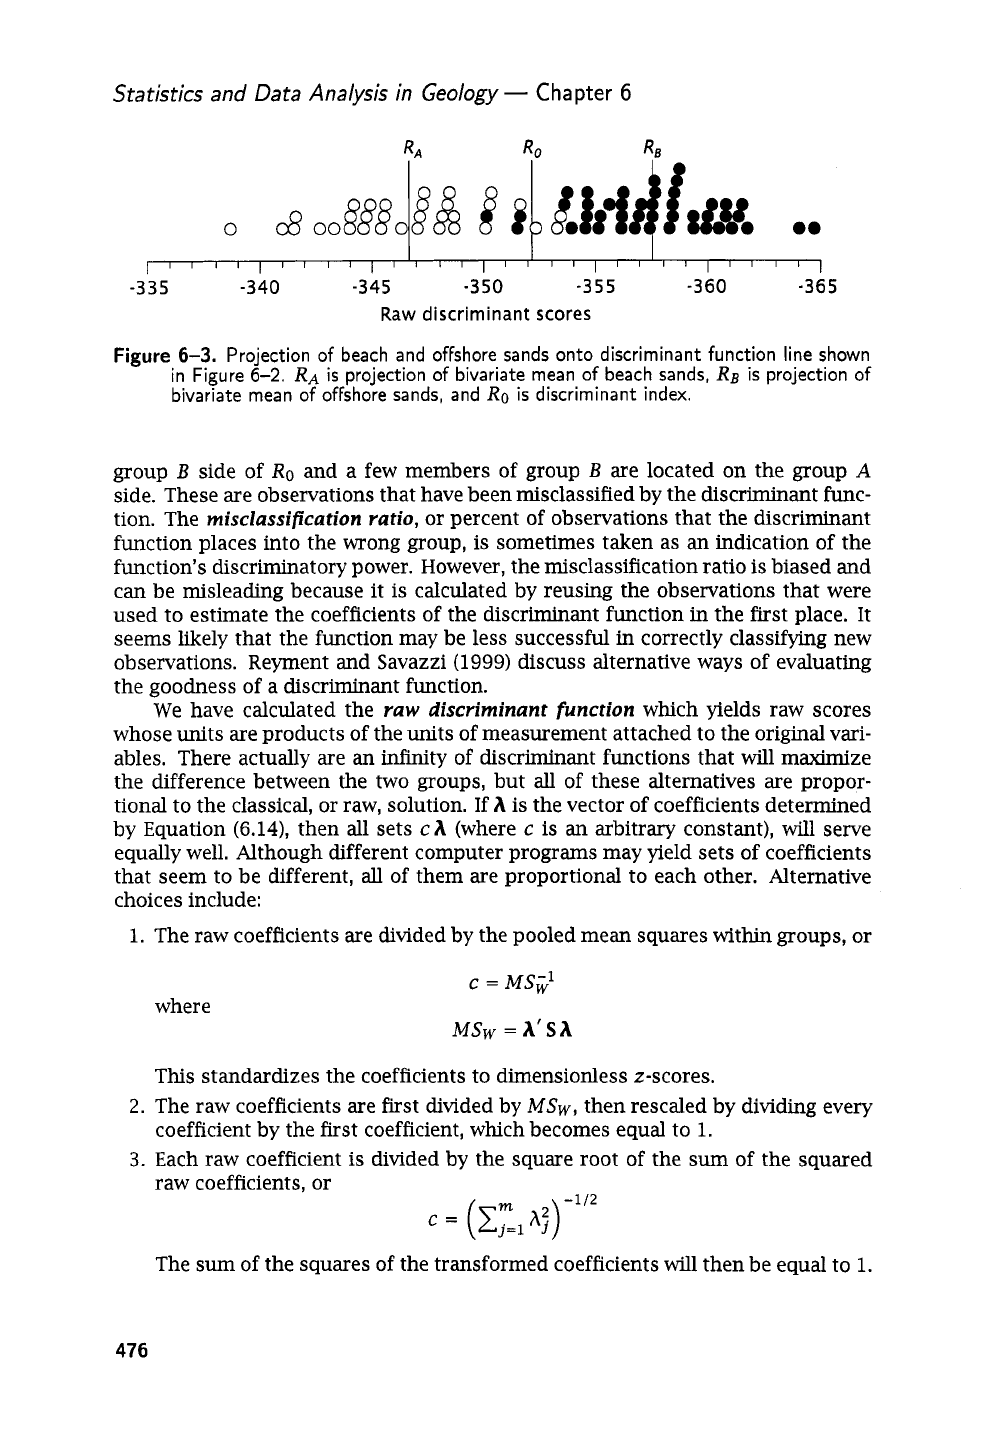
The three points may be plotted as
in
Figure
6-3.
In
fact, every observation
in the analysis can be entered into the equation and its position along the discrim-
inant function located.
These values are the
raw discriminant
scores.
This has
been done on
Figure
6-3;
note that a few members of group
A
are
located on the
475
Statistics and Data Analysis in
Geology
-
Chapter
6
I
I
I
11'1111'1~11~~111111111~~1~~1~1
-335
-340
-345
-350 -355
-360
-365
Raw discriminant
scores
Figure
6-3.
Projection of beach and offshore sands onto discriminant function line shown
in Figure
6-2.
RA
is
projection of bivariate mean of beach sands,
RB
is
projection of
bivariate mean of ofkhore sands, and
Ro
is
discriminant index.
group
B
side of
Ro
and a few members of group
B
are located on the group
A
side. These are observations that have been misclassified by the discriminant func-
tion. The
misclassification ratio,
or percent of observations that the discriminant
function places into the wrong group, is sometimes taken as an indication of the
function's discriminatory power. However, the misclassification ratio is biased and
can
be misleading because it
is
calculated by reusing the observations that were
used to estimate the coefficients of the discriminant function in the first place. It
seems likely that the function may be less successful in correctly classifying new
observations. Reyment and Savazzi (1999) discuss alternative ways of evaluating
the goodness of a discriminant function.
We have calculated the
YUW
discriminant function
which yields raw scores
whose units are products of the units of measurement attached to the original vari-
ables. There actually are
an
infinity of discriminant functions that will maximize
the difference between the two groups, but
all
of these alternatives are propor-
tional to the classical,
or
raw, solution.
If
A
is the vector of coefficients determined
by Equation (6.14), then all sets
cA
(where
c
is an arbitrary constant), will serve
equally well. Although different computer programs may yield sets of coefficients
that seem to be different,
all
of them are proportional to each other. Alternative
choices include:
1.
The raw coefficients are divided by the pooled mean squares within groups,
or
where
c
=
MSK'
MSw
=
A'SA
This standardizes the coefficients to dimensionless z-scores.
coefficient by the first coefficient, which becomes equal to
1.
raw coefficients. or
2.
The raw coefficients are first divided by
MSw,
then rescaled by dividing every
3.
Each raw coefficient is divided by the square root of the
sum
of the squared
The
sum
of the squares of the transformed coefficients will then be equal to
1.
476
Analysis
of
Multivariate Data
Tests
of
significance
If
we
are
willing to make some assumptions about the nature of the data used
in
the discriminant function, we
can
test the significance of the separation between
the two groups. Five basic assumptions about the data are necessary: (a) the ob-
servations
in
each group are randomly chosen,
(b)
the probability of an
unknown
observation belonging to either group is equal,
(c)
variables are normally distributed
within each group, (d) the variance-covariance matrices of the groups
are
equal
in
size, and
(e)
none of the observations used to calculate the function were misclas-
sified.
Of
these, the most difficult to justify are
(b),
(c),
and (d). Fortunately, the
discriminant function is not seriously affected by limited departures from normal-
ity or by limited inequality of variances. Justification of
(b)
must depend upon
a
priori
assessment of the relative abundance of the groups under examination.
If
the assumption of equal abundance seems unjustified, a different assumption may
be made, which
will
shift the position
of
Ro.
[See Anderson
(1984,
chapter
6)
for
an
extensive discussion
of
alternative decision rules for discrimination.]
The first step in
a
test of the significance of a discriminant function is to mea-
sure the separation or distinctness of the two groups. This
can
be done by comput-
ing the distance between the centroids, or multivariate
means,
of the groups. The
measure of distance is derived directly from univariate statistics.
We
can
obtain a
measure of the difference between the means of two univariate samples,
XI
and
Xz,
by simply subtracting one from the other. However, this difference is expressed
in
the same units as the original observations.
If
the difference is divided by the
pooled standard deviation, we obtain a
standardized
difference
in which the dif-
ference between the means of the two groups is expressed
in
dimensionless units
of standard deviation, or z-scores:
JP
When both sides of Equation
(6.20)
are squared,
variance of the two samples,
s;
:
(6.20)
the denominator is the pooled
(6.21)
Suppose that instead of a single variable, two variables are measured on each
observation
in
the two groups. The difference between the bivariate means of the
two groups can be expressed as the ordinary Euclidean, or straight-line, distance
between them. Again denoting the two groups as
A
and
B,
Euclidean distance
=
J(X1
-El)'
+
(&
-
8')'
(6.22)
In general, if
m
variables are measured on each observation, the straight-line
distance between the multivariate means of the two groups is
Euclidean distance
=
(Xj
-Bj)'
(6.23)
The square of the Euclidean distance is
Cj"=,
(Xj
-
Ej)
;
you can verify that this is
the same as the matrix product,
Euclidean distance'
=
D'D
(6.24)
477
2
Statistics and Data Analysis in Geology
-
Chapter
6
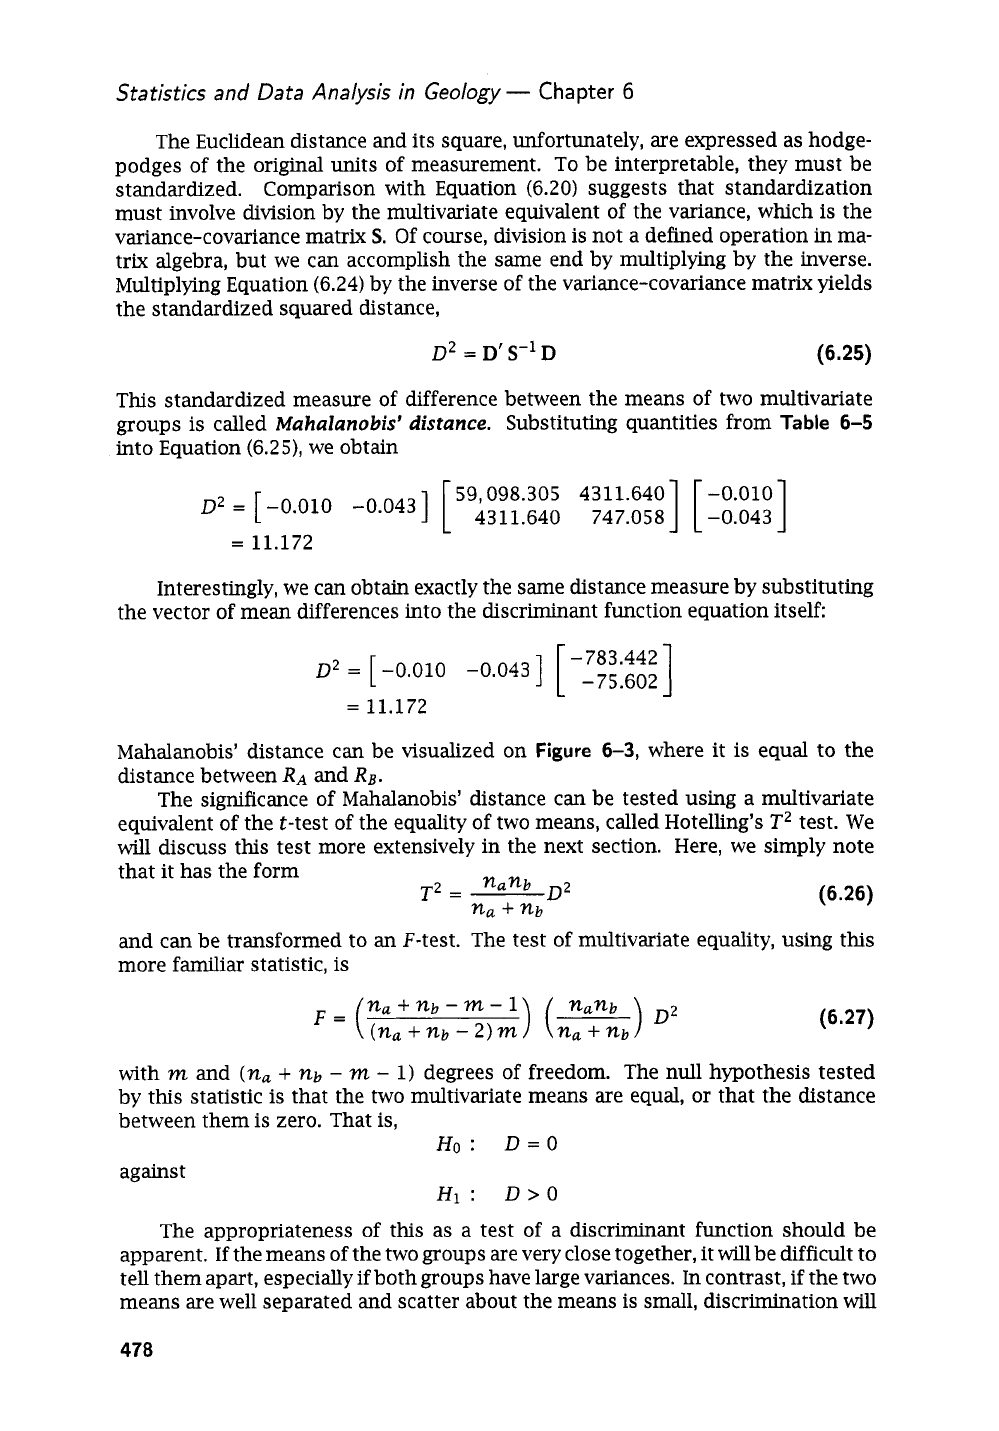
The Euclidean distance and its square, unfortunately, are expressed as hodge-
podges of the original units of measurement.
To
be interpretable, they must be
standardized. Comparison with Equation
(6.20)
suggests that standardization
must involve division by the multivariate equivalent of the variance, which is the
variance-covariance matrix
S.
Of
course, division is not a defined operation
in
ma-
trix algebra, but we
can
accomplish the same end by multiplying by the inverse.
Multiplying Equation
(6.24)
by the inverse of the variance-covariance matrix yields
the standardized squared distance,
D2
=
D‘
S-l
D
(6.25)
This standardized measure of difference between the means of two multivariate
groups is called
Mahalanobis’
distance.
Substituting quantities from
Table
6-5
into Equation
(6.25),
we obtain
59,098.305 4311.640 -0.010
D2
=
[-0*010
-0.0431
[
4311.640 747.0581
[
-0.0431
=
11.172
Interestingly, we can obtain exactly the same distance measure by substituting
the vector of mean differences into the discriminant function equation itself
1
-
783.442
D2
=
[
-0.010 -0.0431
[
-75.602
=
11.172
Mahalanobis’ distance
can
be visualized on
Figure
6-3,
where it
is
equal to the
distance between
RA
and
RB.
The significance of Mahalanobis’ distance
can
be tested using a multivariate
equivalent of the t-test of the equality of two means, called Hotelling’s
T2
test. We
will
discuss this test more extensively in the next section. Here, we simply note
(6.26)
that it has the form
and can be transformed to
an
F-test. The test of multivariate equality, using this
more familiar statistic,
is
nanb
D2
T2
=
na
+
nb
) (
nanb
)
D2
na
+
nb
n,
+
nb
-
m
-
1
F=(
(na
+
nb
-
2)
m
(6.27)
with
m
and
(na
+
nb
-
m
-
1)
degrees of freedom.
The null hypothesis tested
by this statistic is that the two multivariate means are equal, or that the distance
between them
is
zero. That is,
against
Ho:
D=O
Hi:
D>O
The appropriateness of this as a test of a discriminant function should be
apparent.
If
the means of the two groups are very close together, it
will
be difficult to
tell them apart, especially if both groups have large variances.
In
contrast,
if
the two
means are well separated and scatter about the means is small, discrimination
will
478
Analysis
of
Multivariate Data
be relatively easy.
As
an
exercise, it may be instructive to calculate the significance
of the discriminant function for the example we have just worked.
Not all of the variables we have included in the discriminant function
will
be
equally useful in distinguishing one group from another.
We
may wish to iso-
late those variables that
are
not especially helpful and eliminate them from future
analyses. Selecting the most effective set of discriminators for discriminant func-
tion analysis would seem to be analogous to selecting the most efficient predictors
in
multiple regression. The problem, however, is more complicated because the
“dependent”
or
predicted variable in a discriminant function is composed of
dif-
ferences between
two
sets
of
the same variables that
are
used
as
“independent”
predictors of the discrimination. Unlike regression, where the sums of squares
of
y
do not change as different variables
Xj
are
added to the equation, the
sums
of squares of the differences between groups
A
and
B
do change as variables are
added or deleted.
Some idea of the effectiveness of the variables as discriminators can be gained
by computing the
standardized differences,
(6.28)
This is simply the difference between the means of the two groups
A
and
B
for
variable
j,
divided by the pooled standard deviation of variable
j.
Since the mea-
sure does not consider interactions between variables, it is useful only as a general
guide to discriminating power. Stepwise discriminant analysis programs may use
standardized differences
in
choosing the order in which variables are added to the
discriminant function. Marascuilo and
Levin
(1983)
discuss “after-the-fact” con-
trast procedures that can be used to select the most important variables. However,
the significance of different combinations of variables can be tested only by com-
puting the various functions and determining the relative amounts of separation
the different equations produce between the two groups. To avoid bias, such tests
should be run on independent random samples.
Discriminant function analysis provides
a
natural transition between two major
classes of multivariate statistical techniques.
On
one hand, it is closely related to
multiple regression and trend-surface analysis. On the other, it can be expressed
as an eigenvalue problem, related to principal component analysis, factor analysis,
and similar multivariate methods. There are advantages to the use of eigenvectors
in calculating the discriminant function, because they allow us to simultaneously
discriminate between more than two groups. However, we will delay a consideration
of this topic until we examine the basic elements of eigenvector analysis and some
of the simpler eigenvector techniques.
Multivariate Extensions
of
Elementary Statistics
In Chapter
2,
we considered some simple geologic problems that could be examined
by elementary statistical methods.
We
will begin our consideration
of
multivariate
methods in geology with some direct extensions of these simple tests.
You
will
recall that the variation measured in most naturally occurring phenomena could be
described by the normal distribution. This is a reflection of the central limit theo-
rem, which states that observations which are the
sums
of
many
independently op-
erating processes tend to be normally distributed as the number of effects becomes
479

Statistics and Data Analysis in Geology
-
Chapter
6
large. It is this tendency that allows us to use the normal probability distribution as
a basis for statistical tests and provides the starting point for the development
of
the
t-,
F-,
and
x2
distributions and others. The concept
of
the normal distribution
can be extended to include situations in which observational units consist
of
many
variables.
Suppose we collect rocks from
an
area and measure a set of properties on each
specimen. The measurements may include determinations of chemical or miner-
alogical constituents, specific gravity, magnetic susceptibility, radioactivity, or
any
of
an
almost endless list of possible variables.
We
can
regard the set of measure-
ments made on
an
individual rock
as
defining a vector
Xi
=
[
xli
x~i
s
-
-
xmi
],
where there are
m
measured characteristics
or
variables.
If
a sample of observa-
tions, each represented by vectors
Xi,
is randomly selected from a population that
is
the result of many independently acting processes, the observed vectors will
tend to be multivariate normally distributed. Considered individually, each variate
is normally distributed and characterized by a mean,
pj,
and a variance,
uj.
The
joint probabizity distribution
is a p-dimensional equivalent of the normal distribu-
tion, having a vector
mean
p
=
[
p1
pz
-
.
.
pm
]
and a variance generalized into
the form
of
a
diagonal matrix:
u;
0
*-.
..
1
0
0
::..
a&
:1
In addition to these obvious extensions of the normal distribution to the multivari-
ate case, the multivariate normal distribution has
an
important additional charac-
teristic.
This
is the covariance, covjk, which occupies all
of
the off-diagonal posi-
tions of the matrixX. Thus,
in
the multivariate normal distribution, the mean is gen
eralized into a vector and the variance into a matrix of variances and covariances.
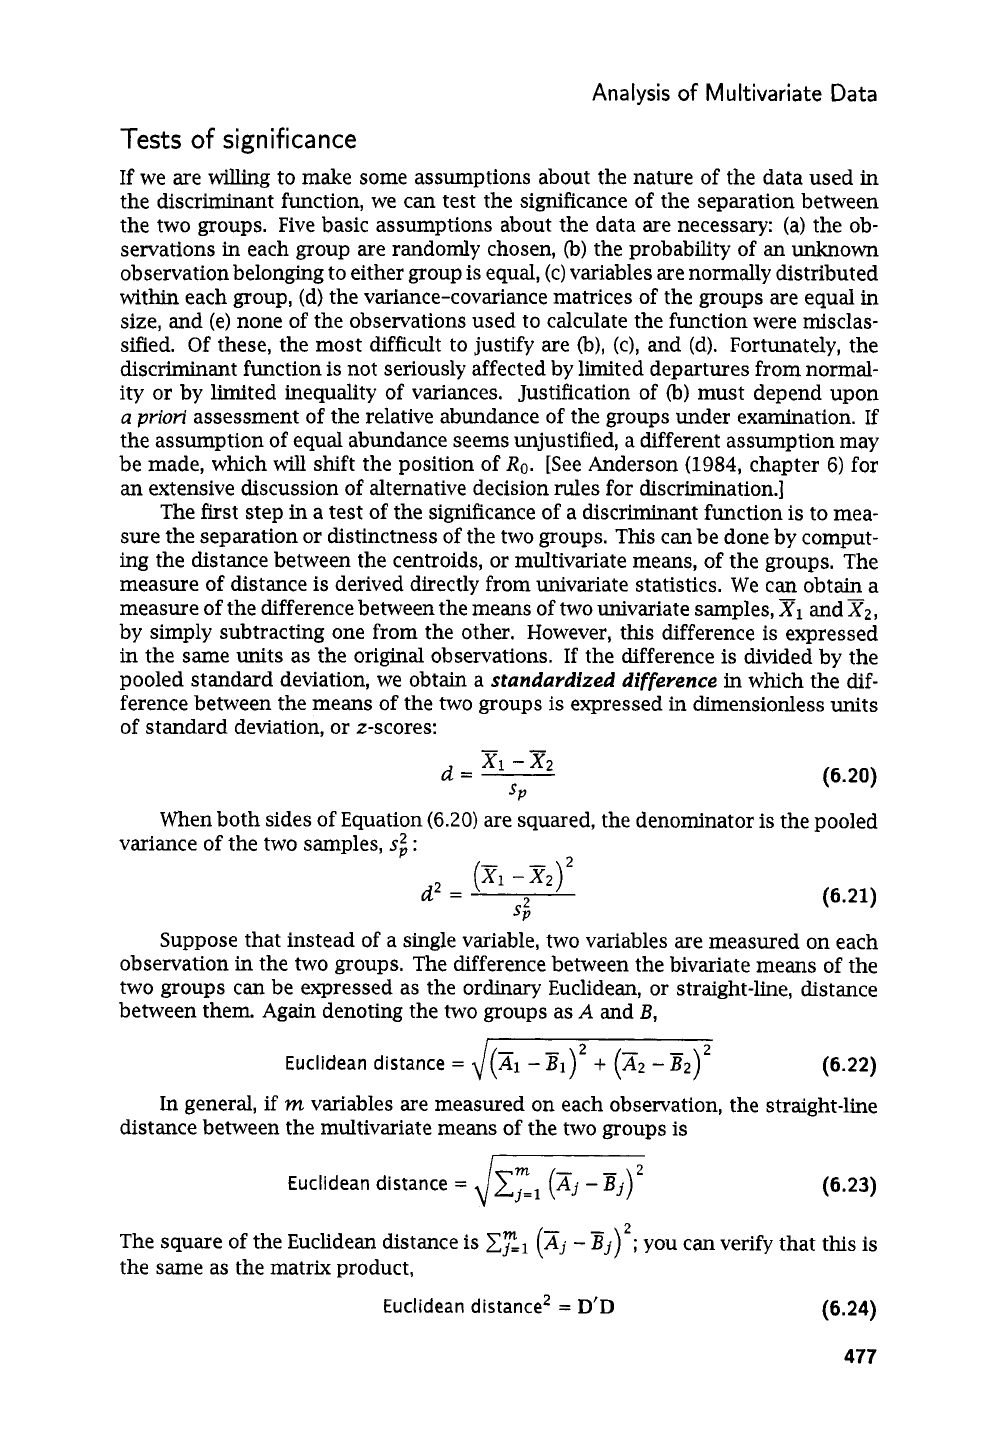
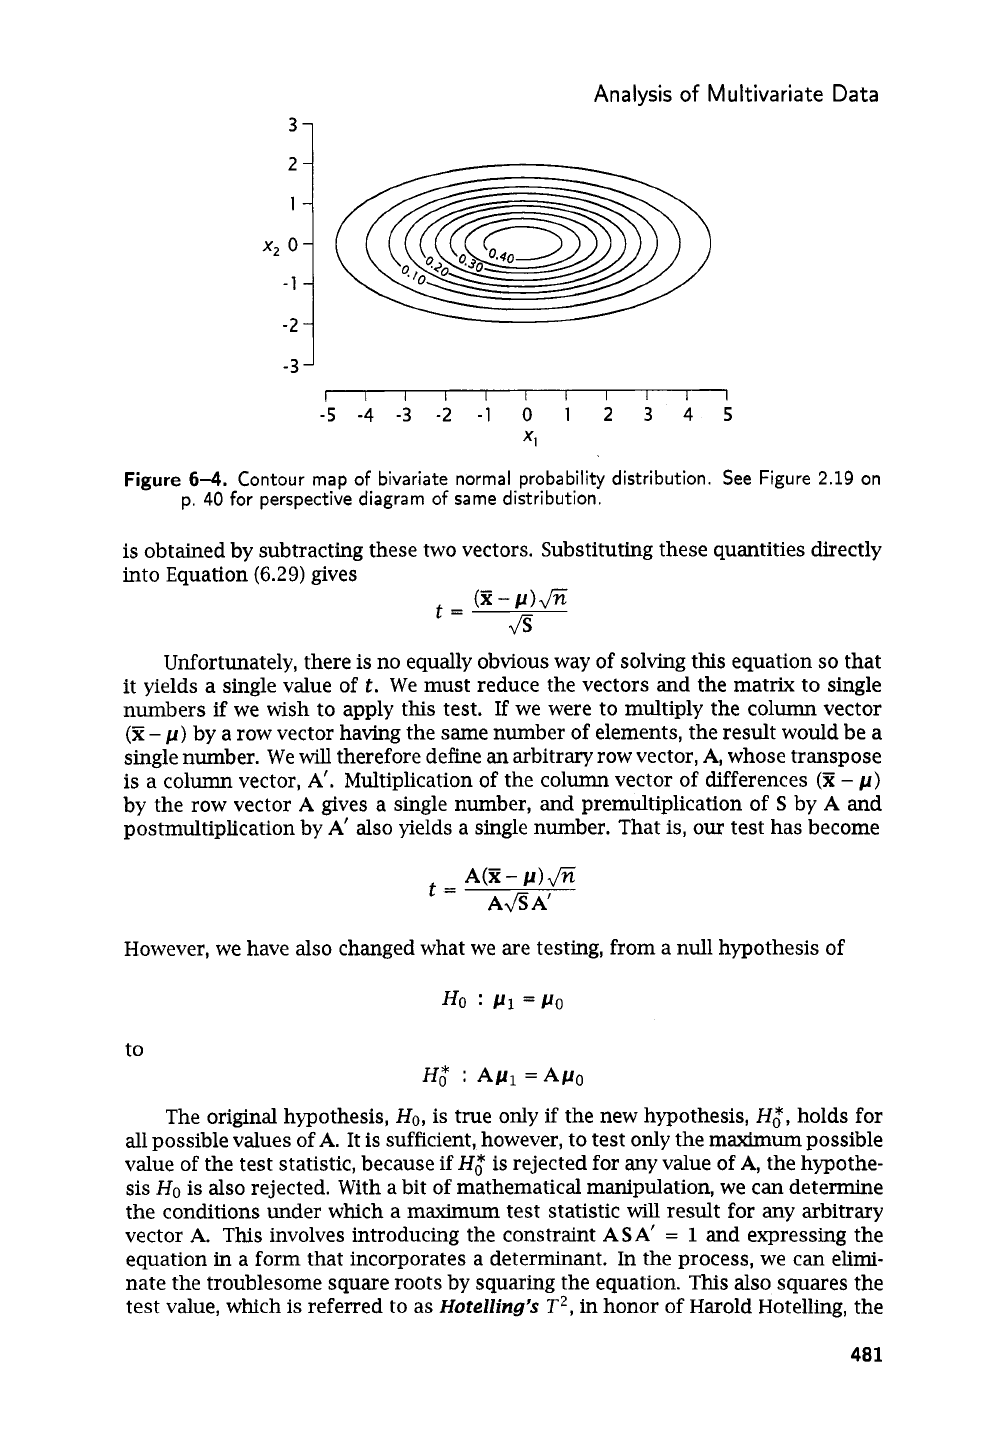
In the simple case of
m
=
2,
the probability distribution forms a three-dimensional
bell curve such as that in
Figure
2-19,
shown as a contour map
in
Figure
6-4.
Al-
though the distributions of variables
x1
and
x2
are shown along their respective
axes, the essential characteristics of the joint probability distribution are better
shown by the major and minor axes of the probability density ellipsoid. Many
of
the multivariate procedures we will discuss are concerned with the relative orien-
tations
of
these major and minor axes.
One of the simplest tests we considered
in
Chapter
2
was a t-test
of
the prob-
ability that a random sample of
n
observations had been drawn from a normal
population with a specified mean,
p,
and an unknown variance,
u2.
The test, given
in
Equation
(2.45)
on p.
70,
can be rewritten
in
the
form
(6.29)
An
obvious generalization of this test to the multivariate case is the substitu-
tion
of
a vector
of
sample means for
x,
a vector of population means
for
p,
and a
variance-covariance matrix for
s2.
We
have defined the vector
of
population means
as
p,
so
a vector of sample means can be designated
X.
Similarly,
Z
is the ma-
trix
of
population variances and covariances,
so
S
represents the matrix of sample
variances and covariances. Both
X
and
p
are taken to be column vectors, although
equivalent equations may be written in which they are assumed to be row vectors.
A
column vector
of
differences between the sample means and the population means
480
Analysis
of
Multivariate Data
-3
I
I
I I I I I
I
I
I
I
-5
-4
-3
-2
-1
0
1
2
3
4
5
XI
Figure
6-4.
Contour map
of
bivariate normal probability distribution.
See
Figure
2.19
on
p.
40
for perspective diagram
of
same distribution.
is
obtained by subtracting these two vectors. Substituting these quantities directly
into Equation
(6.29)
gives
(E
-
6
Unfortunately, there
is
no equally obvious way of solving this equation
so
that
it yields a single value of
t.
We must reduce the vectors and the matrix to single
numbers if we wish to apply this test.
If
we were to multiply the column vector
(E
-
p)
by a row vector having the same number of elements, the result would be a
single number. We
will
therefore define
an
arbitrary row vector,
A,
whose transpose
is a column vector,
A’.
Multiplication of the column vector of differences
(X
-
p)
by the row vector
A
gives a single number, and premultiplication of
S
by
A
and
postmultiplication by
A’
also yields a single number. That
is,
our
test has become
t=
However, we have also changed what we are testing, from a null hypothesis of
to
H,*
ApI
=Ape
The original hypothesis,
Ho,
is true only if the new hypothesis,
H,*,
holds for
all
possible values of
A.
It is sufficient, however, to test only the maximum possible
value of the test statistic, because
if
H,*
is rejected for any value
of
A,
the hypothe-
sis
HO
is also rejected. With a bit of mathematical manipulation, we can determine
the conditions under which a maximum test statistic
will
result for any arbitrary
vector
A.
This
involves introducing the constraint
ASA’
=
1
and expressing the
equation in a form that incorporates a determinant.
In
the process, we can elimi-
nate the troublesome square roots by squaring the equation.
This
also squares the
test value, which
is
referred to as
Hotelling’s
T2,
in honor of Harold Hotelling, the
481
Statistics and Data Analysis in Geology
-
Chapter
6
American statistician who formulated this generalization of Student’s
t.
When
all
operations are complete, we find that the test statistic
can
be expressed as
T~
=
n(E-p)‘S-l
(z-p)
(6.30)
That is, the arbitrary vector
A
is equal to the vector of differences between the
means,
(X
-
p).
We must find the inverse of the variance-covariance matrix, pre-
multiply this inverse by a row vector of differences,
(E
-
p)’,
and then postmultiply
by a column vector
of
these same differences. The test statistic is
a
multivariate
extension of the t-statistic, Hotelling’s
T2.
Critical values of
T2
can be determined
by the relation
T2
n-rn
m(n
-
1)
F=
(6.31)
where
n
is the number of observations and
rn
is the number of variables, allowing us
to use conventional F-tables rather than special tables of the
T2
distribution. More
complete discussions of this and related tests are given
in
texts on multivariate
statistics such as Overall and Klett (1983), Harris (1985), Krzanowski (1988), and
Morrison (1990).
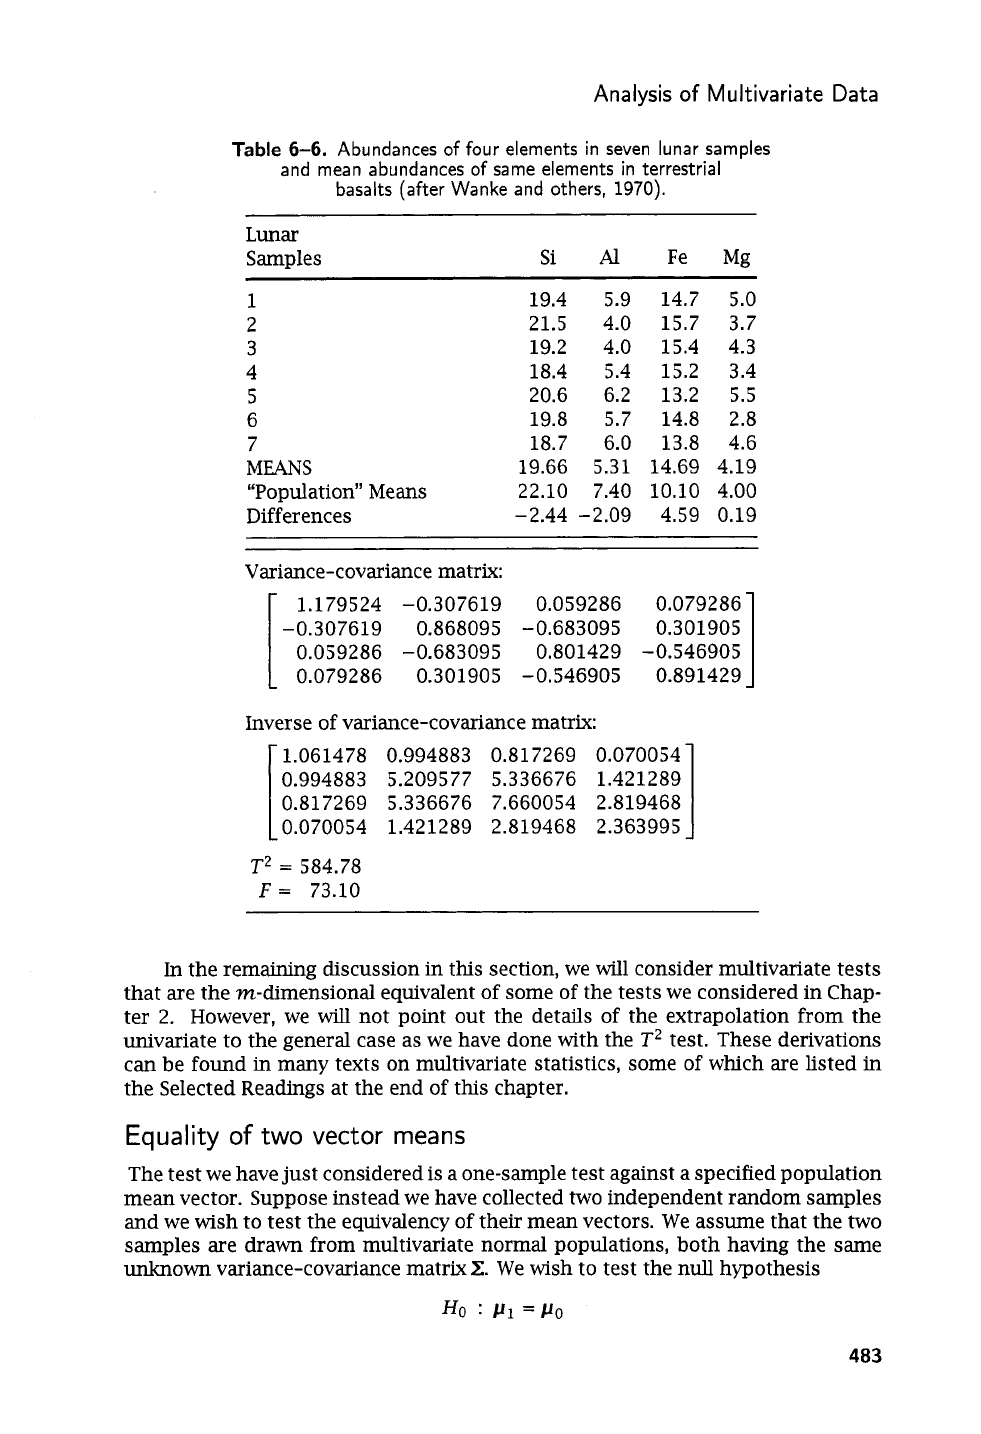
Although the expression of this test in a form such as Equation (6.30) is easy,
computation of a test value for
an
actual data set may be very laborious. For
ex-
ample, suppose we have measured the content of four elements in seven lunar
samples.
We
wish to test the hypothesis that these samples have been drawn from
a population having the same mean as terrestrial basalts. Assume we take our
values for the populations’ means from the
Handbook
of
Physical
Constants
(Clark,
1966, p.
4).
Hotelling’s
T2
seems appropriate to test the hypothesis that the vector
of lunar sample means is no different than the vector of basalt means given in this
reference.
We
must first compute the vector of four sample means and the
4
x
4
matrix of
variances and covariances. The vector of differences between sample and popula-
tion means,
(P
-
p),
must
also
be computed. Next, we must find the inverse of the
variance-covariance matrix, or
S-l.
We
then must perform
two
matrix multiplica-
tions,
(E
-
p)’S-’(JZ
-
p),
and multiply by
n
to produce
T2.
From this description,
you can appreciate that the computational effort becomes increasingly greater as
the number of variables grows larger.
The data for the seven lunar samples are listed
in
Table
6-6,
with the “popu-
lation” means from Clark. Intermediate values
in
the computation of
T2
are also
given, with the final test value of
T2
and the equivalent F-statistic, which has
m
and
(n
-
m)
degrees of freedom. The test statistic of
F
=
73.11
far
exceeds the
critical value of
F4,3,0.01
=
28.71,
so
we
conclude that the mean composition of the
sample of lunar basalts is significantly different than the mean composition of the
population of terrestrial basalts.
We
have dwelled on the
T2
test against a
known
mean not because this specific
test has greater utility
in
geology than other multivariate tests, but to illustrate the
close relationship between conventional statistics and multivariate statistics. Mul-
tivariate equivalents can be formulated directly from most univariate tests with the
proper expansion of the basic assumptions. However, the transition from ordinary
algebra to matrix algebra often obscures the underlying similarity between the two
applications. Although we usually regard multivariate methods as an extension of
univariate statistics, univariate, or ordinary, statistical analysis should be consid-
ered as a special subset of the general area of multivariate analysis.
482
Analysis
of
Multivariate
Data
Table
6-6.
Abundances
of
four elements in seven lunar samples
and mean abundances of same elements in terrestrial
basalts (after Wanke and others,
1970).
Lunar
Samples
Si
Al
Fe Mg
1
19.4
2
21.5
3 19.2
4 18.4
5
20.6
6 19.8
7 18.7
MEANS
19.66
“Population” Means
22.10
Differences
-2.44
5.9 14.7 5.0
4.0 15.7 3.7
4.0 15.4 4.3
5.4
15.2
3.4
6.2 13.2
5.5
5.7 14.8
2.8
6.0 13.8 4.6
5.31 14.69 4.19
7.40 10.10 4.00
-2.09 4.59 0.19
Variance-covariance matrix:
1
1.179524
-0.307619 0.059286
0.079286
-0.307619 0.868095
-0.683095 0.301905
0.059286 -0.683095
0.801429 -0.546905
0.079286
0.301905 -0.546905
0.891429
Inverse of variance-covariance matrix:
1.061478
0.994883 0.817269
0.070054
0.994883
5.209577 5.336676
1.421289
0.817269
5.336676 7.660054
2.819468
0.070054
1.421289 2.819468
2.363995
T2
=
584.78
F
=
73.10
In the remaining discussion in this section, we will consider multivariate tests
that are the m-dimensional equivalent of some of the tests we considered in Chap-
ter
2.
However, we
will
not point out the details of the extrapolation from the
univariate to the general case as we have done with the
T2
test. These derivations
can be found in many texts on multivariate statistics, some of which are listed
in
the Selected Readings at the end of this chapter.
Equality
of
two
vector
means
The test we have just considered is
a
one-sample test against a specified population
mean vector. Suppose instead we have collected two independent random samples
and we
wish
to test the equivalency of their mean vectors. We assume that the two
samples are drawn from multivariate normal populations, both having the same
unknown variance-covariance matrix
Z.
We wish to test the null hypothesis
Ho
:
PI
=Po
483