Davis J.C. Statistics and Data Analysis in Geology (3rd ed.)
Подождите немного. Документ загружается.

Statistics and Data Analysis in
Geology
-
Chapter
5
As
n
becomes infinitely large, all of the fractions that contain
n
in
their denominator
become infinitesimally small and vanish,
so
all terms inside parentheses simply
become equal to 1. The terms inside the brackets simplify to
(-AA)
P
(r)
=
e
r!
(5.12)
Note that
n,
the number of drilling sites, has vanished from the equation leaving
only the discovery-well density,
A,
the number of discovery wells,
Y,
and the area,
A,
of the tracts.
This
is
an
expression of the Poisson distribution, as applied to the
probability of rare, random events (discovery wells) occurring within geographic
areas.
Also
note that
AA
is
simply the mean number of wells per tract, because it
is
the product of the density of discovery wells times the area of a tract. In practice,
we estimate
AA
from the total number of discovery wells,
m,
and the total number
of tracts,
T
m
hA=-
T
(5.13)
We can now perform a
x2
test to see
if
the number of wells per tract matches
that expected if the wells are randomly located according to the Poisson model.
The number of tracts that contain exactly
r
discovery wells can be found by
nr
=
mP(r)
(-hA)
=
me
r!
If
AA
is
estimated by
m/T,
the equation becomes
(5.14)
(5.15)
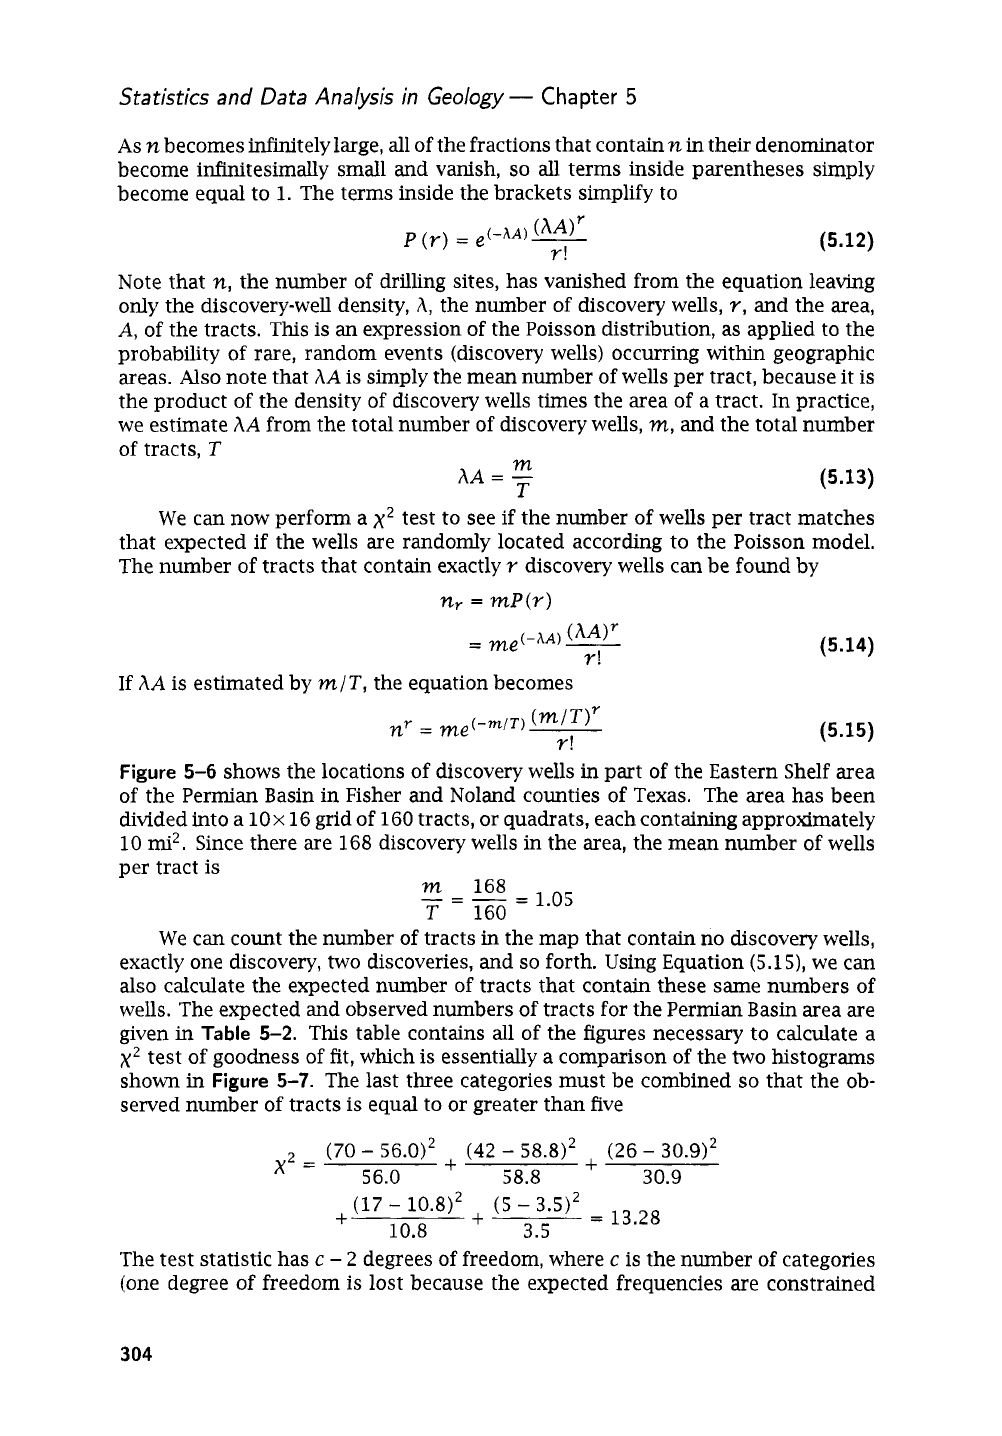
Figure
5-6
shows the locations of discovery wells
in
part
of
the Eastern Shelf area
of the Permian Basin
in
Fisher and Noland counties of Texas. The area has been
divided into a lox 16 grid
of
160 tracts,
or
quadrats, each containing approximately
10
mi2.
Since there are 168 discovery wells in the area, the mean number of wells
per tract is
m
168
T
160
=
1.05
-=-
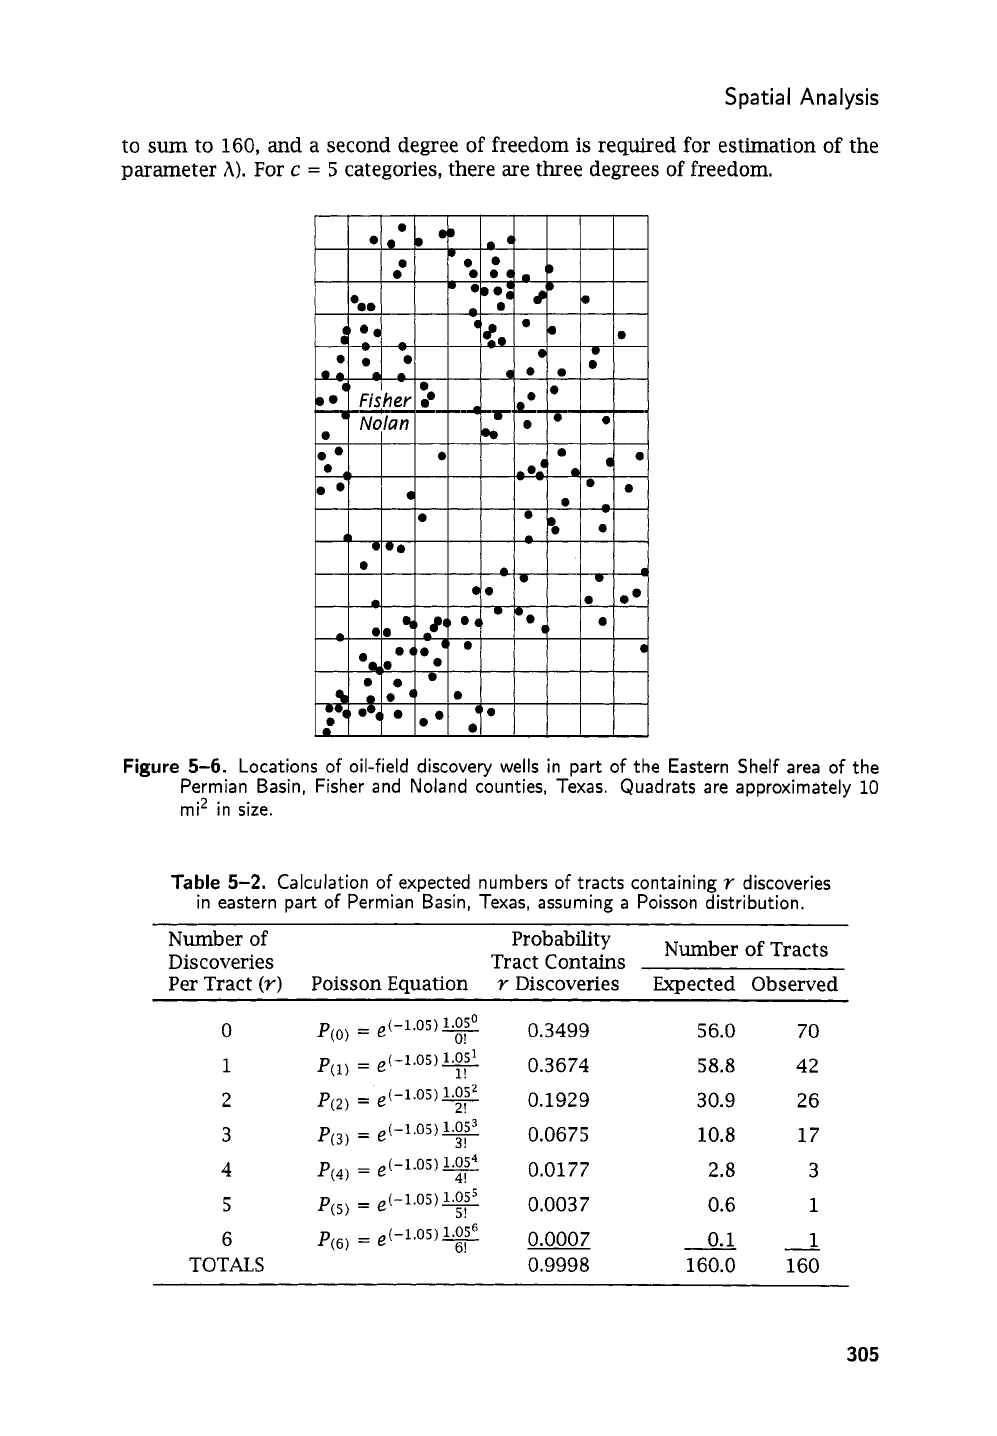
We can count the number of tracts
in
the map that contain
no
discovery wells,
exactly one discovery, two discoveries, and
so
forth. Using Equation
(5.15),
we can
also
calculate the expected number of tracts that contain these same numbers of
wells. The expected and observed numbers
of
tracts for the Permian Basin area are
given
in
Table
5-2.
This table contains
all
of the figures necessary to calculate a
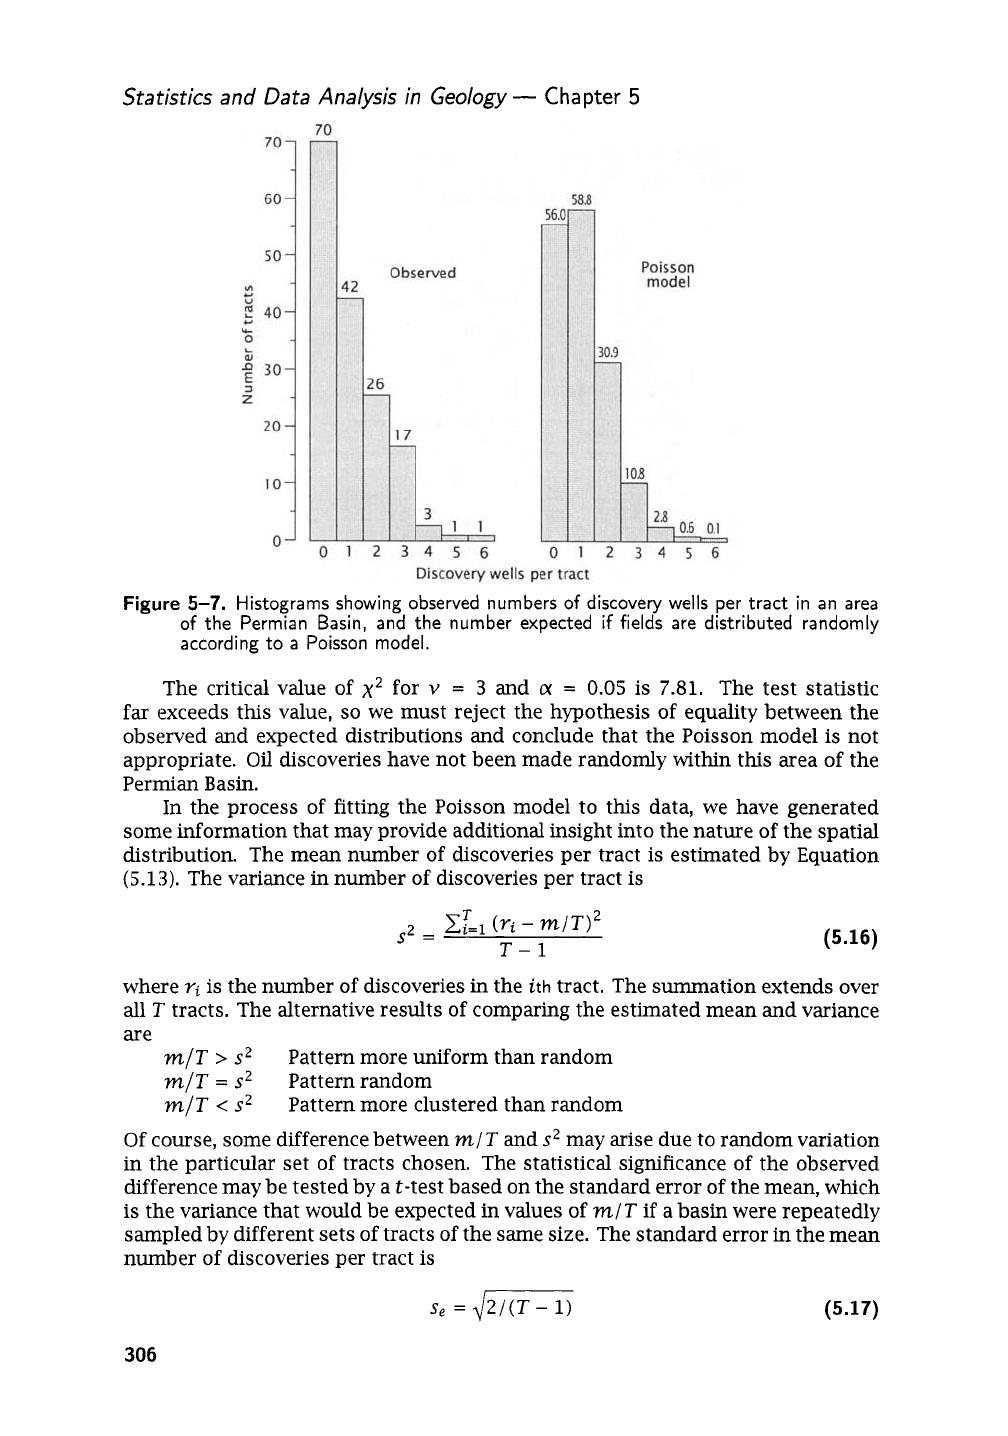
x2
test of goodness of fit, which is essentially a comparison of the two histograms
shown in
Figure
5-7.
The last three categories must be combined
so
that the ob-
served number of tracts
is
equal to
or
greater than five
70
-
56.0)’ (42
-
58.8)’
+
(26
-
30.9)’
58.8
30.9
2J
+
-
56.0
=
13.28
(17
-
10.8)’
+
(5
-
3.5)2
10.8 3.5
+
‘The test statistic has
c
-
2
degrees of freedom, where
c
is the number of categories
(one degree of freedom
is
lost because the expected frequencies are constrained
304
Spatial
Analysis
to sum to
160,
and a second degree of freedom is required for estimation
of
the
parameter
A).
For
c
=
5
categories, there are three degrees of freedom.
Figure
5-6.
Locations of oil-field discovery wells in part of the Eastern Shelf area of the
Permian Basin, Fisher and Noland counties, Texas. Quadrats are approximately
10
mi2 in size.
Table
5-2.
Calculation of expected numbers of tracts containing
Y
discoveries
in eastern part
of
Permian Basin, Texas, assuming
a
Poisson distribution.
Number of
Discoveries
Number of Tracts
Tract Contains
Per Tract
(Y)
Poisson Eauation
Y
Discoveries mected Observed
0
q0)
=
e(-1.05)1.050
O!
0.3499
1
p(l)
=
e(-1.05).!&
l!
0.3674
2
p(2)
=
e(-1.05)*
2!
0.1929
3
4
q4)
=
e(-1.05)1.054
4!
0.0177
5
q5)
=
e(-1.05)1.055
5!
0.0037
6
p(@
=
e(-1.05)1.056
6!
0.0007
TOTALS
0.9998
p(3)
=
e(-1.05)W
0.0675
3!
56.0 70
58.8 42
30.9
26
10.8 17
2.8
3
0.6
1
0.1
__
1
160.0 160
305
Statistics and Data Analysis in Geology
-
Chapter
5
Figure
5-7.
Histograms showing observed numbers
of
discovery wells per tract in an area
of
the
Permian Basin, and the number expected
if
fields are distributed randomly
according to
a
Poisson model.
The critical value of
x2
for
v
=
3
and
(x
=
0.05
is
7.81.
The test statistic
far exceeds this value,
so
we must reject the hypothesis of equality between the
observed and expected distributions and conclude that the Poisson model
is
not
appropriate.
Oil
discoveries have not been made randomly within this area of the
Permian Basin.
In the process of fitting the Poisson model to this data, we have generated
some information that may provide additional insight into the nature of the spatial
distribution. The mean number
of
discoveries per tract is estimated by Equation
(5.13).
The variance in number of discoveries per tract is
(5.16)
where
ri
is
the number of discoveries in the
ith
tract. The summation extends over
all
T
tracts. The alternative results of comparing the estimated mean and variance
are
m/T
>
s2
m/T
=
s2
Pattern random
m/T
<
s2
Pattern more uniform than random
Pattern more clustered than random
Of
course, some difference between
mlT
and
s2
may arise due to random variation
in the particular set of tracts chosen. The statistical significance of the observed
difference may be tested by a t-test based on the standard error of the mean, which
is
the variance that would be expected in values
of
m/T
if
a basin were repeatedly
sampled by different sets of tracts of the same size. The standard error in the mean
number of discoveries per tract is
306
(5.17)
Spatial
Analysis
The t-test compares the ratio between
m/T
and
s2,
which should be equal to 1.0
if
the two statistics are the same
(F)
-
1.0
t=
Se
(5.18)
The test has
T
-
1
degrees of freedom.
For the eastern Permian Basin area, the variance in number of wells per tract is
The standard error of the mean number of wells per tract can be estimated as
se
=
&
=
0.112
The t-statistic for the test of equivalence of the mean and variance is
(1.05/1.46)
-
1.0
0.112
=
-8.86
t=
At a significance level of
o(
=
0.05
and 159 degrees of freedom, the critical
value of
t
for a two-tailed test is 1.96; the computed statistic
far
exceeds this and
so
we may conclude as we did in the
x2
test that the spatial distribution
is
not
random. Since the variance is significantly greater than the mean, we must also
conclude that discovery wells are areally clustered.
CI
ustered patterns
Many naturally occurring spatial distributions show a pronounced tendency toward
clustering. This is especially true of certain biological variables, such as presence
of specific organisms or occurrences of an infectious disease. The descendants of
a sedentary parent, perhaps a coral or a tree, tend to grow nearby, leading to devel-
opment of densely populated areas surrounded by areas that are relatively barren.
Clustered patterns of points
can
be modeled by many theoretical distributions,
most of which
can
be regarded as combinations of two or more simpler distribu-
tions. One of the distributions describes the locations of the centers of clusters,
while the other describes the pattern of individual points around the centers of the
clusters.
The negative binomial distribution can be used to model the occurrence of
clustered points in space in a manner equivalent to the use of the Poisson to model
randomly arranged points.
An
extensive discussion with citations
to
studies in
many fields is given by Ripley (1981). Griffiths (1962, 1966) advocated the use of
the negative binomial as an appropriate model for the occurrence of
oil
fields and
ore bodies.
One derivation of the negative binomial is as a compound Poisson and loga-
rithmic distribution with clusters of points randomly located within a region; indi-
vidual points within a cluster follow a logarithmic distribution. In the formulation
appropriate for describing spatial patterns, the negative binomial
is
k
(5.19)
307
Statistics and Data Analysis in Geology
-
Chapter
5
In terms of the oil-field distribution problem we have just considered,
Y
is the
number of discovery wells in a tract,
p
is the probability that a given drilling site
contains a discovery well, and
k
is a measure of the degree of clustering of the
discoveries.
If
k
is
large, clustering
is
less pronounced and the spatial distribution
approaches the Poisson, or randomness.
As
k
approaches zero, the pattern of
clustering becomes more pronounced. The density,
A,
is equal to
h
=
kp
(5.20)
If
k
is not
an
integer (and in general it will not be), this combinatorial equation
cannot be solved. Then, the following approximation must be used:
(5.21)
As
with the Poisson distribution,
h
is estimated by the average density of discoveries
per tract,
m/T.
The clustering parameter,
k,
is estimated by
(5.22)
where
s2
is the variance in number of discovery wells per tract. Then, the probability
p
can be estimated as
(5.23)
We can apply the negative binomial model to the data on discovery wells
in
the eastern part of the Permian Basin
(Fig.
5-6)
to see
if
this distribution can ade-
quately describe their spatial distribution. The mean and variance of the number
of discovery wells per tract have already been found:
m/T
=
.1.05
and
s2
=
1.46.
The clustering effect can be estimated using Equation
(5.22)
=
2.69
1.05*
k=
1.46
-
1.05
In
turn, the probability of a discovery well occurring in a tract is
p=--
"05
-
0.390
2.69
Using the approximation equations, the probability that a given tract
will
con-
tain no discovery wells is
=
0.4124
1
(1
+
0.390)2.69
P(0)
=
The probability that a tract will contain exactly one discovery well is
308
Spatial Analysis
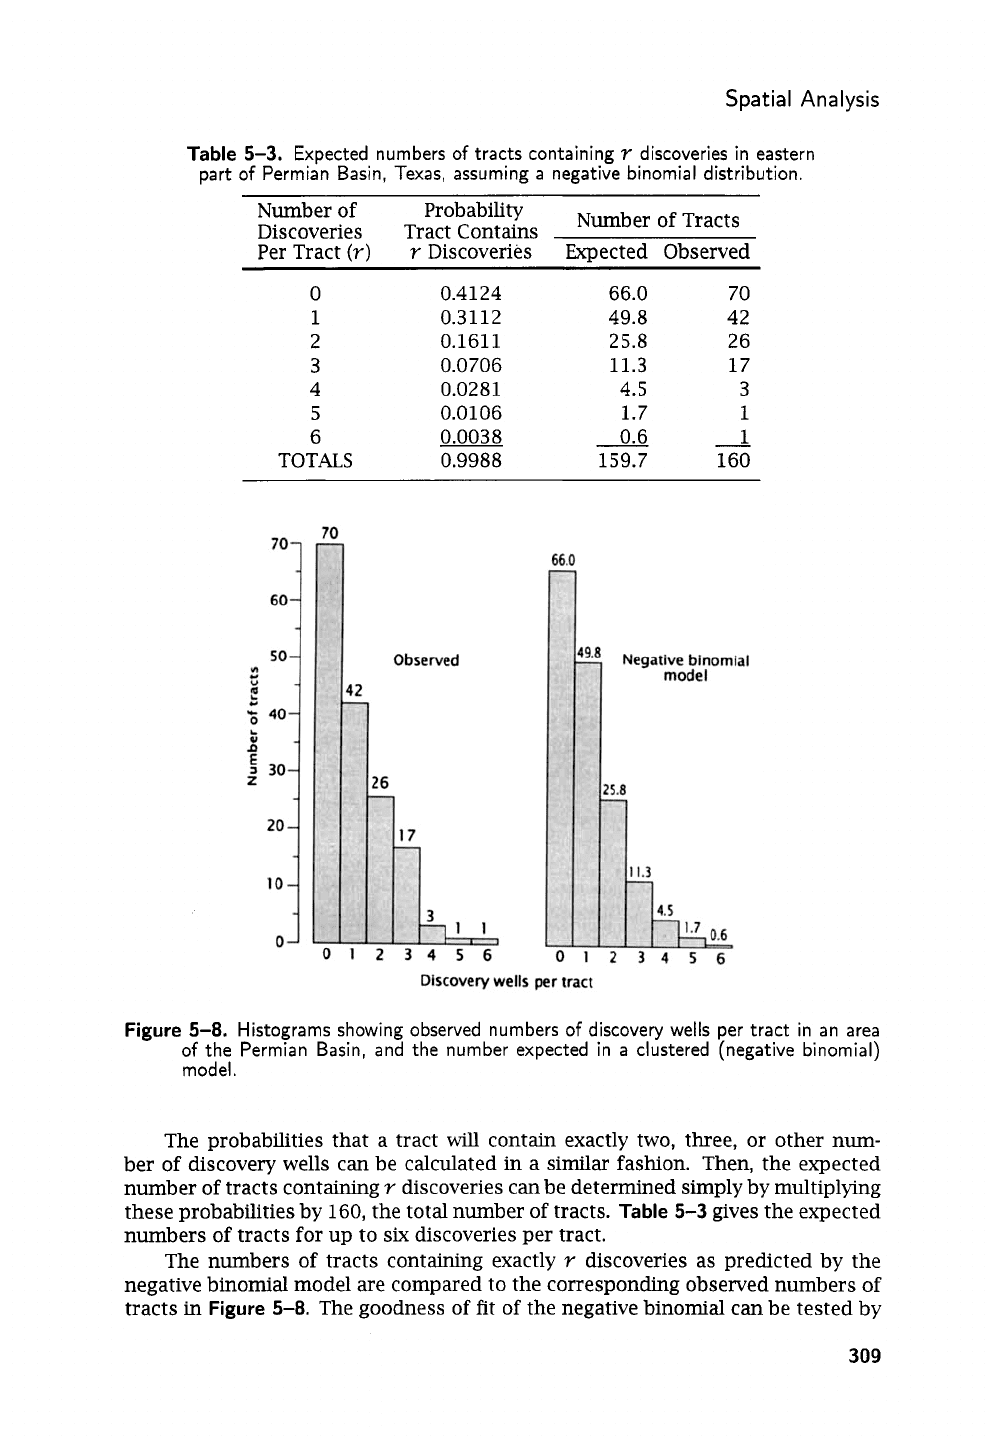
Table
5-3.
Expected numbers
of
tracts containing
Y
discoveries in eastern
part
of
Permian Basin, Texas, assuming
a
negative binomial distribution.
Probability Number of Tracts
Number of
Discoveries Tract Contains
Per Tract
(Y)
Y
Discoveries Expected Observed
0
1
2
3
4
5
6
TOTALS
0.4124
0.3112
0.1611
0.0706
0.0281
0.0106
0.0038
0.9988
66.0
49.8
25.8
11.3
4.5
1.7
0.6
159.7
70
42
26
17
3
1
2
160
Discovery
wells
per
tract
Figure
5-8.
Histograms showing observed numbers
of
discovery wells per tract in an area
of
the Permian Basin, and the number expected in
a
clustered (negative binomial)
model.
The probabilities that a tract
will
contain exactly two, three, or other num-
ber of discovery wells can be calculated
in
a similar fashion. Then, the expected
number of tracts containing
Y
discoveries can be determined simply by multiplying
these probabilities by
160,
the total number of tracts.
Table
5-3
gives the expected
numbers of tracts for up to
six
discoveries per tract.
The numbers of tracts containing exactly
Y
discoveries as predicted by the
negative binomial model are compared to the corresponding observed numbers of
tracts
in
Figure
5-8.
The goodness
of
fit
of
the negative binomial can be tested by
309
Statistics and Data Analysis in Geology
-
Chapter
5
a
x2
test exactly like that used to check the fit of the Poisson model. Again, it is
necessary to combine the
final
three categories
so
a frequency of five or more is
obtained. The test statistic
is
x2
=
4.82, with
(5
-
2
=
3) degrees of freedom. This
is
less than the critical value of
x2
for
o(
=
0.05
and
v
=
3,
so
we cannot reject
the negative binomial as a model of the spatial distribution
of
discovery wells in
the eastern part of the Permian Basin. Keep in mind that this
is
not equivalent
to
proof that the wells do follow a negative binomial model, because it is possible that
some other clustered model might provide an even better fit. However, the negative
binomial does generate a spatial distribution that is statistically indistinguishable
from the one observed.
Nearest- neig
h
bor
an
a
lysis
An
alternative to quadrat analysis is
nearest-neighbor analysis.
The data used are
not the numbers of points within subareas, but the distances between closest pairs
of points. Since it is not necessary to select a quadrat size, nearest-neighbor pro-
cedures avoid the possibility of finding that a pattern is random at one scale but
not at another.
Also,
since there are usually many more pairs of nearest neigh-
bors than quadrats, the analysis is more sensitive.
A
good introduction to nearest-
neighbor techniques
is
given by Getis and Boots (1978). Ripley (1981) provides a
review of theory and applications
in
several fields,
as
do Cliff and Ord (1981). Shaw
and Wheeler (1994) and B&ley and Gatrell(1995) discuss computational aspects
of
neares t-neighbor analyses.
Nearest-neighbor analysis compares characteristics of the observed set of
dis-
tances between pairs of nearest points with those that would be expected
if
the
points were randomly placed. The characteristics
of
a theoretical random pattern
can be derived from the Poisson distribution.
If
we ignore the effect of the edges
of our map, the expected mean distance between nearest neighbors
is
-1
s’2m
(5.24)
where
A
is
the area of the map and
n
is
the number of points.
You
will recall that
A/n
is the point density,
A.
The sampling variance of is given by
If
we work out the constants.
0.06831
A
n2
g;
=
(5.25)
(5.26)
The standard error of the mean distance between nearest neighbors is the square
root of
CT;
0.26136
se
=
4-
(5.27)
The distribution of
simple z-test given
-
6
is normal provided
n
is greater than 6,
so
we can use the
in
Chapter
2
to test the hypothesis that the observed mean
310
Spat
ia
I
An
a
I
ysis
distance between nearest neighbors,
a,
is equal to the value of
8
from a random
pattern of points of the same density. The test is
-
d-8
z=-
Se
(5.28)
This is the form of the nearest-neighbor test that is commonly presented, but
un-
-
fortunately it has a serious defect for most practical purposes. The expected value
6
assumes that edge effects are not present, which means that the observed pattern
of points must extend to infinity in all directions
if
a
and
8
are
to
be validly com-
pared. Since the map does not extend indefinitely, the nearest neighbors of points
near the edges must lie within the body of the map, and
so
d
is biased toward a
greater value (Upton and Fingleton,
1985).
There are several corrections for this
problem.
If
data are available beyond the limits of the area being analyzed, the
map can be surrounded by a
guard region.
Then, nearest-neighbor distances be-
tween points inside the map and points in the guard region can be included in the
calculation of
d.
Alternatively, we can consider
our
map to be drawn not on a flat
plane but on a torus. In this case, in the right map edge would be adjacent to the
left edge
and
the top adjacent to the bottom. The nearest neighbor of a point along
the right edge of the map might lie just inside the left edge (this concept should
be familiar to anyone who has contoured point densities on stereonets). Another
way of regarding this particular correction is to imagine that the pattern of points
repeats
in
all
directions, like floor tiles. Any point lying adjacent to
an
edge of
the map has {he opportunity to find a point across the edge that may be a closer
neighbor than the nearest point within the map.
A
third correction involves adjusting
d
so
that the boundary effects are in-
cluded in its expected value. Using numerical simulation, Donnelly
(1978)
found
these alternative expressions for the theoretical mean nearest-neighbor distance
and its sampling variance:
and
58
N
0.070-
A
+
0.035Pp
JA
n2
(5.29)
(5.30)
In these approximations,
p
is the perimeter of the rectangular map. Note that
if
the map has no edges, as when it is considered to be drawn on a torus,
p
is
zero
and these equations are identical to equations
(5.24)
and
(5.26):
The expected and observed mean nearest-neighbor distances can be used to
construct an index to the spatial pattern. The ratio
-
d
6
R=-
(5.31)
is the
nearest-neighbor statistic
and ranges from
0.0
for a distribution where
all
points coincide and are separated by distances of zero, to
1.0
for a random
dis-
tribution of points, to a maximum value of
2.15.
The latter value characterizes
a distribution in which the mean distance to the nearest neighbor is maximized.
The distribution has the form of a regular hexagonal pattern where every point
311
Statistics and Data Analysis in Geology
-
Chapter
5
00
0%
0
00
00
00
oooooo
0 00
0
008
oo
$0
0
0 0
OO
0
0 00
00
0
Bo
OOO
0 0
0
0
OO
00 00
00
O
n
0 0
0
0
0 0
0 0
0
0
0 0
0
0 0 0
0 0 0
0
0
0
0
0 0
0
00
0 0
0
0
a
-
00
0
0
00
0
OO
o
oe
00
O
0
0
0
0
00
0
0
00
0
OQ
0
DO
0
0 0
cDo
0
n
-
a
00000000
00000000
00000000
00000000
00000000
00000000
00000000
00000000
b
%
0
00
8
f
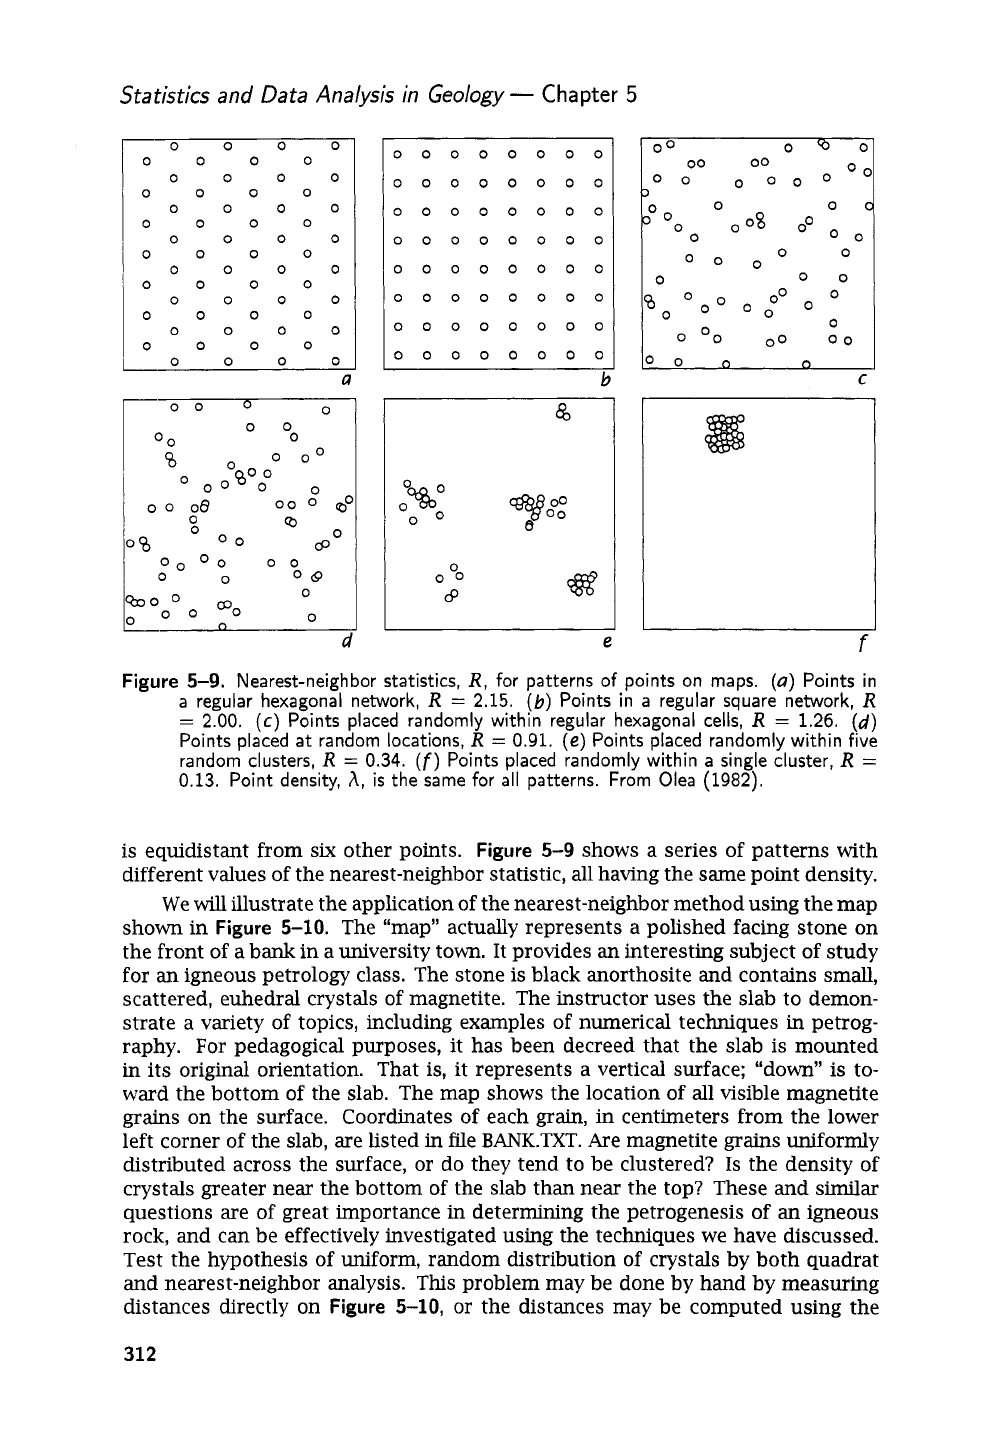
Figure
5-9.
Nearest-neighbor statistics,
R,
for patterns of points on maps.
(a)
Points in
a
regular hexagonal network,
R
=
2.15.
(b)
Points in
a
regular square network,
R
=
2.00.
(c)
Points placed randomly within regular hexagonal cells,
R
=
1.26.
(d)
Points placed
at
random locations,
R
=
0.91.
(e)
Points placed randomly within five
random clusters,
R
=
0.34.
(f)
Points placed randomly within a single cluster,
R
=
0.13.
Point density,
A,
is
the same for all patterns. From Olea (1982).
is equidistant from
six
other points.
Figure
5-9 shows a series of patterns with
different values of the nearest-neighbor statistic, all having the same point density.
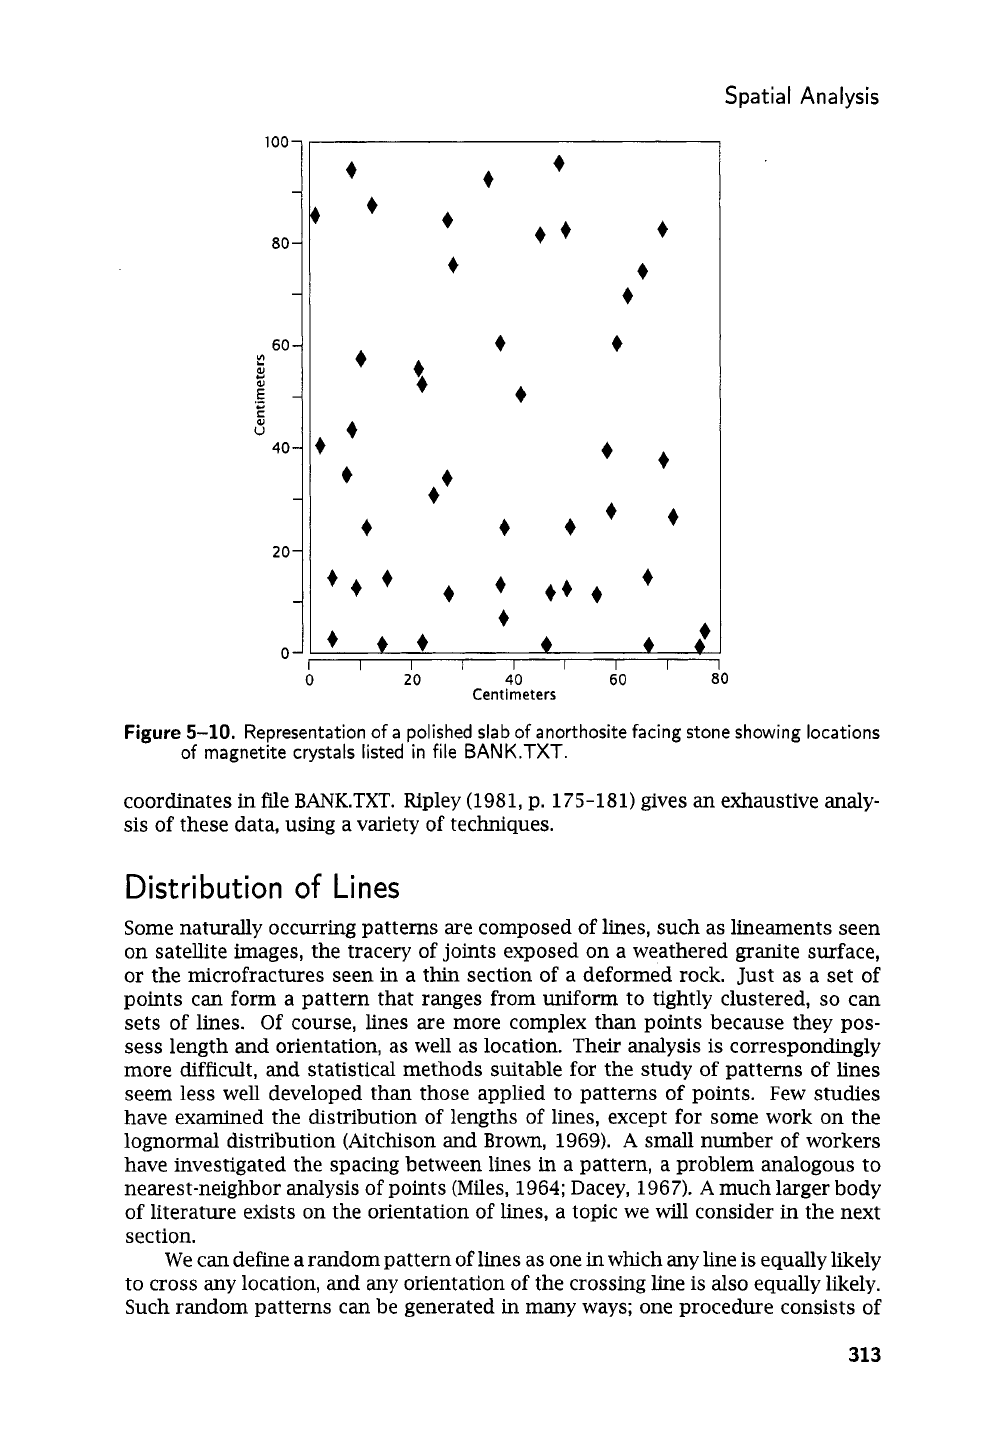
We will illustrate the application of the nearest-neighbor method using the map
shown in
Figure
5-10.
The “map” actually represents a polished facing stone on
the front of a bank in a university town. It provides an interesting subject of study
for
an
igneous petrology class. The stone is black anorthosite and contains small,
scattered, euhedral crystals of magnetite. The instructor uses the slab to demon-
strate
a
variety of topics, including examples of numerical techniques in petrog-
raphy. For pedagogical purposes, it has been decreed that the slab is mounted
in
its original orientation. That
is,
it represents a vertical surface; “down”
is
to-
ward the bottom of the slab. The map shows the location of
all
visible magnetite
grains on the surface. Coordinates of each grain, in centimeters from the lower
left corner of the slab, are listed
in
file BANK.TXT. Are magnetite
grains
uniformly
distributed across the surface, or do they tend to be clustered?
Is
the density of
crystals greater near the bottom of the slab than near the top? These and similar
questions are of great importance in determining the petrogenesis of
an
igneous
rock, and can be effectively investigated using the techniques we have discussed.
Test the hypothesis of uniform, random distribution of crystals by both quadrat
and nearest-neighbor analysis. This problem may be done by hand by measuring
distances directly on
Figure
5-10,
or the distances may be computed using the
312
Spat
i
a
I
An
a
I
ysis
100-
-
80-
-
60
-
r
I
.-
E-
Y
S
s
40-
-
20-
-
OJ
4
4
4
4
4
1
4
'4
'
4
44
4
4
4
4
4
t
4'
4
4
4
4
4
4
4
4
44
4
4
4
4
Figure
5-10.
Representation
of
a polished slab
of
anorthosite facing stone showing locations
of
magnetite crystals listed in file
BANK.TXT.
coordinates in file
BANK.TXT.
Ripley (1981, p. 175-181) gives an exhaustive analy-
sis
of these data, using a variety of techniques.
Distribution
of
Lines
Some naturally occurring patterns are composed of lines, such as lineaments seen
on satellite images, the tracery of joints exposed on a weathered granite surface,
or the microfractures seen in a thin section of a deformed rock. Just as a set of
points can form a pattern that ranges from uniform to tightly clustered,
so
can
sets of lines.
Of
course, lines are more complex than points because they
pos-
sess length and orientation, as well as location. Their analysis
is
correspondingly
more difficult, and statistical methods suitable for the study of patterns of lines
seem less well developed than those applied to patterns of points. Few studies
have examined the distribution of lengths of lines, except for some work on the
lognormal distribution (Aitchison and Brown, 1969).
A
small number of workers
have investigated the spacing between lines in a pattern, a problem analogous to
nearest-neighbor analysis of points (Miles, 1964; Dacey, 1967).
A
much larger body
of literature exists on the orientation of lines, a topic we
will
consider in the next
section.
We can define a random pattern
of
lines as one in which any line is equally likely
to cross
any
location, and
any
orientation of the crossing line
is
also equally likely.
Such random patterns can be generated in many ways; one procedure consists of
313