Davis J.C. Statistics and Data Analysis in Geology (3rd ed.)
Подождите немного. Документ загружается.

Statistics and Data Analysis in
Geology
-
Chapter
5
peel prints, photomicrographs, and electron micrographs. In fact, any sort of two-
dimensional spatial representation is included.
Among the topics we will consider that have obvious applications to fields as
diverse as geophysics and microscopy
is
the probability of encountering an object
with a systematic search across an area. We
will
look at the statistics of directional
data in both two and three dimensions.
Many
natural phenomena are expressed
as complicated patterns of lines and areas that can best be described as fractals,
which we
will
touch upon. We
will
also look at ways of describing and comparing
more conventional shapes of individual objects, ranging
in
size from islands to oil
fields to microfossils.
Map relationships are almost always expressed in terms of points located on
the map. We are concerned with distances between points, the density of points,
and the values assigned to points. Most maps are estimates of continuous func-
tions based on observations made at discrete points.
An
obvious example
is
the
topographic map; although the contour lines are
an
expression of a continuous
and unbroken surface, the lines are calculated from measurements taken at trian-
gulation and survey control points.
An
even more obvious example
is
a structural
contour map. We do not know that the structural surface is continuous, because
we can observe it only at the locations where
drill
holes penetrate the surface.
Nevertheless, we believe that it is continuous and we estimate its form from the
measurements made at the wells, recognizing that our reconstruction is inaccurate
and lacking in detail because we have no data between wells.
When mapping the surface geology of a desert region, we
can
stand at one
locality where strike and dip have been measured and extend formation bound-
aries on our map with great assurance because we can see the contacts across the
countryside. In regions of heavy vegetation or deep weathering, however, we must
make do with scattered outcrops and poor exposures; the quality of the finished
map reflects to a great extent the density of control points. Geologists should be
intensely interested in the effects which control-point distributions have on maps,
but few studies of this influence have been published.
In
fact, almost
all
studies of
point distributions have been made by geographers.
In
this chapter, we will exam-
ine some of these procedures and consider their application to maps and
also
to
such problems as the distribution of mineral grains in thin sections.
Geologists exercise their artistic talents as well as their geologic skills when
they create contour maps.
In
some instances, the addition of geologic interpre-
tation to the raw data contained in the observation points is a valuable enhance-
ment of the map. Sometimes, however, geologic judgment becomes biased, and the
subtle effects of personal opinion detract rather than add to the utility of a map.
Computer contouring is totally consistent and provides a counterbalance to overly
interpretative traditional mapping.
Of
course, subjective judgment
is
necessary in
choosing
an
algorithm to perform mapping, but methods are available that allow
a choice to be made between competing algorithms, based upon specified criteria.
The principal motive behind the development of automatic contouring
is
economic,
an
attempt to utilize the petroleum industry’s vast investment in stratigraphic data
banks.
Aside from this, one of the prime benefits of computerized mapping tech-
niques may come from the attention they focus on the contouring process and the
problems they reveal about map reliability. Contour mapping
is
the subject of one
section in this chapter.
Trend-surface analysis is a popular numerical technique in geology. However,
although it is widely applied, it is frequently misused. Therefore, we will discuss
294
Spat
ia
I
Ana
I
ysis
the problems of data-point distribution, lack of fit, computational “blowup,” and
inappropriate applications. Statistical tests are available for trend surfaces if they
are to be used as multiple regressions; we will consider these tests and the assump-
tions prerequisite to their application.
The exchange between Earth scientists and statisticians has been mostly one
way, with the notable exception of the expansion of the theory of regionalized vari-
ables.
This
theory, developed originally by Georges Matheron, a French mining
engineer, describes the statistical behavior of spatial properties that are interme-
diate between purely random and completely deterministic phenomena. The most
familiar application of the theory is
in
kriging,
an
estimation procedure important
in mine evaluation, mapping, and other applications where values of a property
must be estimated at specific geographic locations.
Two-dimensional methods are, for the most part, direct extensions of tech-
niques discussed in Chapter
4.
Trend-surface analysis is an offshoot of statistical
regression; kriging is related to time-series
analysis;
contouring is an extension
of interpolation procedures. We have simply enlarged the dimensionality of the
subjects of our inquiries by considering a second (and in some cases a third) spa-
tial variable.
Of
course, there are some applications and some analytical meth-
ods that are unique to map analysis. Other methods are a subset of more general
multidimensional procedures.
It is
an
indication of the importance of one- and
two-dimensional problems in the Earth sciences that they have been included in
individual chapters.
Systematic Patterns
of
Search
Most geologists devote their professional careers to the process of searching for
something hidden.
Usually the object of the search is an undiscovered oil field
or an ore body, but for some it may be a flaw in a casting, a primate fossil in
an
excavation, or a thermal spring on the ocean’s floor. Too often the search has
been conducted haphazardly-the geologist wanders at random across the area of
investigation like an old-time prospector following
his
burro. Increasingly, how-
ever, geologists and other Earth scientists are using systematic procedures to
search, particularly when they must rely on instruments to detect their targets.
Most systematic searches are conducted along one or more sets of parallel lines.
Ore bodies that are distinctively radioactive or magnetic are sought using airborne
instruments carried along equally spaced parallel flight lines. Seismic surveys are
laid out in regular sets of traverses. Satellite reconnaissance, by its very nature,
consists of parallel orbital tracks.
The probabilities that targets will be detected by a search along a set of lines
can be determined by geometrical considerations. Basically, the probability of
dis-
covery is related to the relative size of the target as compared to the spacing of
the search pattern.
The shape of the target and the arrangement of the lines of
search also influence the probability.
If
the target is assumed to be elliptical
and
the search consists of parallel lines, the probability that a line
will
intersect a hidden
target of specified size, regardless of where it occurs within the search area, can
be calculated. These assumptions do not seem unreasonable for many exploratory
surveys. Note that the probabilities relate only to intersecting a target with a line,
and do not consider the problem of recognizing a target when it is hit.
McCammon
(1977)
gives the derivation of the geometric probabilities for cir-
cular and linear targets and parallel-line searches.
His
work
is
based mostly on the
295
Statistics and Data Analysis in
Geology
-
Chapter
5
mathematical development of Kendall and Moran (1963).
An
older text by Uspensky
(1937)
derives the more general elliptical case used here.
Assume the target being sought is
an
ellipse whose dimensions
are
given by the
major semiaxis
u
and minor semiaxis
b.
(If
the target is circular, then
u
=
b
=
r,
the radius of the circle.) The search pattern consists of a series of parallel traverses
spaced a distance
D
apart
(Fig.
5-1
a).
The probability that a target (smaller than
the spacing between lines)
will
be intersected by a line
is
D
p=-
7TD
where
P
is the perimeter of the elliptical target. The equation for the perimeter of
an
ellipse is
P
=
27~dm,
where
u
and
b
are the major and minor semiaxes.
Substituting,
2TIpqz-
2JqF
(5.2)
- -
’=
~TD
D
We
can
define a quantity
Q
as the numerator
of
Equation
(5.2);
that
is,
Q
=
24(u*
+
b2)/2.
With this simplification, the probability of intersecting an elliptical
target with one line in a set of parallel search lines can be written as
p=-
Q
D
(5.3)
In
the specific case
of
a circular target,
u
and
b
are both equal to the radius,
so
Q
can be replaced by twice the radius:
2r
p=-
D
(5.4)
At the other extreme, one
axis
of the ellipse may be
so
short that the target
becomes a randomly oriented line. This geometric relationship is
known
as
Bwffon’s
problem,
which specifies the probability that a needle of length
8,
when dropped at
random on a set
of
ruled lines having a spacing
D,
will fall across one of the lines.
The probability
is
28
p=-
7TD
(5.5)
where
4?
is
the length of the target.
A
similar geometric relationship,
known
as
Laplace’s problem,
also
pertains to
the probabilities in systematic searches. Laplace’s problem specifies the probability
that a needle of length
8,
when dropped on a board covered with a set of rectangles,
will lie entirely within a single rectangle.
A
variant gives the probability that a coin
tossed onto a chessboard will fall entirely within one square.
In
exploration, the
complementary probabilities are of interest,
i.e.,
that a randomly located target
will
be intersected one or more times by a set of lines, such as seismic traverses,
arranged in a rectangular grid
(Fig.
5-1
b).
The general equation is
where
D1
is the spacing between one set of parallel seismic traverses and
DZ
is the
spacing between the perpendicular set of traverses. In the specific instance of a
296
Spat
ia
I
Ana
I
ysis
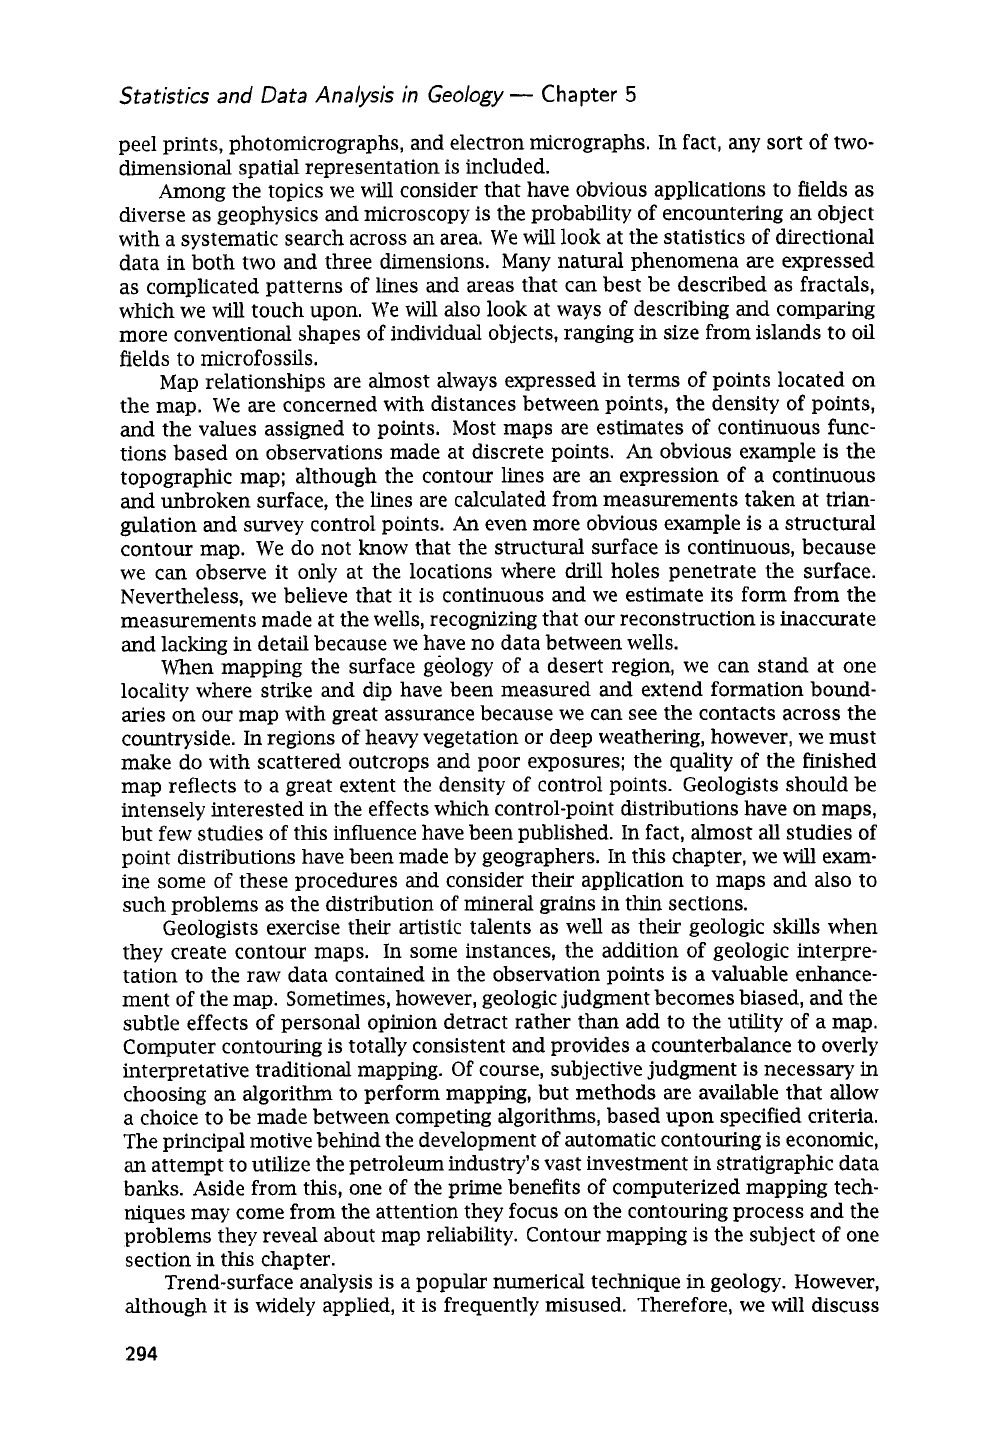
Figure
5-1.
Search for an elliptical target with major semiaxis
a
and minor semiaxis
b.
(a)
Using
a
parallel-line search of spacing
D.
(b)
Using
a
grid search with spacing
D1
in one direction and
Dz
in
the
perpendicular direction.
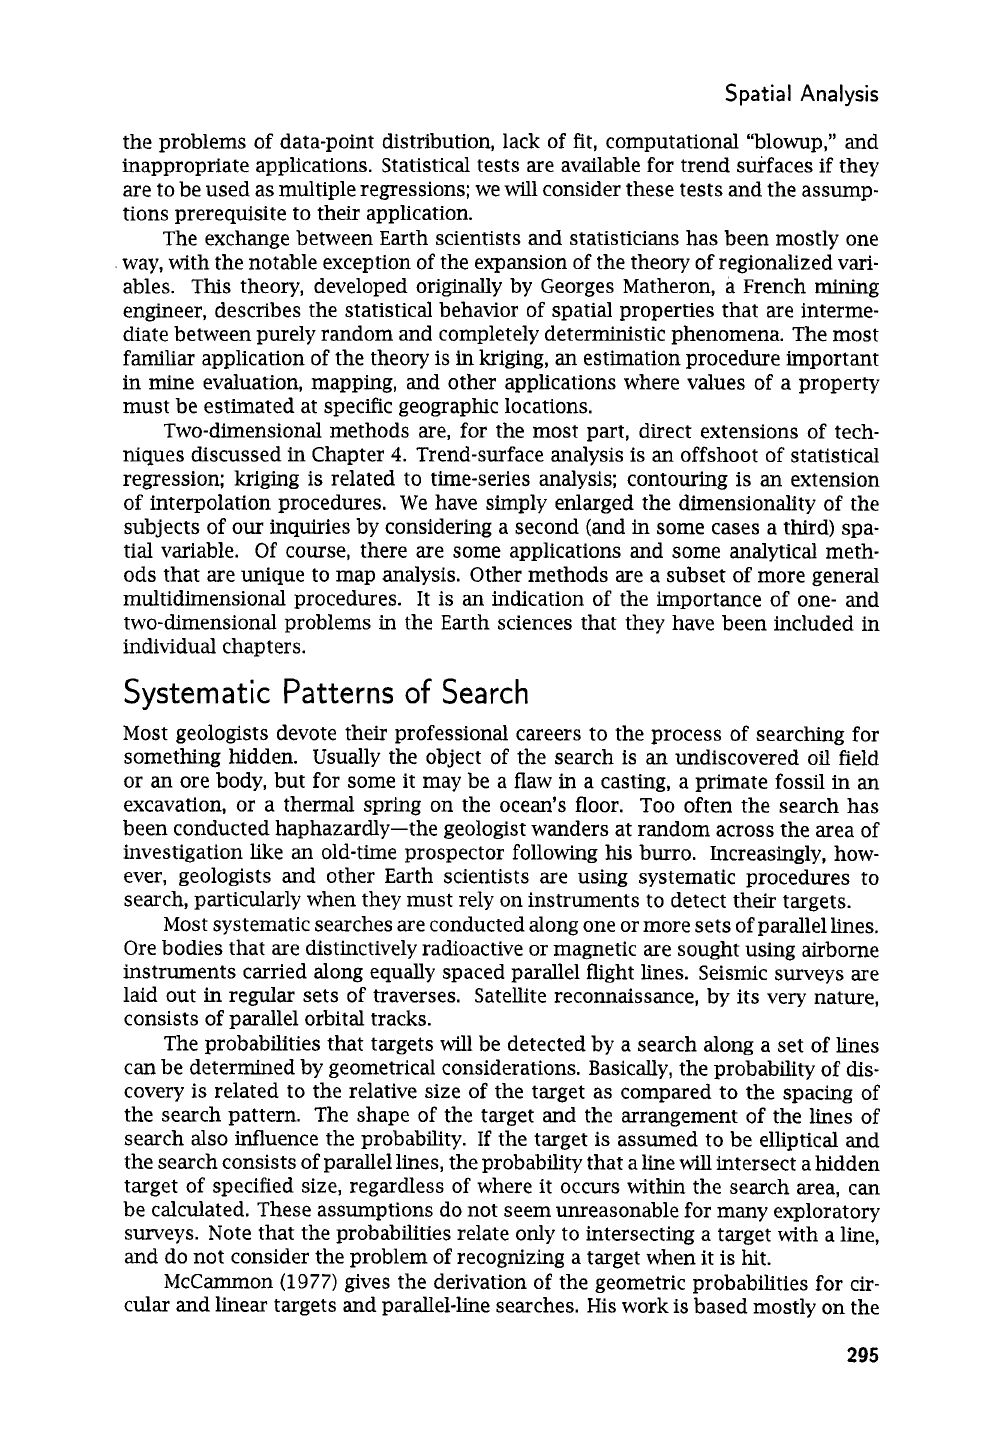
Figure
5-2.
Probability of intersecting
a
target with
a
systematic pattern of search. Shape
of target may range from
a
circle to
a
line; elliptical targets of various axial ratios
fall
in
the
shaded region. Horizontal axis
is
ratio (major dimension of target)/(spacing
between search lines).
(a)
Parallel-line search pattern.
(b)
Square-grid search pat-
tern. After McCammon
(1977).
297
Statistics and Data Analysis in Geology-
Chapter
5
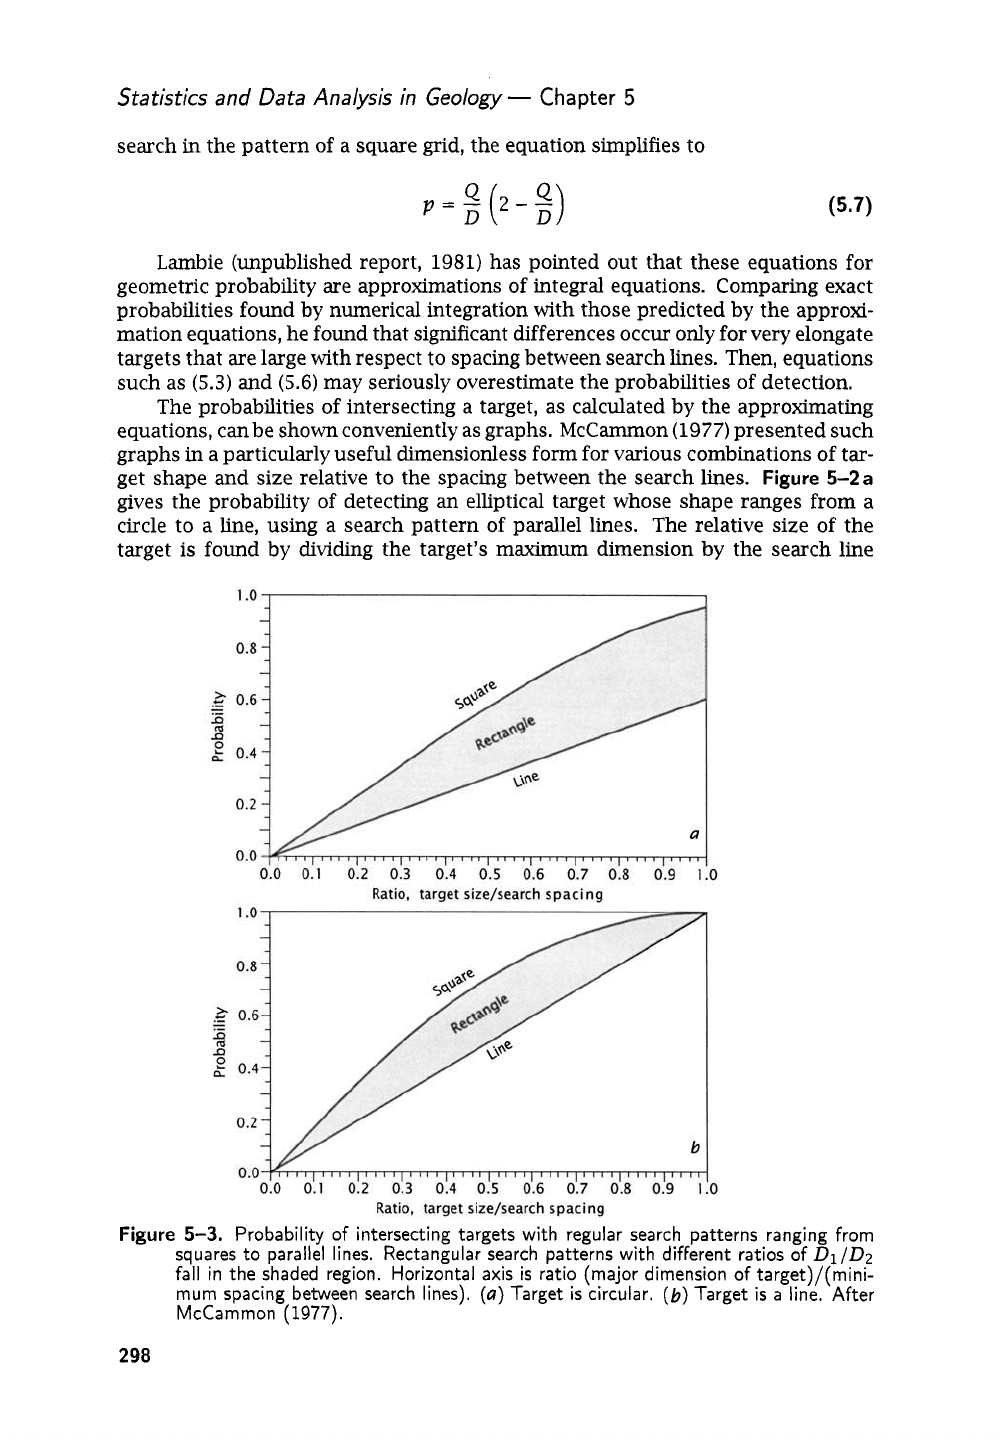
search in the pattern of a square grid, the equation simplifies to
Lambie (unpublished report,
1981)
has pointed out that these equations for
geometric probability are approximations of integral equations. Comparing exact
probabilities found by numerical integration with those predicted by the approxi-
mation equations, he found that significant differences occur only for very elongate
targets that are large with respect to spacing between search lines. Then, equations
such as
(5.3)
and
(5.6)
may seriously overestimate the probabilities of detection.
The probabilities of intersecting a target,
as
calculated by the approximating
equations, can be shown conveniently as graphs. McCammon
(1977)
presented such
graphs in a particularly useful dimensionless form for various combinations of tar-
get shape and size relative to the spacing between the search lines.
Figure
5-2a
gives the probability of detecting an elliptical target whose shape ranges from a
circle to a line, using a search pattern of parallel lines. The relative size of the
target is found by dividing the target's maximum dimension by the search line
Figure
5-3.
Probability of intersecting targets with regular search patterns ranging from
squares to parallel lines. Rectangular search patterns with different ratios of
D1
/D2
fall
in the shaded region. Horizontal axis
is
ratio fmaior dimension of targetl/fmini-
mum spacing betwe& search lines).
(a)
Target is'cir&lar,
(b)
Target
is
a"li<e.'After
McCammon
(1977).
Spa
tia
I
Analysis
spacing.
Figure
5-2
b
is an equivalent graph for a search pattern consisting of a
square grid of lines.
If
the shape of the target is specified, the probabilities of intersection can be
graphed for different patterns of search.
Figure
5-3
a,
for example, shows the prob-
ability of intersecting a circular target with search patterns ranging from a square
grid, through rectangular grid patterns, to a parallel-line search.
Figure
5-3
b
is
the equivalent graph for a line-shaped target. Between the two graphs, all possible
shapes of elliptical targets and all possible patterns of search along two perpendic-
ular sets of parallel lines are encompassed.
Distribution
of
Points
Geologists often are interested in the manner in which points are distributed on a
two-dimensional surface or a map. The points may represent sample localities, oil
wells, control points, or poles and projections on a stereonet. We may be concerned
about the uniformity of control-point coverage, the distribution of point density,
or the relation of one point to another. These are questions of intense interest to
geographers as well as geologists, and the burgeoning field of locational analysis
is devoted to these and similar problems. Although much of the attention of the
geographer is focused on the distribution of shopping malls or public facilities, the
methodologies are directly applicable to the study of natural phenomena as well.
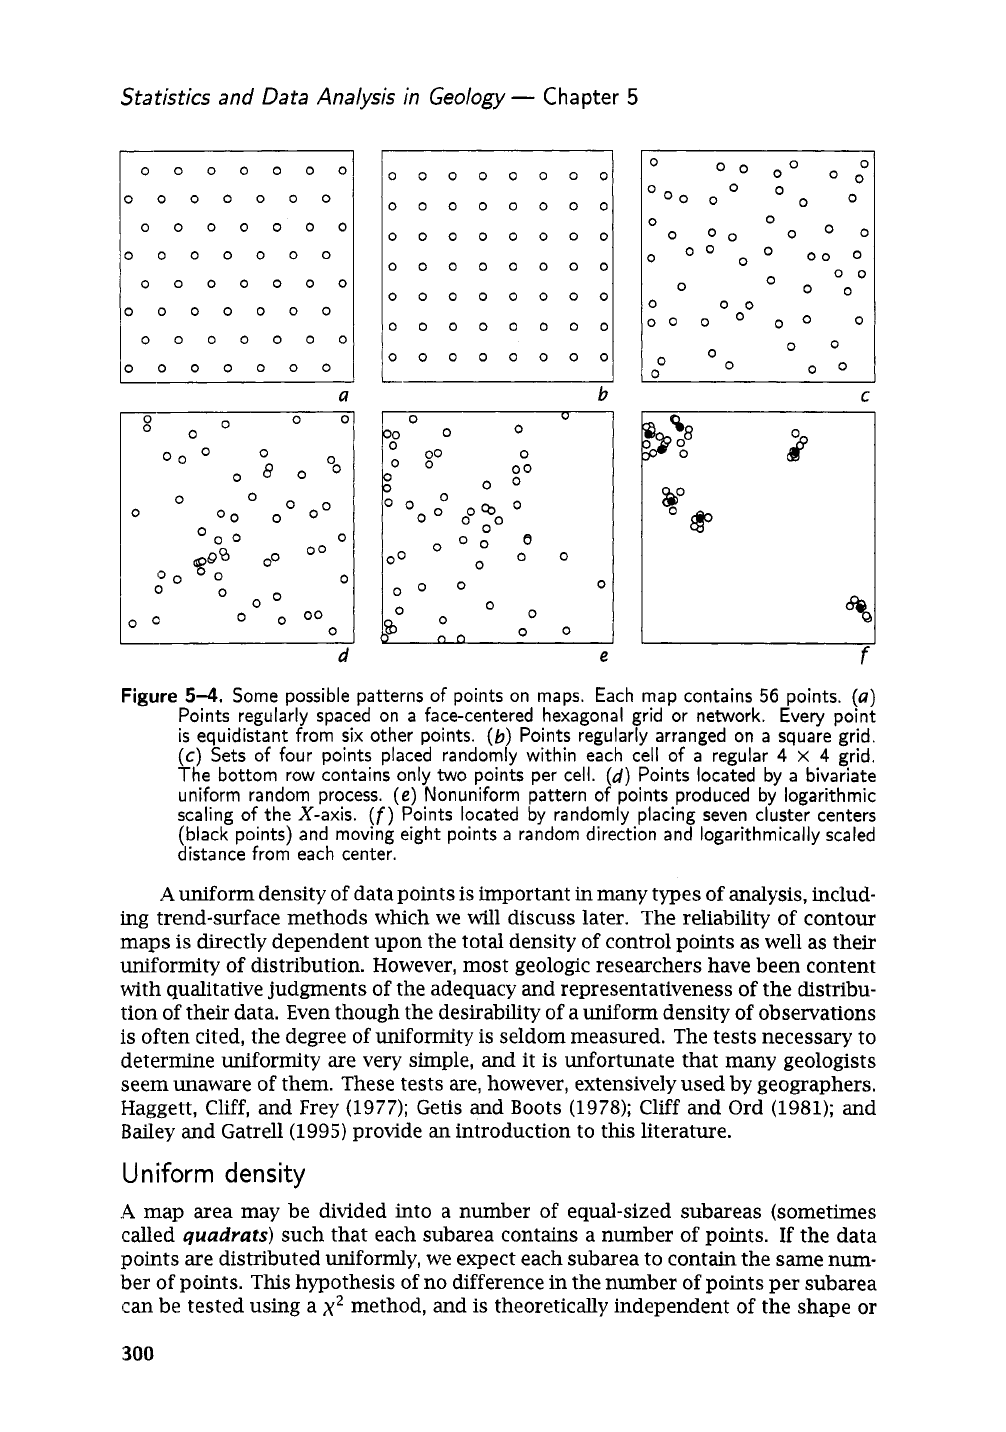
The patterns of points on maps may be conveniently classified into three
categories: regular, random, and aggregated or clustered. Examples of point
dis-
tributions are
shown
in
Figure
5-4
and range from the most uniform possible (the
face-centered hexagonal lattice in
Fig.
5-4a,
where every point is equidistant from
its
six
nearest neighbors) to a highly clustered pattern composed of randomly
lo-
cated centers around which the probability of occurrence of a point decreases
exponentially with distance
(Fig.
5-4f).
Of
course most maps
will
have patterns
intermediate between these extremes, and the problem becomes one of determin-
ing where the observed pattern lies within the spectrum of possible distributions.
For example, most people would intuitively regard the distribution of points
in
Figure
5-4
c
as random. However, intuition
is
wrong, because the map was created
by dividing the map area into a
4
x
4
array of regular cells and then placing four
points at random within each cell (except
in
the shortened bottom row, which re-
ceived only two points per cell). The distribution therefore has both random and
regular aspects and is more uniform in density than a purely random arrangement
such as
Figure
5-4d.
The pattern of points on a map
is
said to be
uniform
if
the density of points
in
any subarea is equal to the density of points in all other subareas of the same
size and shape. The pattern is
regular
if the spacings between points repeat, as
on a grid. That
is,
the distance between a point
i
and another point
j
lying in some
specified direction from
i
is the same for all pairs of points
i
and
j
on the map.
Obviously, a regular pattern also will be uniform, but the converse
is
not necessarily
true.
A
random
pattern can be created if any subarea is as likely to contain a point
as
any
other subarea of the same size, regardless of the subarea’s location, and the
placement of a point has no influence on the placement of any other point.
In
an
aggregated or
clustered
pattern, the probability of occurrence of a point varies in
some inverse manner with distances to preexisting points.
299
Statistics and Data Analysis in
Geology
-
Chapter
5
00000000
00000000
00000000
0000000
0000000
0000000
0000000
0000000
0000000
0000000
0000000
I
U
0
00
0
0
O0
0
00
0
OOO
00
oooo
oo
0
-
0
00
O
oo
0000000
0 0
oo
O
,"I
0
0
0
0 0 0 0
OI
0
IiOo
oo
0
00
00000000
I
loo
00
O
0
0
01
0
0
0
0 0
0
0
01
jo
oo
ooo0
1
0
-
b
C
d
e
Figure
5-4.
Some possible patterns of points on maps. Each map contains
56
points.
(a)
Points regularly spaced
on
a
face-centered hexagonal grid or network. Every point
is
equidistant from six other points.
(b)
Points regularly arranged on
a
square grid.
(c)
Sets of four points placed randomly within each cell of
a
regular
4
x
4
grid.
The
bottom row contains only two points per cell.
(d)
Points located
by
a
bivariate
uniform random process.
(e)
Nonuniform pattern of points produced by logarithmic
scaling of
the
X-axis.
(f)
Points located by randomly placing seven cluster centers
(black points) and moving eight points
a
random direction and logarithmically scaled
distance from each center.
A
uniform density of data points is important in many types of analysis, includ-
ing trend-surface methods which we will discuss later. The reliability of contour
maps is directly dependent upon the total density of control points as well as their
uniformity of distribution. However, most geologic researchers have been content
with qualitative judgments of the adequacy and representativeness of the distribu-
tion of their data. Even though the desirability of a uniform density of observations
is
often cited, the degree of uniformity
is
seldom measured. The tests necessary to
determine uniformity are very simple, and it
is
unfortunate that many geologists
seem unaware of them. These tests are, however, extensively used by geographers.
Haggett, Cliff, and Frey (1977); Getis and Boots (1978); Cliff and Ord (1981); and
Bailey and Gatrell(l995) provide an introduction to this literature.
Uniform
density
.A
map area may be divided into a number of equal-sized subareas (sometimes
called
quadrats)
such that each subarea contains a number of points.
If
the data
points are distributed uniformly, we expect each subarea to contain the same num-
ber
of
points. This hypothesis of no difference in the number
of
points per subarea
(:an be tested using a
x2
method, and
is
theoretically independent of the shape or
300
Spatial
Analysis
0
0
00
0
00
0
5
4
OO
00
0
0
(1
0
U
0
10
0
C
%
15-
L
-
0
z
I
oc
I
"
0%
mo
00
00
00
0
0"
0
0
0000
00
0 0
0
0
0
00
30
0
0
0
254
0
0
oo
O
U
15
20
0
000 0
m
U
0
0
0
O;I
0
0
00
b
0
b
25
30 35
40
Easting
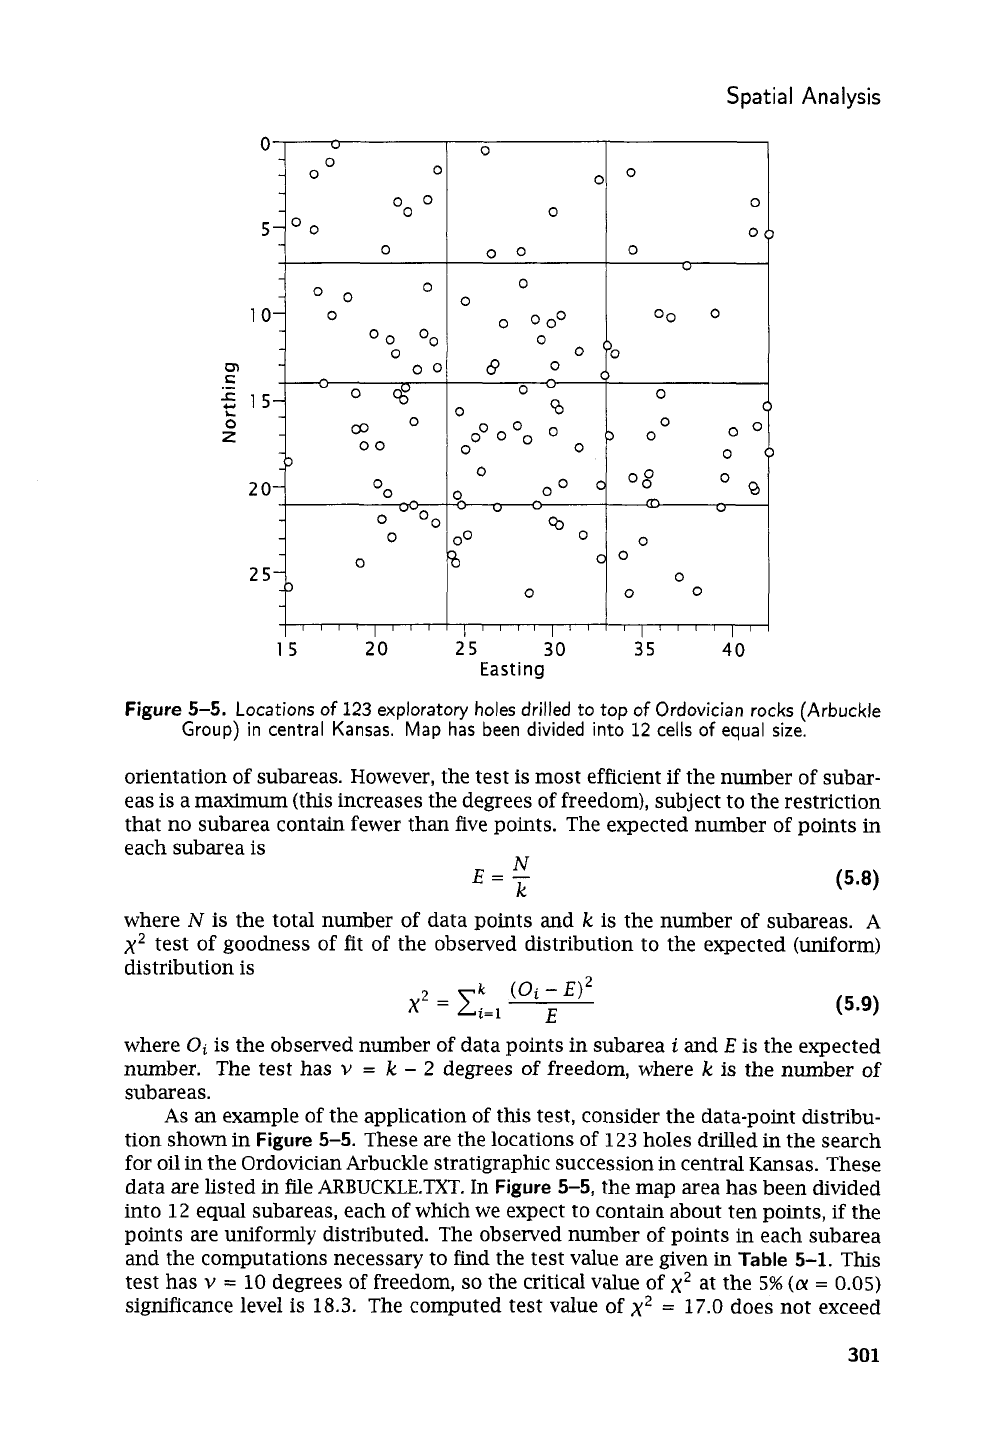
Figure
5-5.
Locations
of
123
exploratory holes drilled to top
of
Ordovician rocks (Arbuckle
Group) in central Kansas. Map has been divided into
12
cells
of
equal size.
orientation of subareas. However, the test is most efficient
if
the number of subar-
eas is a maximum (this increases the degrees of freedom), subject to the restriction
that no subarea contain fewer than five points. The expected number of points in
each subarea
is
N
k
(5.8)
E=-
where
N
is
the total number of data points and
k
is
the number of subareas.
A
x2
test of goodness of fit of the observed distribution to the expected (uniform)
distribution
is
where
Oi
is
the observed number of data points in subarea
i
and
E
is the expected
number. The test has
v
=
k
-
2
degrees
of
freedom, where
k
is
the number
of
subareas.
As
an
example of the application of this test, consider the data-point distribu-
tion shown in
Figure
5-5.
These are the locations of
123
holes drilled in the search
for oil in the Ordovician Arbuckle stratigraphic succession in central Kansas. These
data are listed in file ARBUCKLE.TXT. In
Figure
5-5,
the map area has been divided
into
12
equal subareas, each of which we expect to contain about ten points,
if
the
points are uniformly distributed. The observed number of points
in
each subarea
and the computations necessary to find the test value are given in
Table
5-1.
This
test has
v
=
10
degrees of freedom,
so
the critical value of
x2
at the
5%
(a
=
0.05)
significance level
is
18.3.
The computed test value of
x2
=
17.0
does not exceed
301
Statistics and Data Analysis in Geology
-
Chapter
5
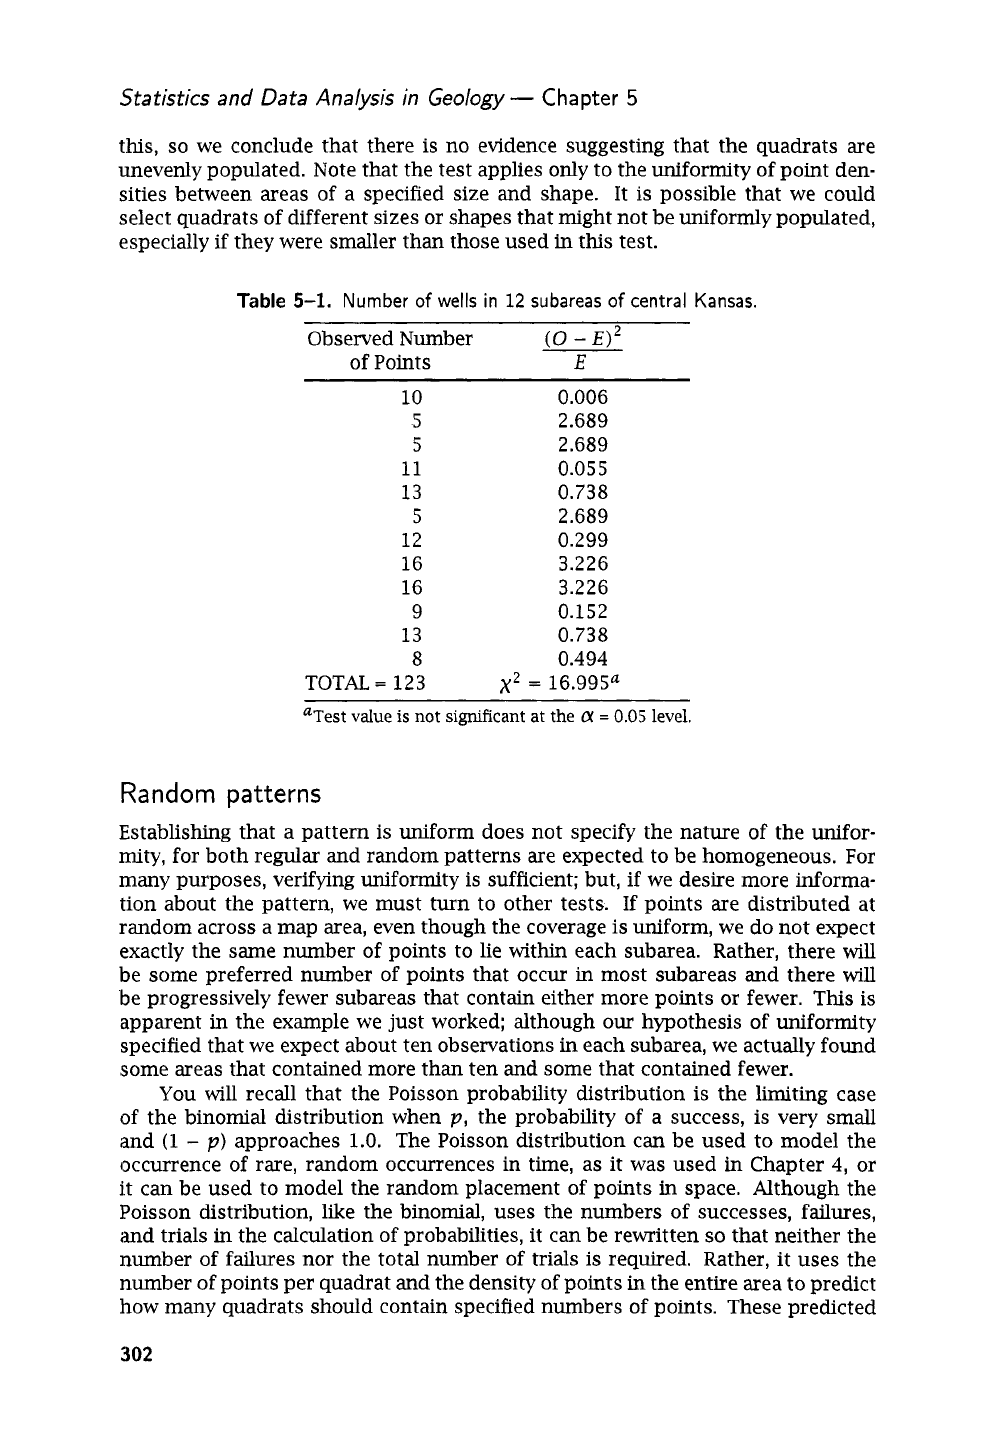
this,
so
we conclude that there is no evidence suggesting that the quadrats are
unevenly populated. Note that the test applies only to the uniformity of point den-
sities between areas of a specified size and shape. It is possible that we could
select quadrats of different sizes or shapes that might not be uniformly populated,
especially if they were smaller than those used
in
this test.
Table
5-1.
Number
of
wells
in
12
subareas
of
central Kansas.
Observed Number
(0
-
E)*
of Points
E
10
0.006
5
2.689
5
2.689
11
0.055
13
0.738
5
2.689
12
0.299
16 3.226
16 3.226
9 0.152
13
0.738
8
0.494
TOTAL
=
123
aTest value
is
not significant at the
a
=
0.05
level.
x2
=
16.995"
Random
patterns
Establishing that a pattern is uniform does not specify the nature of the unifor-
mity, for both regular and random patterns are expected to be homogeneous. For
many purposes, verifying uniformity is sufficient; but, if we desire more informa-
tion about the pattern, we must turn to other tests.
If
points are distributed at
random across a map area, even though the coverage is uniform, we do not expect
exactly the same number of points to lie within each subarea. Rather, there
will
be some preferred number
of
points that occur in most subareas and there
will
be progressively fewer subareas that contain either more points or fewer. This is
apparent
in
the example we just worked: although
our
hypothesis of uniformity
specified that we expect about ten observations in each subarea, we actually found
some areas that contained more than ten and some that contained fewer.
You will recall that the Poisson probability distribution
is
the limiting case
of the binomial distribution when
p,
the probability of a success, is very small
and
(1
-
p)
approaches
1.0.
The Poisson distribution can be used to model the
occurrence of rare, random occurrences in time, as it was used
in
Chapter
4,
or
it can be used to model the random placement of points
in
space. Although the
Poisson distribution, like the binomial, uses the numbers of successes, failures,
and trials
in
the calculation of probabilities, it can be rewritten
so
that neither the
number of failures nor the total number of trials is required. Rather, it uses the
number of points per quadrat and the density of points
in
the entire area to predict
how many quadrats should contain specified numbers of points. These predicted
302
Spat
ia
I
An
a
I
ysis
or expected numbers of quadrats can be used in a
x2
procedure to test whether the
points are distributed at random within the area.
As
an application, we
can
determine if oil discoveries in a basin occur at ran-
dom or are distributed in some other fashion. It
is
not intuitively obvious that the
Poisson distribution
can
be expressed in a form appropriate for this problem,
so
we will work through its development.
Assume a basin has an area,
a,
in which
m
discovery wells are randomly lo-
cated. The
density
of discovery wells in the basin is designated
A,
and is simply
712
A=-
a
(5.10)
The basin may be divided into small lease tracts, each of area
A
(here the term “tract”
is
equivalent to “quadrat”). In turn, each tract may be divided into
n
extremely
small, equal-sized subareas which we might regard as potential drilling sites. The
probability that any one of these extremely small subareas contains a discovery
well tends toward zero as
n
becomes infinitely large.
The area
of
each drilling site is
Aln.
The probability that a site contains a
discoverv well is
and the probability that it does not contain a discovery well is
1-p=
1-A-
(
3
We
wish
to investigate the probability that
Y
of
the
n
drilling sites within a
tract contain discovery wells, and
n
-
Y
drilling sites do not. The probability of a
specific combination of discovery and nondiscovery well sites within a tract
is
P
=
(A;)r
(1
-
A;).-.
However, within a tract, there are
(:)
combinations of the
n
drilling sites, of which
Y
contain discovery wells and all are equally probable. The probability that a tract
will contain exactly
Y
discovery wells is therefore
P
(Y)
=
(;)
(A:)r
(1
-
A:).-.
Note that this
is
simply the binomial probability
of
Y
discovery wells on
n
drilling
sites.
The combinations can be expanded into factorials,
n(n
-
1)
(n-
2)
*.
.
(n-Y
+
1)
(AA)’
AA
P(Y)
=
r
!
nr
Rearranging and canceling terms yields
P
(Y)
=
(1
-
i)
(1
-
f)
...
(1
-
G)
(1
-
q)
AA
-‘
[(I
-
--)
AA
71
(AA)‘
(5.11)
303