Cotton W.R., Pielke R.A. Human Impacts on Weather and Climate
Подождите немного. Документ загружается.

Scientific basis of the nuclear winter hypothesis 209
Just because such particles are embedded in cloud droplets does not mean they
will be removed from the atmosphere. Many cloud droplets remain small and
will eventually evaporate releasing the embedded particles back into the atmo-
sphere. During their brief residence in the cloud droplets, the aerosol particles
may partially dissolve, undergo wet chemical reactions, and coagulate with other
embedded particles. Thus while the particles may be released back into the atmo-
sphere when the droplets evaporate, they probably have changed both in size
and chemical composition. Some of the droplets containing embedded aerosol
will participate in the formation of raindrops. Most of those aerosol particles
will rain out to the ground and no longer play a role in electromagnetic radi-
ation attenuation. The fraction of aerosol actually rained out is proportional to
the precipitation efficiency of the clouds. Precipitation efficiencies vary widely
among cloud types ranging from 10% to more than 90%. Fire-triggered clouds
having very intense updrafts such as in some model calculations may exhibit
precipitation efficiencies that are very low, similar to supercell thunderstorms
(∼10%), whereas if cloud updrafts are weaker, the longer time available in
the updrafts favors higher precipitation efficiencies, probably closer to 70-80%.
Because the bulk of the fire-producing clouds are probably in the weaker updraft
categories, precipitation efficiencies are probably on the higher side, greater
than 50%.
In addition to nucleation scavenging, some remaining particles are directly scav-
enged by cloud droplets and raindrops. The small aerosol particles that are most
likely to attenuate sunlight appreciably are susceptible to scavenging by Brownian
diffusion and phoretic scavenging (see Pruppacher and Klett, 1978; Cotton and
Anthes, 1989). These processes are relatively slow and probably account for
less than 10% of the total removal of small particles. Again, once embedded in
droplets, their ultimate fate is determined by the precipitation efficiency of the
clouds. Larger aerosol particles are readily scavenged by hydrodynamic capture
(see Pruppacher and Klett, 1978) by raindrops. The very large (greater than a
few tens of micrometers) non-hygroscopic smoke particles will be capable of
colliding with cloud droplets or raindrops thereby becoming large drops and
then being rained out as they participate in the precipitation process. Such large
particles probably contribute to the “black rains” seen in major urban fires fol-
lowing nuclear bombardment (MacCracken and Chang, 1975; National Academy
of Sciences, 1975; Whitten et al., 1975), and such “black rains” were also seen
in Basra, Iraq, downwind of the oil fires in Kuwait according to news reports.
TTAPS originally estimated that 25% to 50% of the bulk smoke mass in a large-
scale war scenario would be scavenged immediately and subsequently, Turco
et al. (1990) downgraded this estimate to 10% to 25%. In our opinion, the original
210 Nuclear winter
TTAPS estimate is probably an underestimate, with 50% to 60% being more
likely.
10.2.5 Water injection and mesoscale responses
As seen in the above discussion, major nuclear-triggered fires would not only
produce the vertical transport of smoke but also the vertical transport of water
substance. The source of the water substance transported upward over the fires
arises directly from the combustion process and from the low-level convergence
of air feeding the fires. Of the fuel that is burned, particularly wood fuels, roughly
10% of the burned mass is water vapor, whereas the amount of submicron-sized
smoke that can effectively absorb sunlight comprises less than 1% of the smoke
mass (e.g., Cotton, 1985). The combustion process, however, is not the major
source of water transported aloft by fires. Feeding the fires and the rising hot
gases is low-level convergence of ambient air. In the summer months (which we
shall show is the crucial period for major climatic consequences), surface mixing
ratios of water vapor range from 15-20 g kg
−1
in the semi-tropics and tropical
coastal areas, to as low as 8-10 g kg
−1
in the continental interiors. Even in the
driest desert regions, in summer, surface vapor mixing ratios rarely go below 5 g
kg
−1
. As the air converging in the fires rises in the buoyant updrafts, it mixes with
the moist, fire exhaust-product air as well as drier ambient air at higher levels.
Moreover, the rising air column cools nearly adiabatically raising the relative
humidity to over 100% where a cloud forms. Eventually some moisture is lost by
being precipitated out of the cloud and as a consequence of mixing with drier,
high-level air. Nonetheless, the air that is detrained out of the rising fire plumes in
the middle and upper troposphere is considerably more moist than the surrounding
environmental air.
Ambient water vapor mixing ratios at heights of 8–10 km in the atmosphere are
typically less than 1 g kg
−1
and so also are saturation values, so that only small
additions of water vapor are needed to produce persistent clouds (see discussion
in Section 4.2 on contrails).
Turco et al. (1990) conclude that the total mass of water injected over a
hemisphere would perturb ambient water vapor concentrations by at most a few
percent and therefore have little effect. They argue that the clouds formed by the
fire injections would eventually be warmed by smoke injections and thereby be
dissipated. We must remember, however, that the smoke and water substance are
simultaneously injected into the atmosphere and with the exception of precipitation
removal, they will remain colocated in the atmosphere for an extensive period.
Moreover, water vapor in the upper atmosphere is a trace gas that requires only
small additions to become saturated to form clouds. An example are jet contrails,
Scientific basis of the nuclear winter hypothesis 211
which as we saw in Chapter 4, can lead to persistent cloud cover. The moisture
released by jet contrails are many orders of magnitudes less than the expected
bulk moisture amounts injected into the middle and upper troposphere by nuclear
bomb produced fire plumes. As a result we anticipate that associated with the
widespread smoke release would be persistent cirrus and altostratus cloud decks
which will substantially alter the radiation balance. We examine its potential
consequences next.
Several investigators began preliminary investigations of the mesoscale
responses to smoke and moisture emissions by intense urban fires (Golding et al.,
1986; Giorgi and Visconti, 1989). Depending on the amount of moisture emitted
with the smoke, middle and upper tropospheric clouds formed in their simulations
over broad areas (patches greater than 50 km or more) either in the smoke core
or at the peripheries of the smoke plumes.
Cotton et al. (personal communication), for example, examined the mesoscale
responses to just a dry smoke plume introduced into the upper troposphere. The
emitted smoke amounts were based on the amounts of smoke detrained from
a single simulated smoke plume using a three-dimensional cloud model (e.g.,
Tripoli, 1986), but no moisture was added to the atmosphere by the fires. They
found that the model responded to solar heating of the smoke plume by causing
lofting of the plume and a sea-breeze-like circulation in the upper troposphere at
the boundaries of the plume. This sea-breeze-like circulation caused the formation
of a cirrus-like ice cloud in the rising air entering the base of the smoke plume
whenever the ambient relative humidity exceeded 70% relative to water. Thus,
in spite of the fact that the heated air in the smoke plume lowered the relative
humidity, the ascent of unheated air by the sea-breeze-like, solenoidal circulation
triggered ice and liquid cloud formation. Moreover the ice cloud persisted owing
to the lower saturation vapor pressures with respect to ice relative to liquid water.
They calculated that the persistent ice cloud absorbed the upwelling terrestrial
radiation, causing a greenhouse warming effect, particularly at night. Thus while
a simulation with a dry smoke cloud (i.e., no cloud was allowed to form in
the rising air column) produced average surface temperatures 6 K cooler than
the no-smoke simulation after 24 hours, the case with an ice cloud was only
1.4 K cooler than the no-smoke control experiment. This illustrates the potential
moderating influence of cloud formation associated with ascent of a smoke plume
in the middle and upper troposphere. Because the smoke plumes that rise into the
middle and upper troposphere would bring with them large quantities of water
substance (relative to what naturally resides at those levels, but not necessarily in
absolute values relative to surface moisture values), the moisture and mesoscale
circulations associated with the smoke plumes would likely produce extensive
stratiform cloud cover which could persist for periods of weeks or more in direct
212 Nuclear winter
association with the smoke plume. The moderating influence of the fire-induced
cloud would delay the onset of strong surface cooling during the phase that
the smoke cloud is most concentrated. If the fire-induced cloud is sufficiently
optically thick, it could reflect so much solar radiation that it would create a
positive feedback to the smoke-induced cooling. Eventually much of the liquid
and ice cloud will precipitate out of the atmosphere (faster than the sedimentation
of the smoke). The question remains will the persistent cloud be present long
enough to allow diffusion of the smoke concentrations to such small magnitudes
that only small surface cooling will occur?
In the absence of any cloud responses, Haberle et al. (1985), for example,
predicted that the solar heated smoke would be lofted into the stratosphere where
it could reside for periods of months or more. We shall show that GCMs simu-
lated similar responses in the absence of any cloud feedbacks. Such behavior of
cloud lofting to higher levels, however, did not occur with the Kuwaiti oil fire
plumes, even in clear skies, as a result of the strong thermodynamic stability in
the midtroposphere. The presence of water clouds provides an additional interac-
tion with the smoke. Clearly, an assessment of cloud feedbacks is important to
understanding the ultimate climatic responses to large-scale nuclear warfare. We
shall see that a better understanding of cloud feedbacks is important to evaluating
any potential impacts of human behavior on climate.
10.2.6 Other mesoscale responses
Atmospheric responses to smoke and water substance injections as a consequence
of nuclear warfare on scales of a few hundred kilometers to a few thousand
kilometers (the mesoscale) is important in determining the ultimate fate of the
the smoke and soot. Global climate models begin with a uniform layer of smoke
introduced into the middle and upper troposphere and lower stratosphere. The
actual smoke injections initially would be in discrete plumes originating from the
fires over individual targets. Will the plumes remain in relatively narrow corridors
and not become widely distributed as is assumed in the larger-scale models?
Pielke and Uliasz (1993) have shown that dispersion is substantially enhanced
due to spatial variations in surface heating as a result of temporal and spatial
variations of turbulence and the generation of coherent mesoscale circulations. A
similar response would be expected to occur associated with mesoscale patches
of heating within the atmosphere. Even without mesoscale forcing, the results of
McNider et al. (1988) suggest that vertical shear of the horizontal wind in the free
atmosphere will significantly enhance dispersion from what is normally simulated
in larger-scale models. If they do merge and diffuse into a relatively uniform pall,
Scientific basis of the nuclear winter hypothesis 213
will this dispersion take so long that the smoke concentrations have diminished
below levels for any significant solar heating responses?
It is possible that the consequences of such large-scale warfare would result in
only mesoscale and regional responses with no longer-term global effects. One can
speculate on a number of other potential mesoscale responses to smoke and water
substance emissions. For example, patchy surface heating related to attenuation of
solar energy by the smoke and cloud plumes can generate low-level, sea-breeze-
like solenoidal circulations that can trigger deep convective clouds and rainfall.
In fact the triggered clouds could not only produce severe weather but penetrate
into the elevated plume, scavenging the smoke plumes that have spawned them.
The patchy surface heating can modify natural physiographically-driven circu-
lations (i.e., coastal sea breezes, mountain slope flows, circulations driven by dif-
ferential surface heating such as described in Part II), strengthening them in some
cases, and weakening in others. The patchy surface heating can also alter weak
synoptic-scale fronts causing those beneath the smoke/cloud cover to penetrate
further equatorward during the daytime and possibly less equatorward at night.
These are just a few examples of potential mesoscale and regional scale
responses to smoke and water substance injections by large-scale nuclear warfare.
10.2.7 Global climatic responses
The estimates of the global climatic responses to smoke injections during large-
scale nuclear warfare are normally considered in two stages: an acute stage lasting
a month or so and a chronic stage lasting several months or more. The global
models used to calculate potential climatic impacts normally begin with the smoke
being uniformly distributed through the Northern Hemisphere with a specified
vertical distribution, and a concentration that varies with the particular war sce-
nario. The first model calculations were done by TTAPS with a one-dimensional
radiative–convective model, followed by the application of longitudinally aver-
aged two-dimensional models (e.g., Cess et al., 1985), and a number of GCMs
of varying complexity.
The acute phase
The original TTAPS one-dimensional model calculations suggested that maximum
summertime decreases in surface temperatures would be as large as 35
C. The
summer months are believed to experience the greatest cooling because too little
radiation is present in the winter months to be appreciably diminished in intensity
by the presence of the smoke. In addition, during summer the reduction of pho-
tosynthetically active radiation by smoke for a sufficiently long period of time
below the threshold required by vegetation to sustain their metabolic processes
214 Nuclear winter
Residual
smoke fraction
Hemispherical-
average
absorption
optical depth
Temperature relative
to freezing (
°C)
Turco et al. (1983) 1 AROSH
MacCracken (1983) 2PRG
Aleksandrov and Stenchikov
(1983) 3AO
Covey et al. (1983) 3
Crutzen et al. (1984) AROSH
MacCracken and Walton (1984) 3PII
Robock (1984) 2E
Thompson (1985) 3PI
Malone et al. (1985) 3PIR
Ramaswamy and Klehi (1985) 1ASH
Covey et al. (1985) 3
Cess et al. (1985) 3S
Stenchikov and Carl (1985) 3APIO
Covey (1985)
31
Vupputurl (1986) 1ARSH
Thompson and Schneider
(1986) 3PIROSH
Covey (1987) 30
Mltchell and Sllngo (1988) 3GD
Thompson et al. (1987) 3PIROSH
Glorgl and Viscontl (1988) 2PIRGD
Ghan et al. (1988) 3PIROSHGD
Glatzmaler and Malone
(1988) 3PIRHGD
M
M
M
M
M
M
M
M
M
M
M
M
M
M
M
W
W
W
W
W
W
W
M
W
W
W
M
D
D
+
D
+
D
+
D
+
DD
+
D
+
D
+
D
+
D
D
o
D
o
D
o
D
o
D
o
D
D
o
D
o
DD
+
DD
+
D
o
8
8
8
8
8
8
8
W
W
1
3 45678910
21
1121
3 14 15 16 17 18 19 20 21 22 23
24
0
1.0
0.5
0
5
0
1
2
3
4
–20
–15
–10
–5
+5
+10
+15
0
10
7
7
1
4
1
1
7
7
7
4
7
7
7
7
7
7
7
7
7
7
7
7
4
4
1
1
1
Smoke injection
centroid (km)
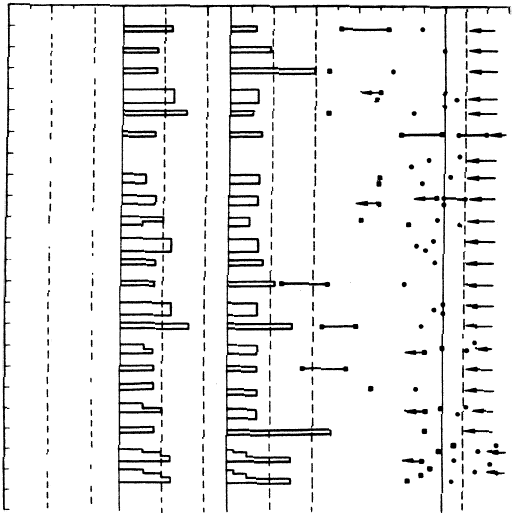
Figure 10.1 Summary of nuclear winter climate model calculations. Data
shown for the following: (i) (•) Average land temperatures (coastal plus inland)
in regions beneath widespread smoke layers for the coldest 1- to 2-week period
in the simulation (some of the references report only temperature changes; the
absolute temperatures have been deduced by subtracting the computed average
temperature decrease from the temperature offset given below for each season);
the month of the simulation is indicated by a numeral; for the one-dimensional
radiative and convective models, the average land temperature decreases are
taken as one-half of the “all-land” temperature decreases to account for the
effect of ocean moderation; annual average solar insolation also applies in
these cases. (ii) The box represents minimum land temperatures beneath smoke
during the acute phase of nuclear winter simulations (again, where necessary,
absolute temperatures were obtained by subtracting decreases from offsets);
these temperatures are averaged over at least 1 day. (iii) Hemispheric average
absorption optical depth of the smoke injection. (iv) Height centroid of the
smoke mass injection. (v) Residual smoke fractions at several times in each
simulation. The selected calculations roughly correspond to recommended
baseline smoke injection scenarios; less severe and more severe cases have been
investigated, but not as frequently as baseline cases. The studies have been
ordered from left to right roughly in chronological sequence and are numbered
along the bottom of the figure. For a given study, several cases may be illustrated
(for example, the Ramaswamy and Kiehl (1985) results are shown for two
smoke-injection profiles). The data are organized vertically for each simulation.
Scientific basis of the nuclear winter hypothesis 215
can result in the death of the plants. Sagan (1983) speculated that if the smoke
concentrations exceeded a critical level, catastrophic changes in climate would
occur. This speculation has not been supported by the more sophisticated model
calculations. As more realistic physics was added to the models, the magnitude
of predicted cooling diminished appreciably from the original TTAPS estimates.
Some of the more important improvements included the allowance for smoke to
be transported vertically and horizontally, the inclusion of vertical heat transports
from ocean surfaces, and better estimates of scavenging and removal. Vertical
transport of the heated smoke, for example, created a lofted stable plume of smoke
that formed a very stable layer of air aloft much like the natural stratosphere but
with its base much lower at ∼ 5km (Malone et al., 1986). The strength of that
simulated response is only realistic if middle- and high-level clouds do not form
in association with the lofted layer.
The inclusion of vertical heat transports from the ocean surface plays a major
role in moderating the strength of surface cooling particularly in coastal areas
(Schneider and Thompson, 1988). For the National Research Council baseline
smoke injection scenario, they calculated maximum summertime, Northern Hemi-
sphere, land surface temperature changes of 5−15
C, or less than half the original
TTAPS estimates. Some short-term sporadic cooling events were still evident in
their single realization. Because of the moderation in their simulated responses
to the introduction of the smoke, they referred to the phenomena as nuclear fall
rather than nuclear winter. Figure 10.1 illustrates that the amplitude of predicted
temperature changes for baseline war scenarios diminished appreciably over the
seven short years of nuclear winter research.
Several of the models simulate dramatic changes in precipitation in tropical
latitudes during the acute phase (Ghan et al., 1988). Sharp drops in precipitation
are associated with weakening of major tropical circulation features such as the
Asian monsoon. The actual magnitudes of the reduction in rainfall should not
Caption for Figure 10.1 (cont.). The temperature offset used: 0
C, winter;
13
C annual, fall, and spring; 25
C, summer; and 35
C for cases calculated
by Lawrence Livermore National Laboratories. The model treatments: 1, 2, and
3 indicate dimensions; A, annual solar insolation; P, patchy smoke injection; I,
interactive transport; R, removal by precipitation; O, optical properties evolve; S,
scattering included; H, infrared-active smoke; E, energy balance; G, ground heat
capacity; D, diurnal variation; and M, mesoscale (48 hours). Smoke removal:
D, after 1 day (prompt removal); D
0
, arbitrary initial injection; W, after 1
week; M, after 1 month;
+
, assumption implicit in smoke scenario adopted; and
, no smoke removal after injection. From Turco et al. (1990), wherein all
source papers are referenced. © American Association for the Advancement of
Science.
216 Nuclear winter
be taken too seriously, however, because quantitative rainfall simulations with
GCMs are not particularly reliable.
The chronic phase
The chronic phase or effects of smoke injections by large-scale nuclear warfare on
timescales greater than a month are particularly challenging to simulate. Reliable
simulations require a coupled ocean model that can simulate changes in SSTs and
associated vertical heat fluxes (e.g., Robock, 1984), as well as changes in merid-
ional and zonal heat transports by ocean circulations. Interactions with sea ice
formation and melting as well as changes in albedo of snow and ice fields caused
by soot fallout should also be considered (e.g., Warren and Wiscombe, 1985;
Ledley and Thompson, 1986; Vogelmann et al., 1988). Moreover, cloud feedbacks
are also important. Not only are the direct responses of clouds important, such as
discussed above, but so are more subtle cloud interactions related to changes in
land and sea surface temperatures, and changes in important general circulation
patterns (i.e., monsoonal circulations, large-scale ridge/trough patterns). Funda-
mental to simulating long-term responses is the prediction of the horizontal and
vertical distribution of smoke and its concentrations, and the removal of smoke
by scavenging and sedimentation.
Long-term survival of smoke in the atmosphere requires that the smoke be
injected into the upper troposphere and lower stratosphere where residence times
can be on the order of several months to as long as a year or more, respectively.
The creation of a very stable, upper troposphere in the heated, lofted smoke layer
which Schneider and Thompson (1988) called a smokeosphere would greatly
extend the survival of smoke into a chronic phase.
Overall, the models used thus far for simulating the longer-term effects of smoke
injections by large-scale nuclear warfare are too crude to be considered reliable.
We must, therefore, wait for a new generation of GCMs to be implemented, and
for a rekindling of interest, to examine those potential consequences quantitatively.
10.2.8 Biological effects
A comprehensive assessment of the ecological and agricultural effects of nuclear
war has been done by the SCOPE team (Harwell and Hutchinson, 1985). They
concluded that agricultural systems, in particular, are very sensitive to even small
changes in temperature, photosynthetically active radiation, and rainfall. They
conclude that they are so sensitive that many of the unresolved climatic issues we
have discussed above are less relevant, since even lower estimates of many effects
(i.e., on temperatures, rainfall, and sunshine) could be devastating to agricultural
production and thereby to human populations on regional and global scales.
Scientific basis of the nuclear winter hypothesis 217
In our opinion, this conclusion represents a rather naive perception of the level
of uncertainty of climatic response estimates to large-scale nuclear war. There is
little question that the level of uncertainty is very great indeed with respect to
longer-term chronic impacts, which are important to biological effects. At this
point one cannot be certain that the potential anomalies in temperature, precipi-
tation, and sunshine triggered by smoke and soot released by large-scale nuclear
war, for example, fall outside the envelope of expected natural variability of
those parameters that agricultural systems must cope with and have coped with
in the last century. There is little question that just a naturally poor growing
season following a major war would compound the already stressed food dis-
tribution system due to disruption of transportation and limited availability of
fuels, fertilizers, etc. needed for agricultural productivity. Nuclear fallout effects
in such a poor growing season would further compound the problem. On the
other hand, if a good growing season followed a devastating war, the possibly
minor smoke-induced climatic effects would have little impact (although agri-
culture and the remainder of the biosphere, including people, would have to
cope with the accumulation of a variety of harmful radionuclides on the Earth’s
surface).
Even during the acute phase, the uncertainty of smoke-induced impacts on
weather and climate are so great that SCOPE’s conclusion is a bit of an overstate-
ment. In our opinion, the GCM experiments by Schneider and Thompson (1988)
represent the most useful simulations for examining potential impacts of smoke-
induced changes on agriculture and ecosystems. They emphasized the importance
of considering geographical and weather variability rather than just time and
spatial averages of temperature and other parameters. They noted, for example,
that if temperatures fell below a critical threshold for only a few hours or so,
crop production could be severely impacted (e.g., subfreezing temperatures for
wheat, or temperatures as cool as 15
C during the flowering phase of rice). They
examined temperature extremes simulated with the NCAR Community Climate
Model (CCM) by determining the coldest temperatures reached during a 30-day
July control simulation and a smoke-perturbed, baseline war scenario. They found
that the regions of subfreezing temperatures that are normally confined to polar
latitudes and high mountains, expanded in the smoke-perturbed simulation. They
also found considerable regional variability in the simulated responses to smoke.
The smoke-perturbed case, for example, exhibited more frequent cooler temper-
atures over the midwestern United States, but no subfreezing temperatures. They
reported some probability of subfreezing temperatures over the Ukraine and some
temperatures over China that were low enough to impact rice growing in the
smoke-perturbed cases.
218 Nuclear winter
Let us ignore, for the moment, the uncertainties in the GCM simulation of the
climatic response to smoke perturbations due to the specification of the height
and concentration of smoke, the dispersion of the smoke, the impact of clouds on
scavenging of smoke and interference with smoke-induced radiative anomalies,
and the fact that Schneider and Thompson’s simulation did not include a diurnal
cycle. Instead let us focus on the natural variability question again. It is important
to determine where the role of smoke-induced perturbations compared to the
natural variability that can be expected in July over a given region. Again if the
war-produced smoke is to have any climatic or biological impacts of significance,
it should produce anomalies greater than the expected natural variability over
a region. This cannot be addressed from a single GCM realization. To actually
define both natural and smoke-perturbed regional variability, a GCM must be run
over a number of realizations each of which is initialized by a slightly perturbed
initial state. A measure of the validity of the model would be to determine how
well the model represents actually observed natural variability. Then one could
examine the variability of the smoke-perturbed simulations relative to the natural
variability to determine if the potential smoke-induced changes are substantially
different from what could be expected naturally. Such an ensemble approach is
now routinely used for climate change simulations.
As it is, these single realization GCM runs represent only a first step sensitivity
experiment showing plausible physical responses to smoke. They should not be
taken too literally with respect to biological impacts.
10.3 Summary of the status of the nuclear winter hypothesis
The nuclear winter hypothesis has been examined mainly with the use of models
of varying complexities. There have been some attempts to examine the hypothesis
relative to analogs such as meteor impacts and volcanic emissions, but both of
these processes involve the deposition of large amounts of smoke and debris in
the stratosphere where the expected residence times are considerably longer than
in the troposphere. Measurements of smoke emissions from natural wildland fires,
and from industrial fires and even Kuwaiti oil fires have also been made, but
these are much smaller than anticipated for nuclear winter with the bulk of the
smoke being confined to lower levels in the atmosphere than expected from large
urban firestorms. As a result of the almost total reliance on models that have
numerous shortcomings, the nuclear winter hypothesis is a long way from being
proven scientifically viable. Hopefully, we will never have the opportunity to test
the hypothesis experimentally.
One virtue of the hypothesis is that it has triggered many refinements in climate
models, particularly in terms of the introduction of aerosol physics and refined