Cotton W.R., Pielke R.A. Human Impacts on Weather and Climate
Подождите немного. Документ загружается.

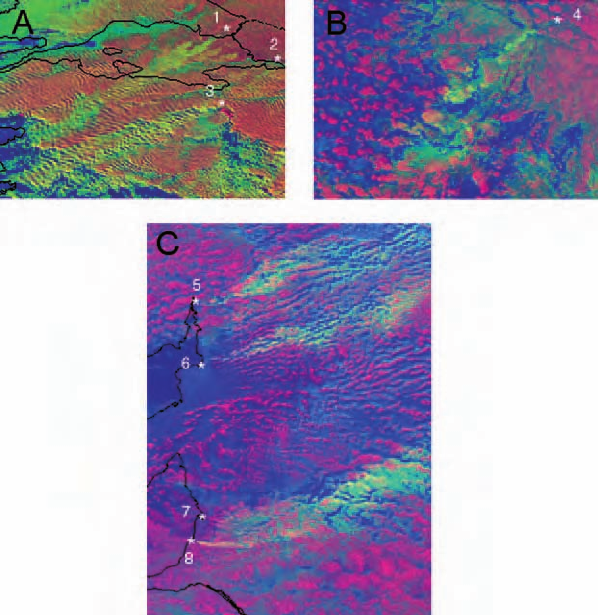
Plate 1 Satellite visualization of NOAA AVHRR images, showing the
microstructure of clouds for three cases over three different continents with
streaks of visibly smaller drops due to ingestion of pollution originating
from known pollution sources that are marked by white numbered asterisks.
(A) A 300 × 200 km cloudy area containing yellow streaks originating from the
urban air pollution of Istanbul (
∗
1), Izmit (
∗
2), and Bursa (
∗
3) on 25 December
1998 at 12:43 UT. (B) A 150 × 100 km cloudy area containing yellow streaks
showing the impact of the effluents from the Hudson Bay Mining and Smelting
compound at Flin-Flon (*4) in Manitoba, Canada (54
46
N 102
06
W), on
4 June 1998 at 20:15 UT.(C) An area of about 350×450 km containing pollution
tracks over South Australia on 12 August 1997 at 05:25 UT originating from the
Port Augusta power plant (
∗
5), the Port Pirie lead smelter (*6), Adelaide port
(
∗
7), and the oil refineries (
∗
8). All images are oriented with north at the top. The
images are color composites, where the red is modulated by the visible channel;
blue is modulated by the thermal infrared; and green is modulated by the solar
reflectance component of the 37 m channel, where larger (greener) reflectance
indicates smaller droplets. The composition of the channels determines the color
of the clouds, where red represents cloud with large drops and yellow represents
clouds with small drops. The blue background represents the ground surface
below the clouds. From Rosenfeld (2000). Reprinted with permission from
D. Rosenfeld, © 2000 American Association for the Advancement of Science.
See also Figure 4.3.
2100 GMT
15 May 1991
Looking NE
dryline
USGS vegetation
20
km
20
km
96
km
N-S
71
km
E-W
(a)
dryline
short grass
(b)
Cumulonimbus
8 g kg
–1
vapor
8 g kg
–1
vapor
towering Cu
towering Cu
(C. Ziegler, NSSL)
2100 GMT
15 May 1991
Looking NE
96
km
N-S
71
km
E-W
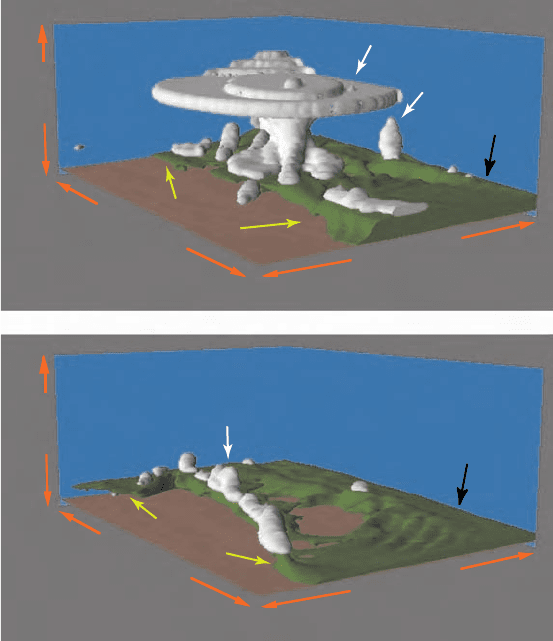
Plate 2 (a) and (b) Model output cloud and water vapor mixing ratio fields
on the third nested grid (grid 4) at 21 : 00 UT on 15 May 1991. The clouds
are depicted by white surfaces with q
c
= 001 g kg
−1
, with the Sun illuminating
the clouds from the west. The vapor mixing ratio in the planetary boundary
layer is depicted by the shaded surface with q
v
= 8gkg
−1
. The flat surface is
the ground. Areas formed by the intersection of clouds or the vapor field with
lateral boundaries are flat surfaces, and visible ground implies q
v
< 8gkg
−1
. The
vertical axis is height, and the backplanes are the north and east sides of the grid
domain. Reproduced from Pielke et al. (1997) with permission from Ecological
Applications and the Ecological Society of America. See also Figure 6.10.

Plate 3 South of the South Platte River, south and west of North Platte, Nebraska, looking north on 1 June 2004 at approximately
1300 LST. A number of pivot irrigators are not watering. Photo courtesy of Kelly Redmond. See also Figure 6.16.
(c)
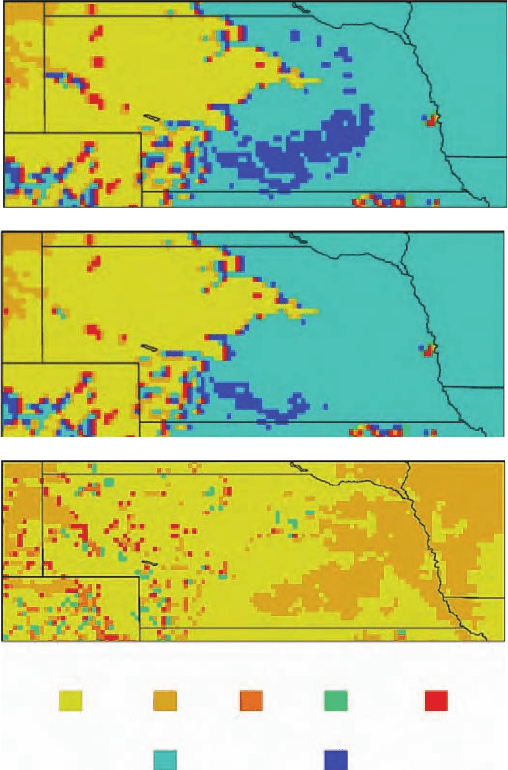
Shortgrass Tallgrass
Crop/mixed/farming Irrigated crop
Wooded
grassland
Mixed
woodland Scrubland
(a)
(b)
Plate 4 Land-cover datasets used for RAMS simulations for (a) 1997 Landsat
and ancillary data irrigation, (b) OGE, and (c) Küchler potential vegetation.
From Adegoke et al. (2003) reproduced with permission from the American
Meteorological Society. See also Figure 6.17.
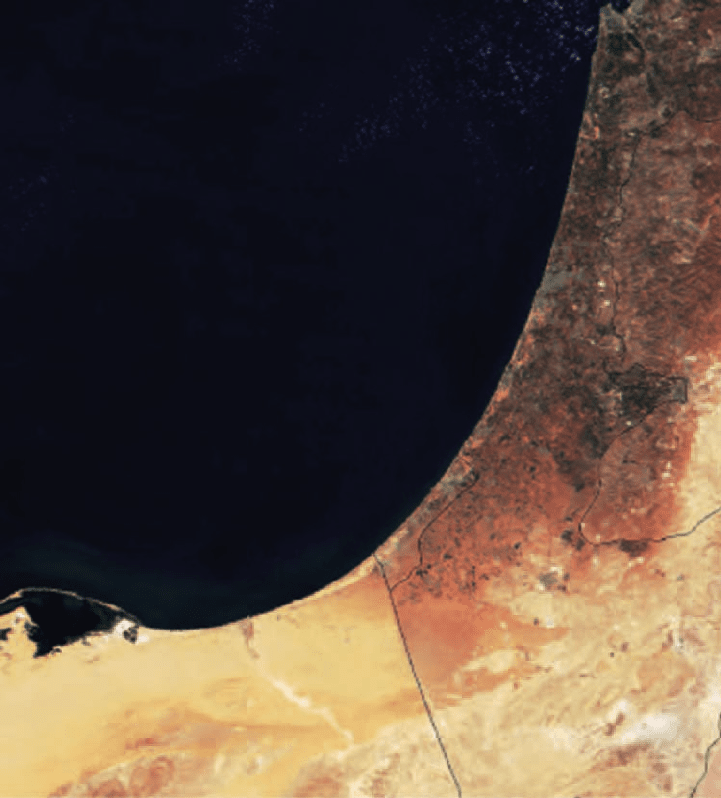
Plate 5 This MODIS view shows the denuded high albedo regions of
the Sinai and Gaza Strip, in contrast to the darker western Negev. Sensor:
Terra/MODIS; Datastart: 2000-09-10; Visible Earth v1 ID: 5606; Visualization
date: 2000-10-12. Courtesy of NASA Visible Earth and Jacques Descloitres,
MODIS Land Science Team. See also Figure 6.24.
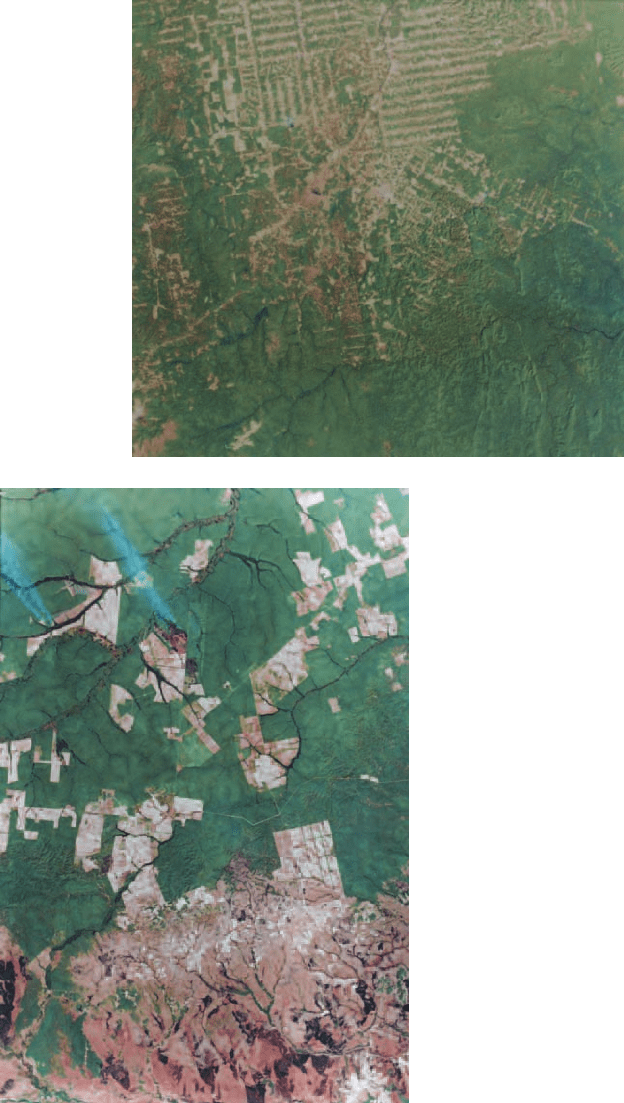
Plate 6 Examples of clear-cutting
of the tropical forest in two areas
of the Amazon. Photos provided
by Carlos Nobre of the Center for
Weather Prediction and Climate
Studies – CPTEC, INPE, Brazil.
See also Figure 6.25.
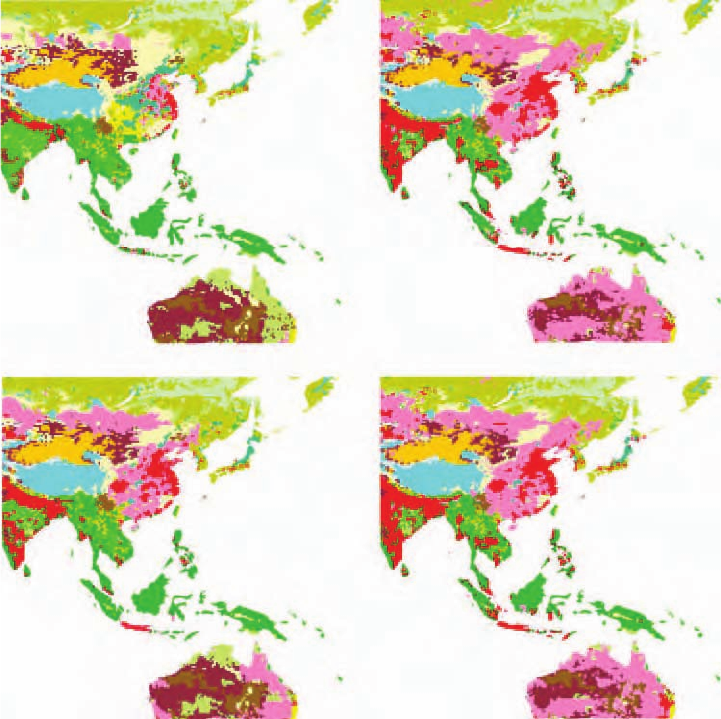
(a) (c)
(b) (d)
Plate 7 Examples of land-use change from (a) 1700, (b) 1900, (c) 1970, and
(d) 1990. The human-disturbed landscape includes intensive cropland (red), and
marginal cropland used for grazing (pink). Other landscape includes, for example,
tropical evergreen and deciduous forest (dark green), savanna (light green),
grassland and steppe (yellow), open shrubland (maroon), temperate deciduous
forest (blue), temperate needleleaf evergreen forest (light yellow), and hot desert
(orange). Of particular importance is the expansion of the cropland and grazed
land between 1700 and 1900. Data obtained from the Hyde Database available
at www.mnp.nl/hyde/. Reproduced with permission from Kees Klein Goldewijk.
See also Figure 11.1.
70
50
40
30
10
8
6
4
2
1
0.8
0.6
0.4
0.2
0.1
15
20
–150° –120° –90° –60°
–60° –30° 30° 60°0°
–30° 0° 30° 60° 90° 120° 150°
S
N
W
E
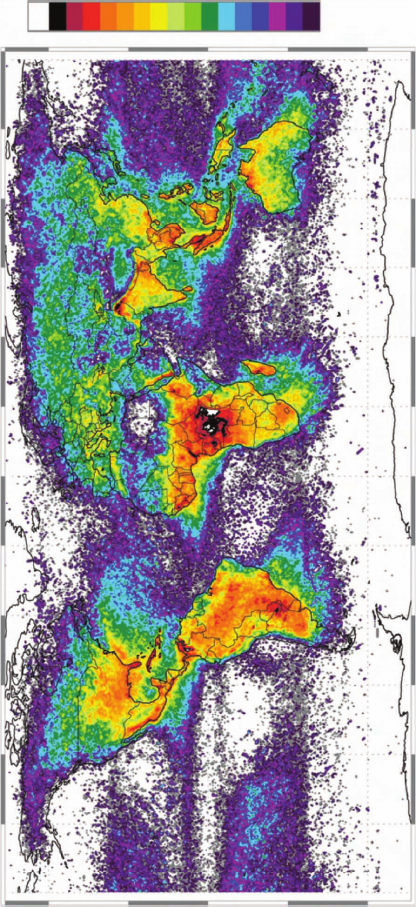
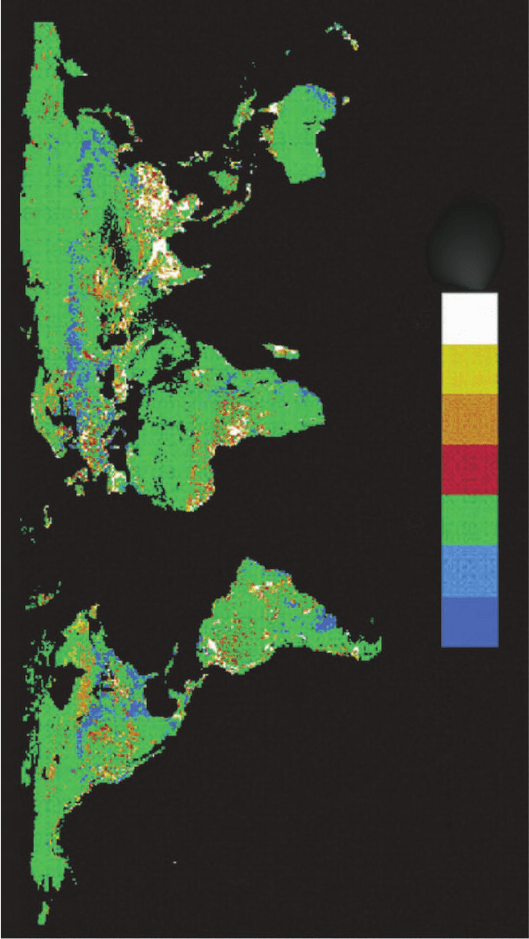
Plate 8 Global distribution of lightning from April 1995 through February 2003 from the combined observations of the
NASA Optical Transient Detector (OTD) (4/95-3/00) and Lightning Imaging Sensor (LIS) (1/98-2/03) instruments. From
http://thunder.nsstc.nasa.gov/images/HRFC_AnnualFlashRate_cap.jpg. See also Figure 11.2.
(a) Radiative forcing due to carbon sequestration (nW m
–2
ha
–1
)
(b) Radiative forcing due to albedo change (nW m
–2
ha
–1
)
(c) Carbon emissions equivalent to albedo change (t C ha
–1
)
(d) Net radiative forcing by afforestation (nW m
–2
ha
–1
)
–0.8
–0.6 –0.4 –0.2 –0.1 –0.05 0.05 0.1 0.15 0.2
–0.6 –0.5 –0.4 –0.3 –0.2
0.05
30 40 50 60 70 80 90 100 120
0.1 0.15 0.2 0.25 0.3 0.35 0.4
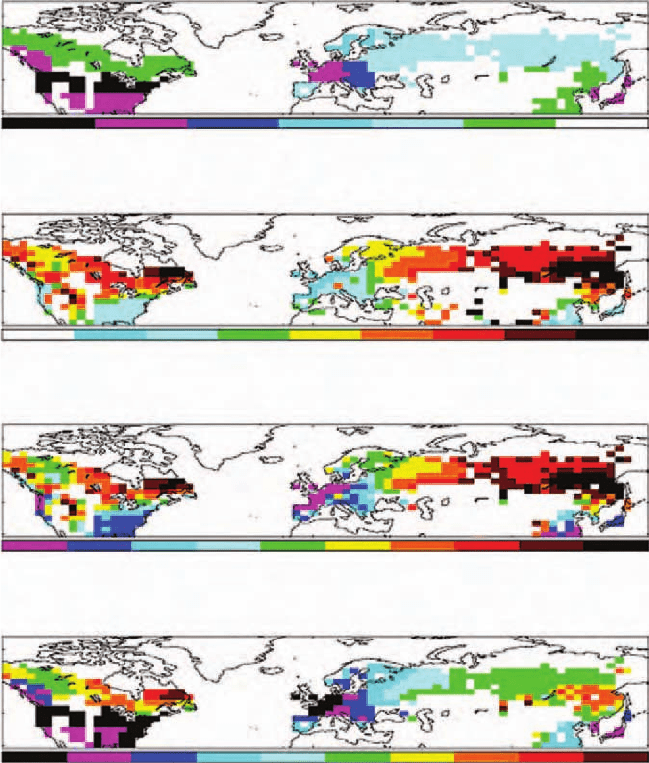
Plate 9 Radiative forcing of climate by afforestation, considering illustrative
1-ha plantations in the temperate and boreal forest zones. Calculations apply
to the time at the end of one forestry rotation period, relative to the start of
the rotation period with plantation areas unforested. (a) Global mean long-
wave radiative forcing due to carbon dioxide removal through sequestration
nWm
−2
ha
−1
. (b) Global mean shortwave radiative forcing due to albedo
reduction nWm
−2
ha
−1
. (c) Carbon emissions that would give the same mag-
nitude of radiative forcing as the albedo reduction tC ha
−1
. (d) Net radiative
forcing due to afforestation, found by summing (a) and (b) nWm
−2
ha
−1
.
Positive forcing implies a warming influence; where (d) shows positive values,
afforestation would warm climate rather than cooling it as would be expected
by considering carbon sequestration alone. After Betts (2000); from Pielke et al.
(2002). See also Figure 11.9.
scale: 0.5
×
0.5 /lat/lon
m
2
m
–2
LAI
+2 –2 –40
Plate 10 Effect of land-use changes on plant canopy density (potential LAI - actual LAI). Scale 0.5 latitude × 0.5 longitude.
From Pielke et al. (2002), based on Nemani et al. (1996). See also Figure 11.10.