Cotton W.R., Pielke R.A. Human Impacts on Weather and Climate
Подождите немного. Документ загружается.

60° N
(a)
60° E120° E
4 8 12 16 20 24
180° 120° W60° W
30°
S
30°
N
60°
S
0°
0°
0°
60° N
(b)
60° E120° E
4 8 12 16 20 24
180° 120° W60° W
30°
S
30°
N
60°
S
0°
0°
0°
60° N
(c)
60° E120° E
4 8 12 16 20 24
180° 120° W60° W
30°
S
30°
N
60°
S
0°
0°
0°
60° N
(d)
60° E120° E
4 8 12 16 20 24
180° 120° W60° W
30°
S
30°
N
60°
S
0°
0°
0°
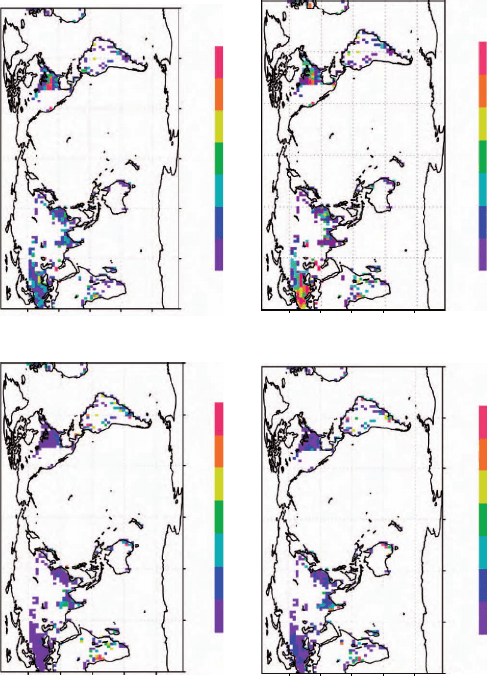
Plate 11 The 10-year average absolute value change in (a) January surface latent turbulent heat flux, (b) July surface latent
turbulent heat flux, (c) January surface sensible heat flux, and (d) July surface sensible heat flux in W m
−2
at the locations where
land-use change occurred. Based on Chase et al. (2000); from Pielke et al (2002). See also Figure 11.11.
60° N
(a)
60° E 120° E
4 8 12 16 20
24
180° 120°
W60° W
30°
S
30°
N
60°
S
0°
0°
0°
60° N
(b)
60° E 120° E
4 8 12 16 20
24
180° 120°
W60° W
30°
S
30°
N
60°
S
0°
0°
0°
60° N
(c)
60° E 120° E
4 8 12 16 20
24
180° 120°
W60° W
30°
S
30°
N
60°
S
0°
0°
0°
60° N
(d)
60° E 120° E
4 8 12 16 20 24
180° 120° W60° W
30°
S
30°
N
60°
S
0°
0°
0°
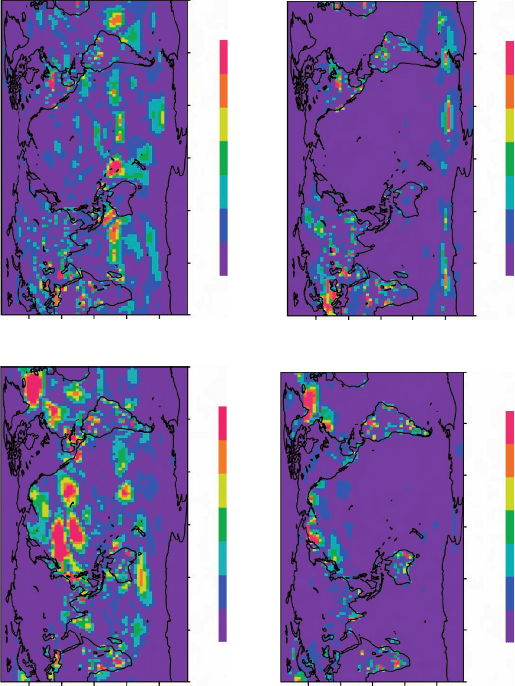
Plate 12 The 10-year average absolute value change in surface sensible and latent turbulent heat flux in W m
−2
worldwide as
a result of the land-use changes. (a) January surface latent turbulent heat flux, (b) July surface latent turbulent heat flux, (c)
January sensible turbulent heat flux, and (d) July sensible turbulent heat flux. Based on Chase et al. (2000); from Pielke et al.
(2002). See also Figure 11.12.