Cotton W.R., Pielke R.A. Human Impacts on Weather and Climate
Подождите немного. Документ загружается.

Influence of irrigation 119
36 km
36 km
(a)
(b)
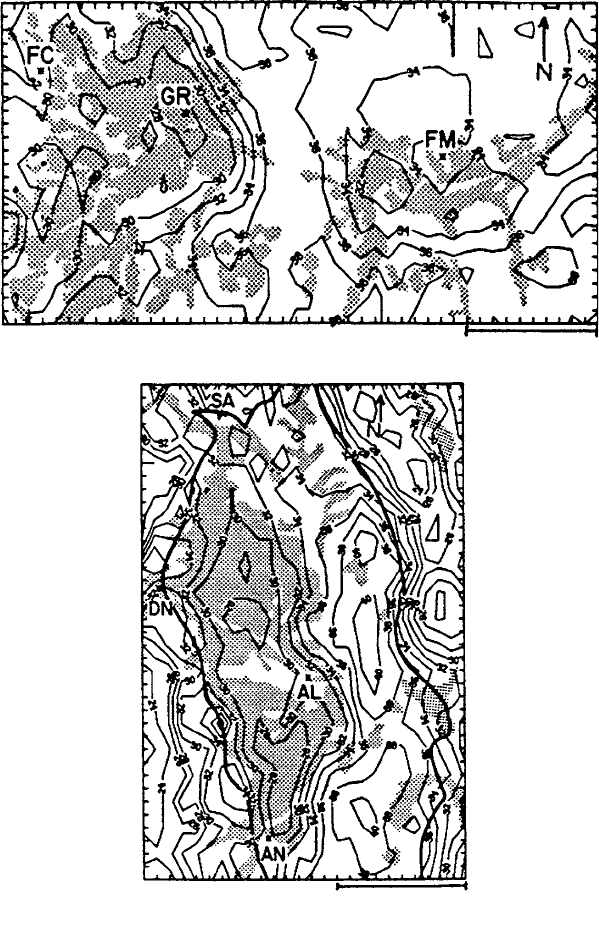
Figure 6.11 Composite of GOES-derived surface temperature at 1300 LST for
the period 1 August 1986 to 15 August 1986 for (a) northeast Colorado (FC,
Fort Collins; FM, Fort Morgan; GR, Greeley), and (b) the San Luis Valley in
Colorado (AL, Alamosa; AN, Antonito; DN, Del Norte; SA, Saguache). The
lower valley is outlined by a dark line separating it from significant elevated
terrain. Irrigated areas are shaded. Reproduced from Segal et al. (1988) with
permission from the American Meteorological Society.
120 Other land-use/land-cover changes
The first example (Fig. 6.11a) is for northeast Colorado which includes the agri-
cultural areas along the Front Range and the South Platte River. The topographical
variations in the area presented are in the range of 200 m.
The second example is for the San Luis Valley (Fig. 6.11b) where there is
intensive irrigated summer agricultural activity in the central domain. The valley is
nearly flat, and it is surrounded by steep mountains to the southwest and northeast
as indicated in the figure.
In both composites, there is a significant correspondence between the cooler areas
and vegetative cover. The highest temperature occur in the uncultivated areas. Maxi-
mum IR surface temperature gradients of 10
C and 12
C over distances of 10–20 km
were observed in northeast Colorado and the San Luis Valley, respectively. Since
the emittance of the Earth surface is less than 1, the actual surface temperatures
involved with these cases are somewhat higher than those presented. The emissivity
of the irrigated area, however, is likely to be somewhat higher than that of its dry-
land surroundings (e.g., Lee, 1978). Thus the actual surface temperature gradients
are suggested to be larger than those illustrated. Therefore noticeable circulations
should be expected to occur with such temperature gradients.
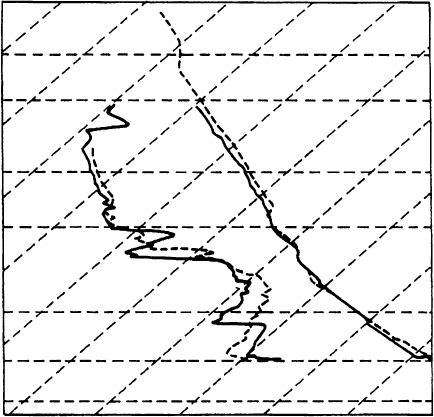
Figure 6.12 illustrates two soundings made over two locations in northeast
Colorado at 1213 LST on 28 July 1987 (Pielke and Zeng, 1989; Segal et al.,
250
300
400
500
700
850
–10 0 10 20
T (
°
C)
P (mb)
3040
Figure 6.12 Radiosonde measurements of temperature (right side) and dewpoint
temperature (left side) for a dryland area (dashed line) and an irrigated area (solid
line) in northeast Colorado at 1213 LST on 28 July 1987. Reproduced from
Pielke and Zeng (1989) with permission from the National Weather Association.
Influence of irrigation 121
1989). The soundings were made prior to significant cloud development. The
radiosonde sounding over an irrigated location had a slightly cooler, but moister
lower troposphere than the sounding over the natural, shortgrass prairie location.
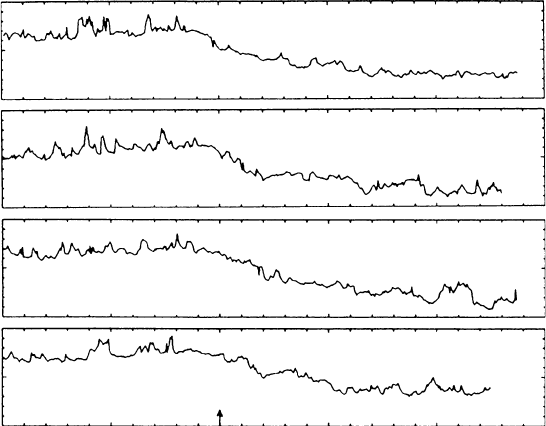
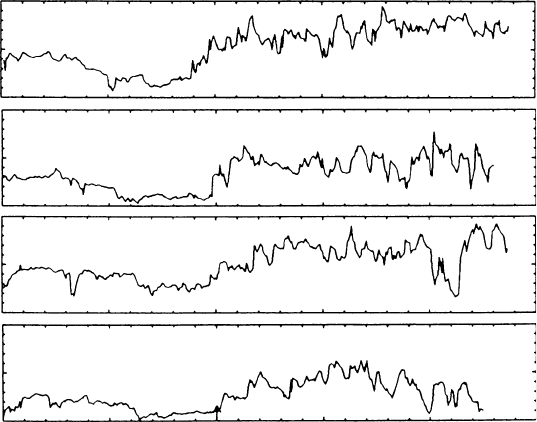
Aircraft flights at several levels between these two locations on 28 July 1987
(Figs. 6.13 and 6.14) demonstrate that the moistening and cooling occurred over
the entire region of irrigation. Using a convective index to 500 mb, the lifted
index, assuming surface parcel ascent, was −2 over the irrigated land but zero
over the shortgrass prairie (Pielke and Zeng, 1989). For this case, the moistening
of the lower atmosphere over the irrigated area was more important in increasing
CAPE than was the slight cooling in decreasing CAPE.
6.2.2 Nebraska
As discussed in Adegoke et al. (2003), over the last five decades, the total acreage
under irrigation in the US High Plains increased from less than 1.2 million
hectares to over 8 million hectares (Kuzelka, 1993). The rapid development of
320.0
316.0
317.0
θ (k)
θ (k)
θ (k)
θ (k)
320.0
320.0
317.0
317.0
01020304050
(d)
(c)
(b)
(a)
DISTANCE (km)
320.0
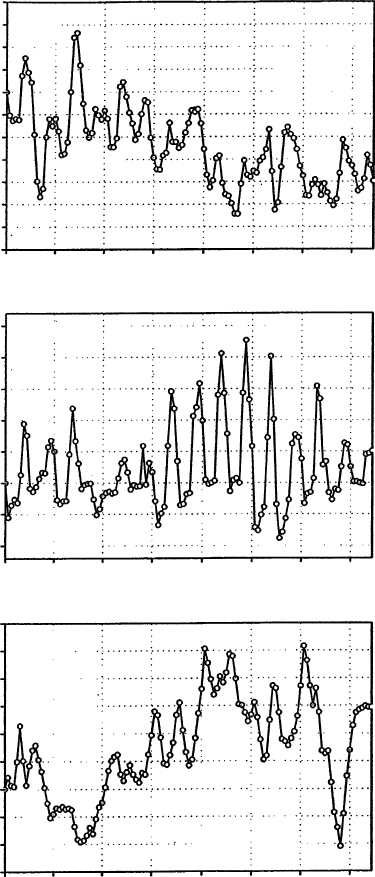
Figure 6.13 Measured potential temperature from Briggsdale to Windsor at the
altitude of (a) 140 m, (b) 240 m, (c) 345 m, and (d) 440 m above the ground.
The observed crop–dryland boundary is indicated by an arrow, with cropland to
its right. Adapted from Segal et al. (1989) with permission from the American
Meteorological Society.
122 Other land-use/land-cover changes
12.5
r (g kg
–1
)r (g kg
–1
)r (g kg
–1
)r (g kg
–1
)
13.0
8.0
12.0
7.0
13.0
8.0
0102030
DISTANCE (km)
40
(a)
(b)
(c)
(d)
50
7.5
Figure 6.14 Same as Fig. 6.13 except for moisture mixing ratio. Adapted from
Segal et al. (1989) with permission from the American Meteorological Society.
irrigation in this area, which stretches from Nebraska through western Kansas
to the Texas Panhandle, enabled the transformation of the area into one of the
major agricultural areas of the United States. In Nebraska, as in much of the
High Plains, corn is the dominant crop cultivated during the warm season months
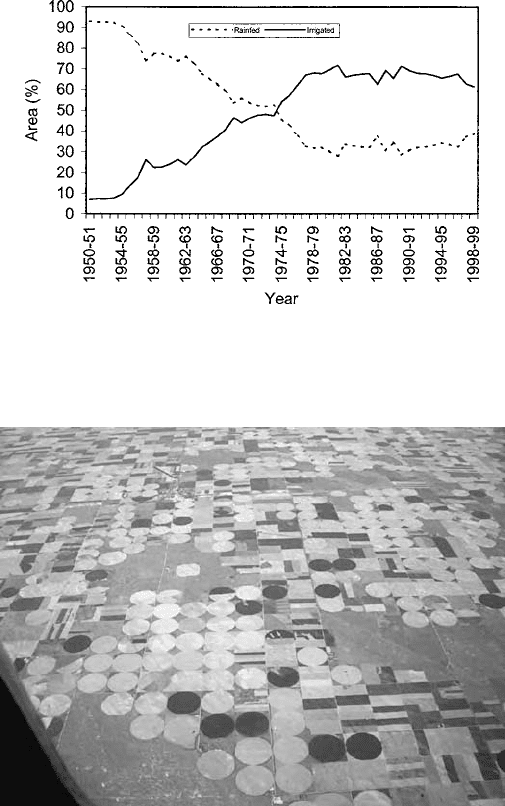
(Williams and Murfield, 1977). Irrigated corn, which represented about 10% of
total corn-producing areas during the early 1950s, now composes nearly 60% of
the total corn-producing areas in Nebraska (Fig. 6.15). Figure 6.16 illustrates how
this irrigated landscape appears.
Data from the National Agricultural Statistics Services (NASS) of the United
States Department of Agriculture (USDA) for York County in east-central
Nebraska further underscore these changes. Between 1950 and 1998 the irrigated
corn area in York County increased from 3500 ha to 80 000 ha (a 2300% increase)
while the rain-fed corn area declined rapidly during the same period (National
Agricultural Statistics Service, 1998). This rapid land-use change was achieved
largely by converting rain-fed corn areas to irrigation. Land-use conversion of
this magnitude could affect energy and moisture exchanges between the land
surface and the lower atmosphere by altering transpiration and evaporation thus
generating complex changes in the surface energy budget.
Regional Atmospheric Modeling System (RAMS) (Pielke et al., 1992; Cotton
et al., 2003) simulations were performed which consisted of four land-use
Influence of irrigation 123
Figure 6.15 Area (%) of rainfed and irrigated corn farming in Nebraska (1950–
98). Reproduced from Adegoke et al. (2003) with permission from the American
Meteorological Society.
Figure 6.16 South of the South Platte River, south and west of North Platte,
Nebraska, looking north on 1 June 2004 at approximately 1300 LST. A number
of pivot irrigators are not watering. Photo courtesy of Kelly Redmond. See also
color plate.
scenarios covering the 15-day period from 1 to 15 July 1997. The first scenario
(control run) represented current farmland acreage under irrigation in Nebraska
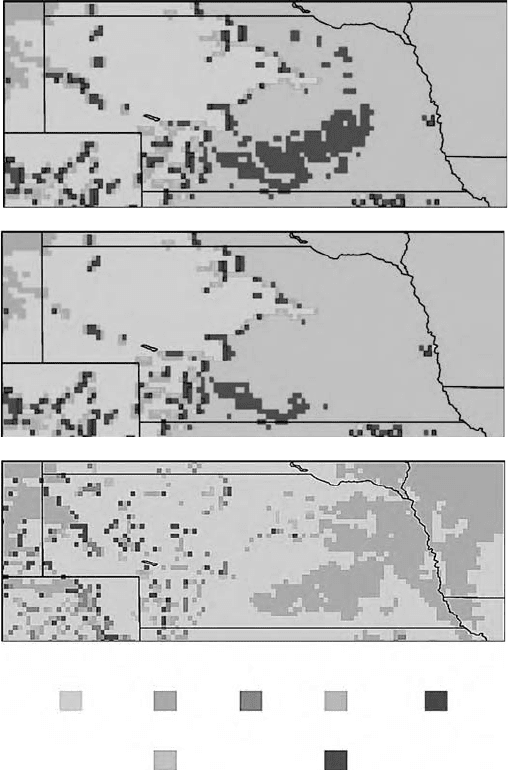
as estimated from 1997 Landsat satellite and ancillary data (Fig. 6.17a). The
second and third scenarios (OGE wet and dry runs) represented the land-use con-
ditions from the Olson Global Ecosystem (OGE) vegetation dataset (Fig. 6.17b),
and the fourth scenario (natural vegetation run) represented the potential
124 Other land-use/land-cover changes
(c)
Shortgrass Tallgrass
Crop/mixed/farming Irrigated crop
Wooded
grassland
Mixed
woodland Scrubland
(a)
(b)
Figure 6.17 Land-cover datasets used for RAMS simulations for (a) 1997 Land-
sat and ancillary data irrigation, (b) OGE, and (c) Küchler potential vegetation.
From Adegoke et al. (2003) reproduced with permission from the American
Meteorological Society. See also color plate.
(i.e., pre-European settlement) land cover from the Küchler vegetation dataset
(Fig. 6.17c). In the control and OGE wet run simulations, the topsoil of the areas
under irrigation, up to a depth of 0.2 m, was saturated at 0000 UTC each day for
the duration of the experiment (1–15 July 1997). In both the OGE dry and natural
runs, the soil was allowed to dry out, except when replenished naturally by rainfall.
The “soil wetting” procedure for the control and OGE wet runs was constructed
to imitate the center-pivot irrigation scheduling under dry synoptic atmospheric
conditions such as observed in Nebraska during the first half of July 2000 (i.e.,
Influence of irrigation 125
0.9
0.8
(a)
(b)
(c)
0.7
0.6
0.5
0.4
0.3
0.2
0.1
–0.1
–0.2
–0.3
–0.4
–0.5
55
50
45
40
35
30
25
20
15
10
0
5
–5
–10
–15
–20
0.4
0.35
0.3
0.25
0.2
0.15
0.1
0.05
–0.05
–0.1
–0.15
–0.2
–0.25
–0.3
0
1JUL
1997
3JUL 5JUL 7JUL 9JUL 11JUL 13JUL 15JUL
1JUL
1997
3JUL 5JUL 7JUL 9JUL 11JUL 13JUL 15JUL
1JUL
1997
3JUL 5JUL 7JUL 9JUL 11JUL 13JUL 15JUL
0
Temperature (°C)
Latent heat (W m
–2
)
Moisture flux
(g
kg
–1
ms
–1
)
Figure 6.18 Control minus OGE wet run inner-domain area-averaged (a) 2 m
temperature, (b) surface latent heat, and (c) moisture flux at 500 m. Reproduced
from Adegoke et al. (2003) with permission from the American Meteorological
Society.

126 Other land-use/land-cover changes
Table 6.1 Inner-domain area-averaged model parameters for 7–15 July 1997
including scenario comparisons (% change)
Control OGE
(wet)
OGE
(dry)
Natural
vegetation
Temperature (
C) 241 24.9 (0.8%) 25.5 (1.4%) 27.6 (3.5%)
Surface sensible heat (W m
−2
)762 79.8 (4.7%) 86.9 (15%) 98.4 (29%)
Latent heat (W m
−2
) 1024 98.2 (4%) 74.5 (35%) 72.0 (42%)
Vapor flux at 500 m (g kg
−1
ms
−1
)111 10.4 (7%) 9.1 (22%) 8.2 (34%)
Source: From Adegoke et al. (2003).
little or no rainfall recorded throughout the state). The observed atmospheric con-
ditions from the National Centers for Environmental Prediction (NCEP) reanalysis
data (Kalnay et al., 1996) were used to create identical lateral boundary conditions
in the four cases. A two-grid nested model domain configuration was adopted with
a 10-km grid centered over Nebraska nested inside a larger 40-km grid centered
over Nebraska nested inside a larger 40-km grid, which extends over most of the
central United States.
Results for the inner-domain area-averaged model parameters between the control
run and OGE wet run (Fig. 6.18) showed very moderate differences (see Table 6.1
for a summary of scenario comparisons). This reflects the rather small change (less
than 10%) in the irrigated portion of the OGE vegetation data (Fig. 6.17b) compared
to the more recent Landsat satellite-based land-cover estimates (Fig. 6.17a). In
both simulations, the soil-wetting procedure was implemented for the irrigated
areas (i.e., land-use class 16 in LEAF-2 (Land-Ecosystem Atmospheric Feed-
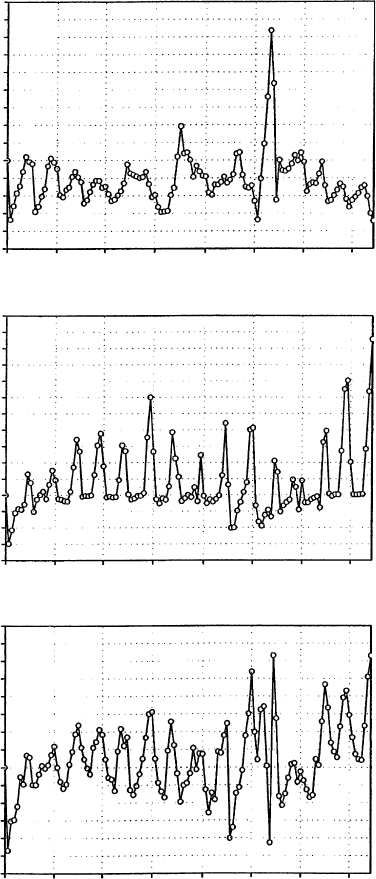
back Model Version 2)). Larger changes were observed when the control run
was compared to the OGE dry run; midsummer 2 m temperature over Nebraska
might be cooler by as much as 34
C under current conditions (Fig. 6.19a).
The average difference between the control and OGE dry runs computed for the
6–15 July 2000 period was 12
C. The irrigation-induced surface cooling was
accompanied by a 36% increase in the surface in the surface latent heat flux
(Fig. 6.19b) and a significant increase (28%) in water vapor flux at 500 m above
the ground (Fig. 6.19c). A corresponding reduction in surface sensible heat (15%)
anda26
C elevation in dewpoint temperature were also observed (not shown).
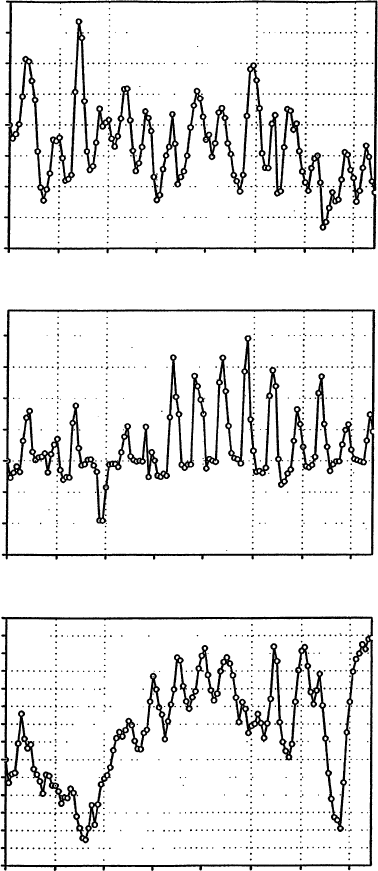
The cooling effect and the surface energy budget differences identified above
intensified in magnitude when the control run results were compared to the poten-
tial natural vegetation scenario. For example, the near-ground average temperature
for 6–15 July 2000 was 33
C cooler, the surface latent heat flux was 42% higher,
and the water vapor flux (at 500 m) 38% greater in the control run compared
to the natural landscape run (Fig. 6.20). The first 5 days of the simulation were
Influence of irrigation 127
4
3
(a)
(b)
(c)
2
1
0
–1
–2
–3
–4
0
50
–50
–100
–150
100
150
200
4
3.5
3
2.5
2
1.5
1
0.5
–0.5
–1
–1.5
–2
–2.5
–3
0
1JUL
1997
3JUL 5JUL
7JUL 9JUL 11JUL 13JUL
15JUL
1JUL
1997
3JUL 5JUL 7JUL 9JUL 11JUL 13JUL 15JUL
1JUL
1997
3JUL 5JUL 7JUL 9JUL 11JUL 13JUL 15JUL
Temperature (°C)
Latent heat (W m
–2
)
Moisture flux (g
kg
–1
ms
–1
)
Figure 6.19 Control minus OGE dry run inner-domain area-averaged (a) 2 m
temperature, (b) surface latent heat, and (c) moisture flux at 500 m. Reproduced
from Adegoke et al. (2003) with permission from the American Meteorological
Society.
128 Other land-use/land-cover changes
3
4
(a)
(b)
(c)
2
1
0
–2
–1
–3
–4
–6
–5
–7
Temperature (°C)
Latent heat (W
m
–2
)
Moisture flux (g
kg
–1
ms
–1
)
0
50
–50
–100
100
150
200
250
4
5
6
3
2
1
–1
–2
–3
0
1JUL
1997
3JUL 5JUL
7JUL 9JUL 11JUL 13JUL
15JUL
1JUL
1997
3JUL 5JUL 7JUL 9JUL 11JUL 13JUL 15JUL
1JUL
1997
3JUL 5JUL 7JUL 9JUL 11JUL 13JUL 15JUL
Figure 6.20 Control minus natural vegetation run inner-domain area-averaged
(a) 2 m temperature, (b) surface latent heat, and (c) moisture flux at 500 m.
Reproduced from Adegoke et al. (2003) with permission from the American
Meteorological Society.