Cotton W.R., Pielke R.A. Human Impacts on Weather and Climate
Подождите немного. Документ загружается.

Impact of urban land use on weather 99
moisture sources including a generalized urban canyon scheme for dense urban
land use. They found that the urban heat island plays a central part in initiating
storms that are enhanced by the urban surface. This is consistent with the two-
dimensional modeling results of Thielen et al. (2000) which indicated that sensible
heat flux variations, due to the urban surface, provide the largest impact upon con-
vection. Observational case studies of Bornstein and Lin (2000) are also consistent
with the results in this study, but their pre-convective surface convergence values
were much smaller (with maximum convergence on the order of 1 × 10
−4
s
−1
).
The position of the urban heat-island-induced boundary layer updraft cell and
resulting thunderstorm qualitatively agrees with Baik and Kim (2001), in that the
basic state wind places convection downwind of the heating source.
Rozoff et al. (2003) found that storms are not initiated over St. Louis when
the urban heat island is turned off and only momentum flux representative of the
city is considered. That is not to say that modifications in momentum flux by the
city are not important. They found that feedbacks between the momentum flux
and sensible/latent heat fluxes cause substantial modification in urban circulations.
Enhanced momentum flux, created by the urban area, slowed environmental wind
and wind driven by the heat island circulation, decreasing the strength of the heat
island. As a result, downwind convergence was dampened. This phenomenon led
to later downwind convective development. Thus the influence of urban-induced
changes in surface momentum fluxes and that due to heat/moisture changes over
the city on mesoscale circulations and precipitation are essentially inseparable.
Likewise, Rozoff et al. (2003) performed simulations in which local topographic
effects were removed from the model. They found that the Ozark foothills had
some impact on precipitation but the bluffs along the Mississippi River and bot-
tomlands north of the city had little effect. Overall, the urban heat-island-induced
convergence downwind of the city dominated over the topographic influences.
A third reason for isolating the causes of the urban precipitation anomaly is that
it may become necessary to reduce the rain anomaly and enhanced severe weather
occurrences. Without a clear identification of the causal factors, one cannot decide
if reductions in emission of gases and aerosols contributing to CCN, or alterations
in land-use patterning, is required to reduce the anomaly. At this time it has not
been determined how strong the influence of gases and aerosol emissions are on
precipitation relative to land-use changes.
The results of METROMEX apply to urban environments in midlatitude humid
areas in which the natural vegetation is a deciduous forest which has been replaced
by agriculture. Avissar and Pielke (1989) modeled such an environment where the
urban area was assumed to contain 20% built-up areas, 10% bodies of water, 40%
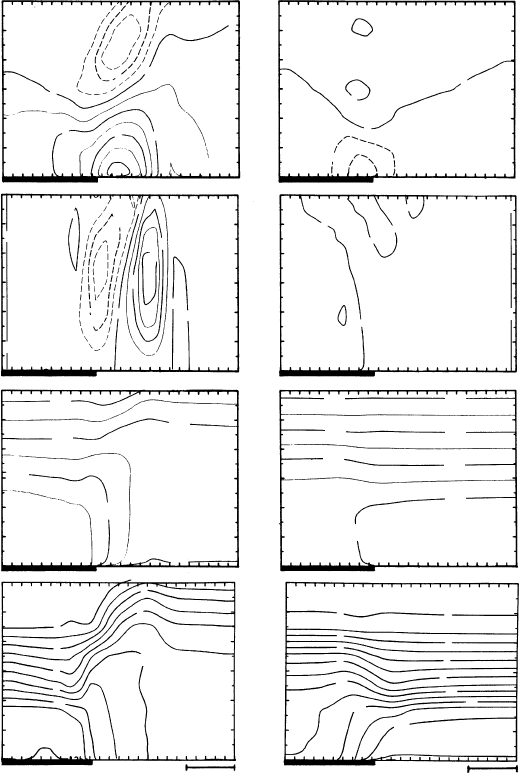
agricultural crops, and 30% forests. Shown in Fig. 5.3a, for 1400 local standard
time (LST), a substantial modification of the boundary layer over the urban
100 Urban-induced changes in precipitation and weather
(a)
0
q
q
θ
θ
w
w
u
u
500
1000
1500
2000
2500
3000
HEIGHT (m)
0
500
1000
1500
2000
306
308
4
6
2
4
6
8
12
10
8
6
4
2
10
2500
3000
HEIGHT (m)
0
500
1000
1500
2000
2500
3000
HEIGHT (m)
0
500
1000
1500
0
0
0
2
0
0
10
10
10
20
10
4
1
0
0
0
0
0
0
0
0
0
1
2
2
2000
2500
3000
HEIGHT (m)
(b)
30
km 30 km
8
10
6
4
2
0
0
0
0
310
308
306
310
310
308
308
308
306
306
304
304
0
14
8
12
Figure 5.3 Vertical cross-section of the simulated region at 1400 LST for: (i)
the horizontal wind component parallel to the domain (u)inms
−1
, positive from
left to right; (ii) the vertical wind component (w)incms
−1
, positive upward;
(iii) the potential temperature () in K; and (iv) the specific humidity (q)in
gkg
−1
, resulting from the contrast of a 60 km wide, heterogeneous land surface
region (indicated by the dark underbar) which consists of 20% built-up areas and
wastelands, 10% bodies of water, 40% agricultural crops, and 30% forests. The
adjacent region is (a) bare and dry, and (b) completely covered by unstressed
vegetation. From Avissar and Pielke (1989).
Additional reading 101
area and the development of low-level convergence into the city were simulated,
which is consistent with the interpretation of the METROMEX data. In contrast,
when this same heavily irrigated urban area is inserted into an arid or semi-arid
environment (such as Denver, Colorado), the impact on the local environment is
even more pronounced as shown in Fig. 5.3b with the urban area acting as an
oasis during the day, rather than a daytime urban heat island. Large differences
in boundary layer structure between the urban area and the surrounding desert
terrain result in a well-defined local wind circulation.
In desert environments, the urban island effect has also been documented. For
example, the nighttime summer temperature at Sky Harbor Airport in Phoenix,
Arizona increased an average of 11
C every decade from 1948 to 1984 (Balling
and Brazel, 1987) apparently as a result of the reduction in the urban area that
contains irrigated vegetation and an increase in coverage by buildings, concrete,
and asphalt. The demand for air conditioning resulted in an increase of peak elec-
tricity demands of 1% to 2% per degree Celsius (Akbari et al., 1989). McPherson
and Woodard (1990) suggest that the ratio of water and energy costs determine
the optimal landscape type which should be used in this environment to mini-
mize their costs. The types of landscaping include zeroscape, which is primarily
rock-covered ground, xeriscape, which utilizes drought-tolerant vegetation such
as mesquite, palo verde, and heritage oak, and mesiscape, that includes moderate
or high water users such as magnolias and ashes. The optimal planting is one that
permits shading and cooling by transpiration to minimize air conditioning needs,
yet water loss is constrained as much as possible. McPherson and Woodard (1989)
estimate that in Tucson, Arizona, the projected annualized cost of a mature tree
is $7.76, while its benefits are $26.18 with $19.20 of this amount resulting from
cooling due to transpiration.
The influence of land use on climate and weather is discussed in more detail
in the next chapter. It is clear, however, that the urban effect will vary depending
on its geographic location and we need to explore a range of urban environments
in even more detail than was achieved during METROMEX.
Finally, Karl and Jones (1989) compared urban and rural temperature records
to show that the growth of cities during this century has resulted in a 0 4
C
bias in the United States climate record. However, since as we have discussed,
the urban effect varies geographically, the correction of an urban bias when
constructing regional and global analyses could still introduce systematic biases
(Zhou et al., 2004). An underrepresented urban bias would suggest the global
climate is warming more rapidly than it actually is.
Additional reading
Oke, T.R., 1987. Boundary Layer Climates, 2nd ed. New York: Routledge.
6
Other land-use/land-cover changes
6.1 Landscape effects
Land-use/land-cover changes continue to accelerate at the beginning of the twenty-
first century (Lepers et al., 2005). Figure 6.1, from the Australia Conservation
Foundation (2001), illustrates the global extent of these changes between 1990
and 2000. The role of this conversion on the regional and global climate system
as a first-order climate forcing was recognized in the National Research Council
(2005) report. The reasons for its importance are reviewed in this chapter.
6.1.1 Surface effects
Concepts
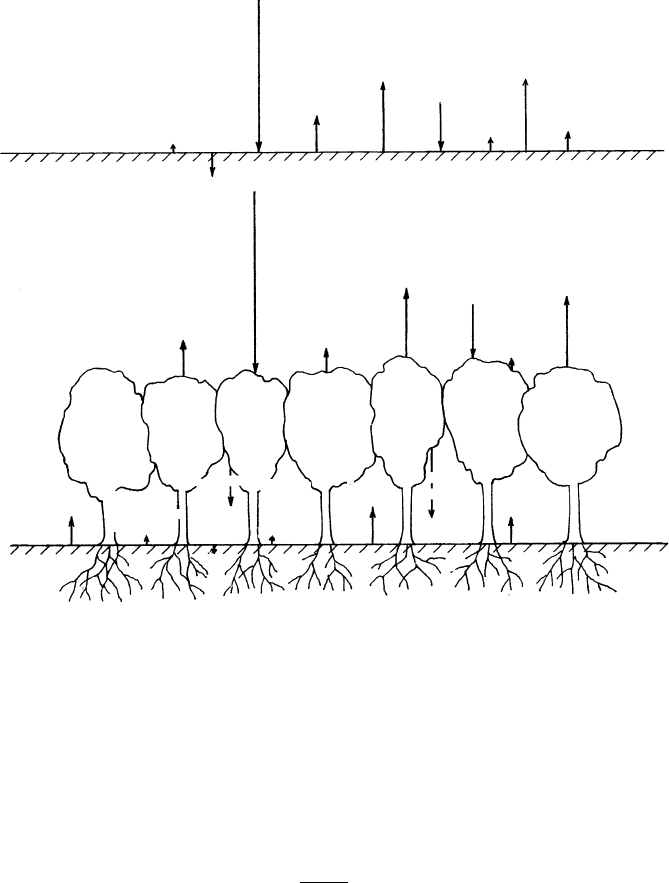
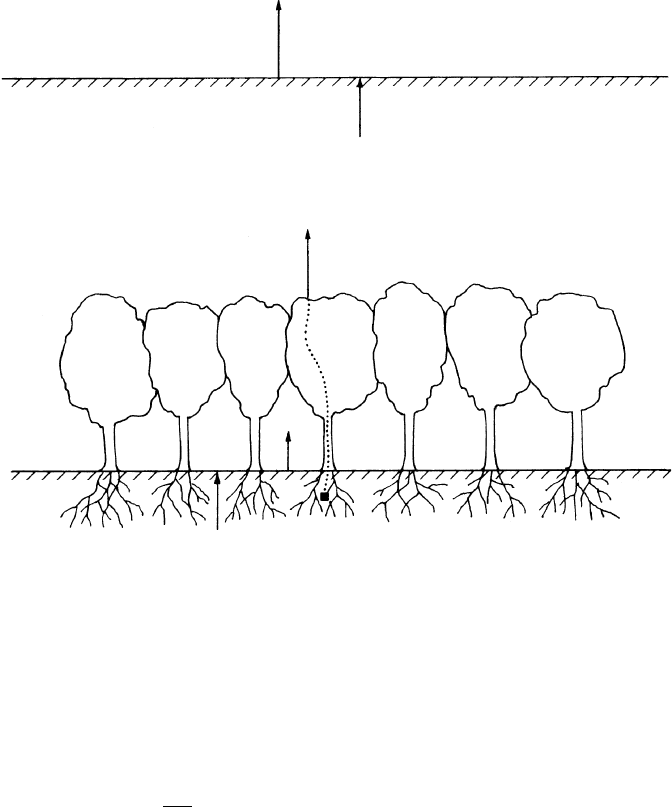
The surface energy and moisture budgets for bare and vegetated soils are schemat-
ically illustrated in Figs. 6.2 and 6.3. These surface budgets can be written as
R
N
= Q
G
+ H + LE + TR (6.1)
P = E + TR + RO + I (6.2)
where R
N
represents the net radiative fluxes = Q
s
1 − A + Q
↓
LW
− Q
↑
LW
P is
the precipitation; E is evaporation (this term represents the conversion of liquid
water into water vapor by non-biophysical processes, such as from the soil surface
and from the surfaces of leaves and branches); TR is transpiration (represents
the phase conversion to water vapor, by biological processes, through stoma on
plants); Q
G
is the soil heat flux; H is the turbulent sensible heat flux; LE + TR
is the turbulent latent heat flux; L is the latent heat of vaporization; RO is runoff;
I is infiltration; Q
s
is insolation; A is albedo; Q
↓
LW
is downwelling longwave
radiation; Q
↑
LW
is upwelling longwave radiation = 1 − Q
↓
LW
+ T
4
s
is the
surface emissivity; and T
s
is the surface temperature.
102

Landscape effects 103
2 500 000
2
000 000
1
500 000
1
000 000
500 000
0
Brazil
Indonesia
Sudan
Zambia
Mexico
Australia
Congo
Myanmar
Nigeria
Zimbabwe
Argentina
Peru
Côte d’lvoire
Malaysia
Cameroon
Venezuela
Colombia
Bolivia
Ecuador
Angola
Land clearing rate (ha year
–1
)
Country
Figure 6.1 International annual land clearing rates for 1990–2000. From the
Australia Conservation Foundation (2001); reproduced by permission of the
Australian Conservation Foundation.
Detailed discussion of these terms is given in Pielke (1984; 2002a, ch. 11).
Equations (6.1) and (6.2) are not independent of each other. A reduction in
evaporation and transpiration in Eq. (6.2), for example, increases Q
G
and/or H
in Eq. (6.1) when R
N
does not change. This reduction can occur, for example, if
runoff is increased (such as through clear-cutting a forest). The precipitation rate
(and type) also influence how water is distributed between runoff, infiltration, and
the interception of water on plant surfaces.
The relative amounts of turbulent sensible (H) and latent heat fluxes LE +
TR are used to define the quantity called the Bowen ratio (B), and evaporative
fraction, e
f
:
B =
H
LE + TR
e
f
= LE + TR/R
N
(6.3)
The denominator LE +TR has been called “evapotranspiration,” although since
evaporation and transpiration involve two distinct pathways for liquid water to
convert to water vapor, the use of the term “evapotranspiration” should be dis-
couraged. It is preferable to refer to E as “physical evaporation” and TR as
“transpiration.” The relation of R
N
to H and LE + TR, following Segal et al.
(1988), can be written as
H
R
N
− Q
G
1/B + 1
(6.4)
104 Other land-use/land-cover changes
solar
irradiance
direct
anthropogenic
heat input
turbulent
sensible
heat flux
turbulent
sensible
heat flux
VEGETATED
SOIL
turbulent
sensible
heat flux
turbulent
latent
heat flux
turbulent
latent
heat flux
turbulent
latent
heat flux
ground heat
conduction
reflected
solar
irradiance
Earth's
irradiance
BARE
SOIL
solar
irradiance
reflected
solar
irradiance
Ground
heat conduction
transmitted
s
olar
irradiance
reflected
atmospheric
irradiance
reflected
atmospheric
irradiance
atmospheric
irradiance
atmospheric
irradiance
canopy
irradiance
reflected
transmitted
solar
irradiance
ground
irradiance
canopy
irradiance
direct
anthropogenic
heat input
Figure 6.2 Schematic illustration of the surface heat budget over (top) bare
soil, and (bottom) vegetated land. The roughness of the surfaces (and for the
vegetation, its displacement height), will influence the magnitude of the heat
flux. Dew and frost formation and removal will also influence the heat budget.
Adapted from Pielke and Avissar (1990) with kind permission from Kluwer
Academic Publishers.
With Q
G
H and Q
G
E + TR, as discussed in Segal et al. (1988),
H
1 + B
B
R
N
(6.5)
Segal et al. (1995) showed that with the same value of R
N
, with a smaller Bowen
ratio, the thermodynamic potential for deep cumulus convection increases.
Therefore, any land-use/land-cover change that alters one or more of the vari-
ables in Eqs. (6.1) and (6.2) will directly affect the atmosphere. For instance,
a decrease in A (i.e., a darkening of the surface) would increase R
N
; thus
making more heat energy available for Q
G
HE and TR. The heat that goes
into H increases the potential temperature, = T1000 mb/p mb, because
Landscape effects 105
diffusivity of
water
from
soil
BARE
SOIL
transpiration
VEGETATED
SOIL
evaporation
diffusivity of
water from soil
evaporation
Figure 6.3 Schematic illustration of the surface moisture budget over (top) bare
soil, and (bottom) vegetated land. The roughness of the surface (and for the
vegetation, its displacement height), will influence the magnitude of the moisture
flux. Dew and frost formation and removal will also influence the moisture
budget. Adapted from Pielke and Avissar (1990) with kind permission from
Kluwer Academic Publishers.
temperature increases. The heat that goes into E or TR goes into the equivalent
potential temperature,
E
, because w (mass of water vapor per unit mass of air)
increases
e
= exp
Lw
C
p
T
. If the surface were dry and bare, all of the heat
energy would necessarily go into Q
G
and H as shown by Pielke (1984, p. 381)
for the Empty Quarter in Saudi Arabia.
Lyons et al. (1996), for example, found a reduction of H in southwestern Aus-
tralia as a result of the conversion of land to agriculture. Bryant et al. (1990) found
higher sensible heat fluxes in the Sonoran Desert of Mexico due to overgrazing.
Fitzjarrald et al. (2001), and Schwartz (1994) found that the leafing out of veg-
etation in the spring has a dramatic effect on a reduction in H. Schreiber et al.
(1996) and Rabin et al. (1990) discuss how cumulus cloud base height is directly
related to surface heat and moisture fluxes, as modulated by the characteristics
of the underlying heterogeneous surface. As discussed in Pielke (2001a), changes
106 Other land-use/land-cover changes
in and
E
change convective available potential energy (CAPE) and the other
cumulus convective indices.
When snow and/or frozen soils are present, figures similar to Figs. 6.2 and
6.3 can be presented. With snow cover, for example, the albedo will be greater
than for bare soil so a greater fraction of incident solar radiation is reflected
upwards. When vegetation is present which is not covered by snow, the protruding
vegetation will result in a lower albedo than would occur when it is completely
covered. Strack et al. (2004) has shown that large differences in the turbulent
fluxes result when snow is covering the ground and is influenced by protruding
vegetation.
Surface air moist enthalpy
Although climate change and variability involves all aspects of the climate system
(Pielke, 1998), the assessment of anthropogenically forced climate change has
focused on surface temperature as the primary metric (Mann and Jones, 2003;
Soon et al., 2004). The term “global warming” has been used to describe the
observed surface air temperature increase in the twentieth century. However,
this concept of global warming requires assessments of units of heat (that is,
joules). Temperature, by itself, is an incomplete characterization of surface air
heat content.
Pielke (2003) used the concept of heat changes in the ocean, for example, to
diagnose the radiative imbalance of the Earth’s climate system. The oceans, of
course, are the component of the climate system in which the vast majority of
actual global warming or cooling occurs. Here we use the more limited application
of the term global warming to refer to surface air changes.
The heat content of surface air (i.e., z right above ground level, so that z = 0
can be assumed) can be expressed as:
M = C
p
T + Lq (6.6)
where C
p
is the specific heat of air at constant pressure, T is the air temperature,
L is the latent heat of vaporization, and q is the specific humidity (Haltiner and
Williams, 1980). The quantity, M, is called moist enthalpy and can be expressed
in units of J kg
−1
. The surface dry enthalpy can be written as
S = C
p
T (6.7)
Surface air temperature trends that have been reported monitor only S. The
monitoring of H, however, is the more appropriate metric to assess surface air
warming.
Landscape effects 107
To investigate the effect of monitoring variations of M in time, both M and
S were calculated for the year 2002 in Fort Collins, Colorado, and at the Cen-
tral Plains Experimental Range (CPER) of the US Department of Agriculture’s
Agricultural Research Service located 60 km northeast of the city (Fig. 6.4).
Both locations offer high-quality temperature and humidity observations. The Fort
Collins site is on a university campus with nearby buildings, parking lots, and
irrigated grass, while the CPER site is an ungrazed natural grass area. To facili-
tate the comparison with temperature, an effective temperature as T
E
= M/C
p
is
calculated.
As shown by Pielke (2001a), in terms of heat content, at 1000 mb, an increase
of 1
C in the dewpoint temperature produces the same change in M asa25
C
increase in temperature. This means, for example, that a decrease of 1
Cof
the dewpoint temperature, but a 1
C increase in the temperature, actually is a
reduction of heat content in terms of J kg
−1
of the air!
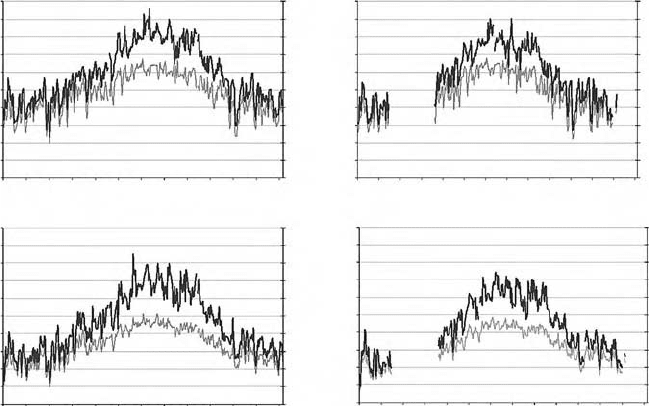
The plots of T and T
E
(with the corresponding values of M and S on the right
axis) for 2002 illustrate that when the absolute humidity is low (such as on cold
winter days), T and T
E
are nearly equal. However, there are large differences in
70
60
50
40
30
20
Temperature (°C)
10
0
–10
–20
–30
1 31 61 91 121 151 181 211 241 271 301 331 361
1 31 61 91 121 151 181
Julian Day
Julian Day
211 241 271 301 331 361
1 31 61 91 121 151 181
Julian Day
211 241 271 301 331 361
1 31 61 91 121 151 181
Julian Day
211 241 271 301 331 361
2.4
2.5
2.6
2.7
2.8
2.9
3.0
3.1
3.2
3.3
3.4
2.4
2.5
2.6
2.7
2.8
2.9
10
5
J
kg
–1
10
5
J
kg
–1
10
5
J
kg
–1
10
5
J
kg
–1
3.0
3.1
3.2
3.3
3.4
2.4
2.5
2.6
2.7
2.8
2.9
3.0
3.1
3.2
3.3
3.4
2.4
2.5
2.6
2.7
2.8
2.9
3.0
3.1
3.2
3.3
3.4
70
60
50
40
30
20
Temperature (°C)
10
0
–10
–20
–30
70
60
50
40
30
20
Temperature (°C)
10
0
–10
–20
–30
70
60
50
40
30
20
Temperature (°C)
10
0
–10
–20
–30
Figure 6.4 T and T
E
in
C(S and M,in10
5
Jkg
−1
) for Fort Collins, Colorado
(left panels) and the CPER ungrazed site (right panels) are shown for 2002. The
top two panels are for maximum daily temperature while the bottom two panels
are for minimum daily temperature. The gray lines represent T (and S) while the
black lines represent T
E
(and M). From Pielke et al. (2004a). © 2004 American
Geophysical Union. Reproduced by permission of the American Geophysical
Union.
108 Other land-use/land-cover changes
these values in the growing season when the absolute humidity is higher. Dry
days, however, have less heat content than more humid days with the same air
temperature.
The average differences of the annual averaged maximum and minimum tem-
perature for the two sites for dates where data were available from both locations
(the value at Fort Collins minus the value at the CPER site) are 025
C and
186
C, respectively. The differences in T
E
, however, are larger (269
C and
420
C).
For the growing season part of 2002, the differences in the average maximum
and minimum value of T were 091
C and 182
C, while the corresponding
difference values of T
E
were 348
C and 496
C. The value of T
E
provides a
more accurate characterization of surface heat content and is the more appropriate
metric for assessing surface air warming.
The different variation of M, as contrasted with S, as a function of land use
could help explain the results reported in Kalnay and Cai (2003), in which they
concluded that land-use change could explain at least part of the observed tem-
perature changes in the eastern United States in recent decades. Davey et al.
(2006) has independently confirmed the robustness of the Kalnay and Cai conclu-
sions. The difference in temporal trends in surface and tropospheric temperatures
(National Research Council, 2000), which has not yet been explained, could be
due to the incomplete analysis of the surface and troposphere for temperature, and
not the more appropriate metric of heat content. Recent analyses of satellite data
have reduced the differences, but have not eliminated the disagreement (Christy
et al., 2003; Mears et al., 2003; Mears and Wentz, 2005; Christy et al., 2006).
This analysis shows that surface air temperature alone does not capture the real
changes in surface air heat content. Even using the limited definition of the term
global warming in order to refer to surface air warming, the moisture content of
the surface air must be included. Future assessments should include trends and
variability of surface heat content in addition to temperature.
A conclusion of Subsection 6.1.1 is that changes in the Earth’s surface can result
in significant changes in the surface energy and moisture budgets. These changes
will influence the heat and moisture fluxes and the surface air heat content.
6.1.2 Boundary-layer effects
Once the surface energy budget is altered, fluxes of heat, moisture, and momentum
within the planetary boundary layer are directly affected (Segal et al., 1989). As
an example, Fig. 6.5 illustrates an idealization of the vertical structure of the
convective boundary layer, where the surface heat flux, H, depth of the layer z
i
,
and the temperature stratification just above z
i
determine the vertical profile of