Castilho Leda R., Moraes Angela Maria (Ed.) Animal Cell Technology: From Biopharmaceuticals to Gene Therapy
Подождите немного. Документ загружается.


there is an urgent need to increase bioprocess efficiency and productivity.
The reduction of cost is essential to insure that animal cell culture remains
competitive compared to alternative technologies such as ribosome display
and transgenic animals. Improvements can be made by a biological
approach, as discussed in Chapter 3, or based on the optimization of
culture conditions. Mathematical modeling is probably the most efficient
technique for the optimization of culture conditions.
The construction of a mathematical model involves the following steps,
as developed by several authors (Engasser et al., 1998; Miller and Reddy,
1998; Bonomi and Schmidell, 2001).
(i) Formulation of kinetic equations. This is probably the most impor-
tant step in developing models because it establishes mathematical
relations between the observed phenomena and the cellular responses.
It depends on several tasks, namely:
– Definition of variables relevant to the process: state variables,
such as cells, substrates, and product concentrations, that
characterize the system studied; and operational variables, that
represent particular conditions of the system, that may be initial
or fixed conditions such as initial concentrations, feeding rates,
etc.;
– Kinetic analysis of experimental data and proposed hypotheses of
the process limitations or inhibitory steps, which correspond to
the identification of the dominant phenomena in the system;
– Selection of mathematical equations able to represent the specific
rates (for growth, product synthesis and substrate consumption)
that can describe the phenomena identified in the previous steps.
(ii) Establishment of mass balances, total and for each component, con-
sidering the operational and state variables. Examples of mass bal-
ances for different operation modes (batch, fed-batch, continuous,
etc.) are presented in Chapter 9. Depending on the defined variables
in the model, it may be necessary to perform energy and momentum
balances.
(iii) Parameter fitting. Mathematical model equations contain state vari-
ables and one or more parameters that are mathematical constants.
This step of model formulation, called parameter fitting, consists in
defining optimal values for these parameters that minimize the
discrepancies between experimental values and the values calculated
through the equations (simulated values).
(iv) Model validation. The applicability of a model comes from its
capacity to predict cell behavior under different culture conditions.
Thus, the procedure for model validation consists of comparative
statistical analysis between real values (experimental) and calculated
values (model simulation). This is an indispensable step to complete
the task of modeling any system.
The crucial step in model building is model formulation, since the
mathematical modeling is intended to represent a large network of multi-
ple biochemical reactions, controlled by complex regulatory processes that
182 Animal Cell Technology
cause cell adaptation to changes in culture conditions. The complexity of
cell metabolism may be treated by different approaches, and both the type
of information needed and the material resources to get it should be taken
into account when modeling.
The systematization of biological data through mathematical modeling
is not a trivial task and requires the intensive use of material and human
resources. Moreover, the models often incorporate experimental uncer-
tainties that do not always allow the identification of the trends of the
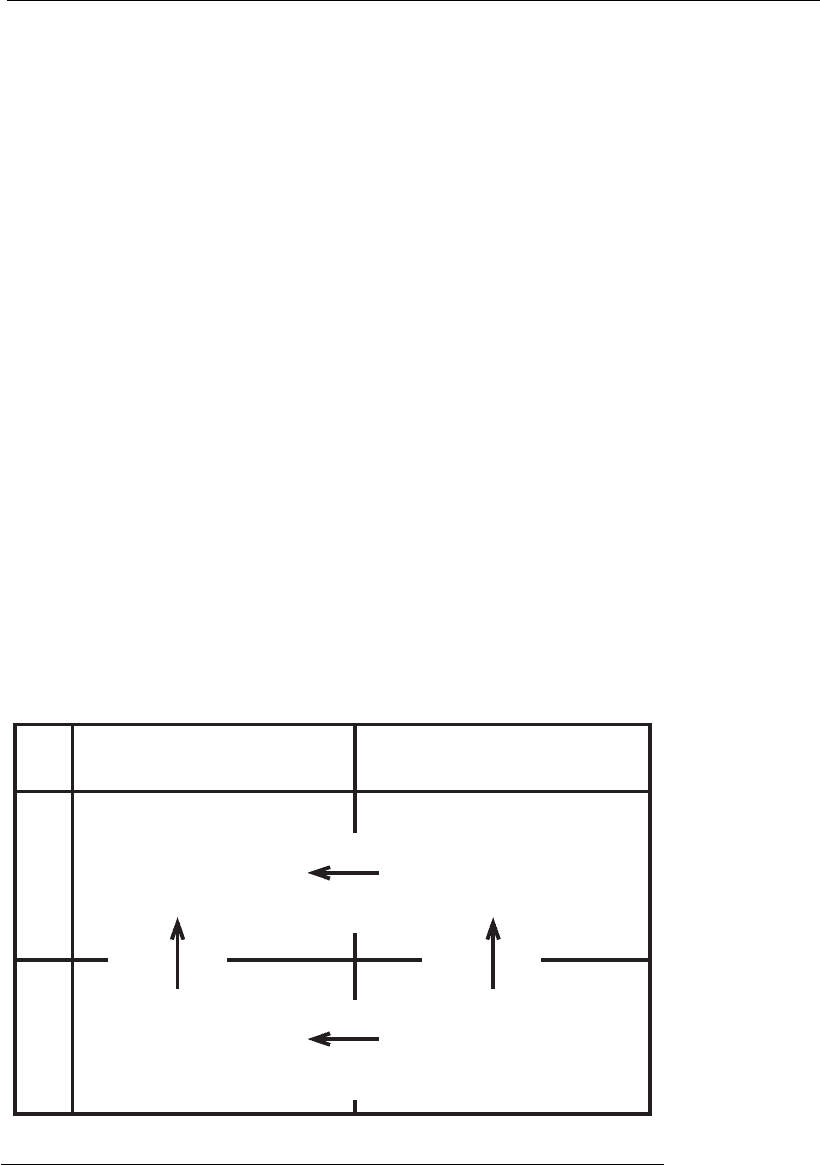
culture, with the desired precision. Figure 8.1 summarizes the main types
of models applied to the description of cellular metabolism, according to
the classification proposed by Tsuchiya et al., (1966).
Unstructured and non-segregated models allow the most simplified
representation of cellular complexity. As indicated in Figure 8.1, in these
models, the entire cell population is represented by only one kind of cell
(the average cell). Differences between cells within the population are not
considered and thus, the cell population is considered homogeneous.
Although an unstructured and non-segregated model includes simplifi-
cations of the cellular complexity, it is often used in culture simulation,
because it is an adequate compromise between the available data, the
difficulties involved in model formulation, and the desired model preci-
sion.
The unstructured and segregated model considers the cell culture as a
heterogeneous population, with individual cells characterized by age,
mass, or size. The variation of properties follows a statistical distribution.
The most concise way to deal with such population heterogeneity is
through a population balance model (PBM). These models can become
mathematically complex because the equations that describe the popu-
lation have to consider that the properties vary in the population and
Balanced
cell
cell
Unstructured Structured
Non-segregated
Segregated
One cell behaves like
others cells, the cell
and the population
are homegeneous
growth
(approximation)
The cell population is
described by one kind of
cell with many intracellular
components, an
heteregeneus cell.
Mean
(approx.)
Mean
(approx.)
The cell population has different
individuals, a heterogeneous
population, but the cell has
intracellular componentes
a homogeneous cell.
no
The cell is a representation of
acellular multicomponents
with different cell by cell.
intr
growth
(approx.)
Balanced
Figure 8.1
Model classification (based on Tsuchiya et al., 1966; Bailey and Ollis, 1986).
Mathematical models for growth and product synthesis in animal cell culture 183
during the time course of cell culture. The mathematical description in a
segregated model is based on partial differential equations, while the non-
segregated model is described entirely by ordinary differential equations.
Although this complexity adds difficulties to the mathematical solution of
the problem, and also to the estimation of model parameters, new
mathematical tools and advances in process monitoring have made possi-
0
40
80
120
160
ALA (mg/L)
0
20
40
60
80
GLY (mg/L)
(F)
0.00
0.01
0.02
0.03
0.04
0.05
(E)
0
10
20
30
40
50
MAb ( g/mL)µ
(C)
0
200
400
600
GLN (mg/L)
0
10
20
30
40
50
NH (mg/L)
4
⫹
(D)
0.E 00⫹
5.E 05⫹
1.E 06⫹
2.E 06⫹
2.E 06⫹
3.E 06⫹
Time (h)
Time (h)
Time (h)
Time (h)
Time (h)
Time (h)
X (cel/mL)
v
0
20
40
60
80
100
Viab (%)
(A)
0
1
2
3
4
5
GLC (g/L)
0
1
2
3
4
5
LAC (g/L)
(B)
0
0
0
0
0
0
20
20
20
20
20
20
40
40
40
40
40
40
60
60
60
60
60
60
80
80
80
80
80
80
µ
X,App
1
(h )
⫺
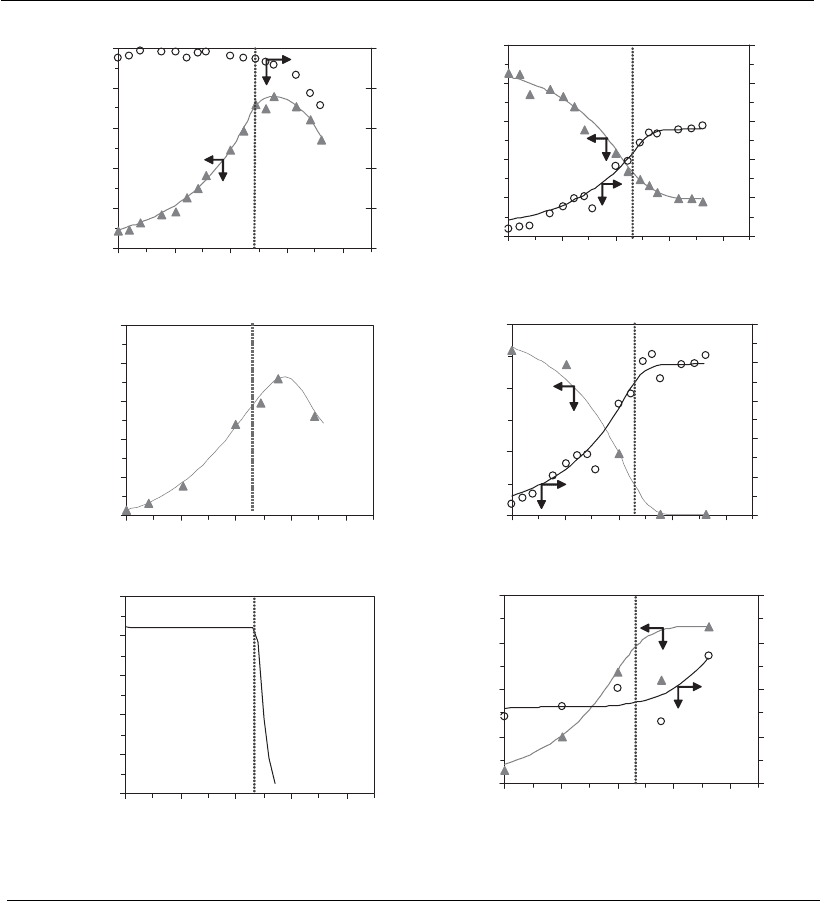
Figure 8.2
Typical kinetic profiles (hybridoma). (A) Cell concentration and viability; (B) glucose consum ption
(GLC) and lactate production (LAC); (C) monoclonal antibody produ ction (mAb); (D) glutamine
consumption (GLN) and ammonium production (NH
4
þ
); (E) specific growth rate (
x
); (F) alanine
(ALA) and glycine (GLY) production. Adapted from Lee (2003). Symbols correspond to the
experimental data and the lines to the manual curve fitting. Vertical lines indicate the instant at
which exponential growth phase ended (
X
,
X,max
).
184 Animal Cell Technology

ble the use of such models, changing the past situation when these models
were restricted to academic research.
The structured and non-segregated model considers the cellular popu-
lation as homogeneous with reference to certain characteristics (age, size,
and mass), however the intracellular structures are discriminated, in such a
way that each cell represents a heterogeneous structure. Thus, it is possible
to characterize with more precision, the cellular state through the know-
ledge of the dynamics of these internal structures and its response to the
environment conditions. The main advantage of the use of these models is
an improved knowledge about the process and, consequently, the capacity
to predict cell adaptation to environmental changes. Certainly, increasing
the number of cell structures results in an increase of the number of
equations and parameters required to describe process dynamics. More-
over, intracellular measurements that require sophisticated methodologies
and equipment are necessary. In the past, the use of this type of model was
restricted to academic research, but in recent years, it has become more
feasible for use in process simulation and evaluation.
The structured and segregated model considers a heterogeneous cell
population and the cell as a heterogeneous structure, thus representing the
diversity of physiological states as well as intracellular structures and the
metabolic pathways associated with each structure. This type of model
represents the complexity occurring in cell culture. Although these models
aim to represent cell growth in a more realistic way, the complexity
involved in the mathematical formulation and in fitting of the parameters
makes their applicability very restrictive.
Depending on the degree of complexity, these models can be very
difficult to solve mathematically. Even with some simplifications, for
instance, separating the cells into discrete populations to avoid infinite
equations that could be generated considering a continuous population
distribution, difficulties in determining the internal characteristic para-
meters may still remain.
The complexity involved in cell structured and segregated models is
increased with the necessity of their integration and can explain why some
authors define the structured and segregated models as the next challenge
for animal cell modeling. These difficulties are reflected by the scarce
number of publications dealing with this integration. This advanced
research field is beyond the scope of this book.
The mathematical modeling of animal cell processes was reviewed by
Tziampazis and Sambanis (1994), Po
¨
rtner and Scha
¨
fer (1996), and Sidoli
et al., (2004). These authors focused on non-structured and non-segregated
models, certainly the most abundant models in literature, and also dis-
cussed the evolution of the use of other models, mainly the structured and
segregated ones.
8.2 Kinetic analysis of bioprocesses
When studying the kinetic behavior of a system, it is necessary to under-
stand how the concentrations of the representative components of the
system (cell, substrate, products, and byproducts) vary with time. Thus,
Mathematical models for growth and product synthesis in animal cell culture 185

the analysis of the change of these variables with time allows the calcula-
tion of some kinetic variables that characterize the system and are the basis
for the identification of the controlling phenomena.
The mathematical modeling of animal cell processes has many elements
in common with the modeling of microbial systems. In fact, many
examples of mathematical modeling discussed in Section 8.3.1 were ini-
tially considered for microorganisms and were later adapted to animal
cells.
Figure 8.2 (see page 184) shows the typical behavior of animal cells in
culture. Cell growth, substrate consumption, and product synthesis pro-
files are very similar to those presented in Chapters 2, 4, and 9, and will be
used to demonstrate the approach to data treatment usually applied to this
kind of process.
Considering that animal cells have high nutritional requirements, the
culture medium is always a complex formulation to insure the adequate
function of catabolism and anabolism (see Chapters 4 and 5). Glucose and
glutamine are precursors for biosynthesis and energy generation pathways,
and are the most highly consumed substrates. In parallel, lactate and
ammonium are synthesized at high rates as byproducts of glucose and
glutamine (or other amino acid) metabolism, respectively. There is also the
possibility of secretion of amino acids (mainly alanine, glycine, and
aspartate) and of commercially attractive products (monoclonal anti-
bodies, mAbs, for example).
8.2.1 Characteristic kinetic variables
The identification of phenomena that explain the behavior of a studied
system depends on the analysis of their kinetic data. Normally, this kinetic
analysis is performed using characteristic variables calculated from the
experimental data. The specific rates and the yield coefficients are the
common values used in this task. When cell concentration data are avail-
able, cell growth and death rates, as well as cell viability, are the best
kinetic variables to characterize the population physiological state. In the
absence of this information – as can occur, for example, with immobilized
cells – the treatment must be based on substrate consumption or on
metabolites production (Miller and Reddy, 1998).
Specific rates
To predict kinetic behavior it is necessary to know the change of the state
variables over time. Thus, it is necessary to determine the characteristic
rates of the system under transformation. The instantaneous cell growth
rate, for example, is defined in Equation 1.
r
X
¼
dX
V
dt
(1)
where:
X
v
¼ viable cell concentration (M L
3
or Cel L
3
);
r
X
¼ cellular growth rate (M L
3
TorCel L
3
T);
t ¼ time (T).
186 Animal Cell Technology

As indicated above, the units defined for the listed variables are given in
the MLT system, except in cases where cell concentration (given for
animal cells as numbers) is involved. M represents mass, L length, and T
time.
Similar equations can be written for the substrate consumption rate (r
S
)
and product synthesis rate (r
P
):
r
S
¼
dS
dt
(2)
r
P
¼
dP
dt
(3)
where:
r
S
¼ substrate consumption rate (M L
3
T
1
);
r
P
¼ product synthesis rate (M L
3
T
1
);
S ¼ substrate concentration (M L
3
);
P ¼ product concentration (M L
3
).
The instantaneous rates are necessary for the characterization of the
cellular activities but may not be sufficient. This occurs because during a
specific interval of time, the concentration of cells can vary significantly,
and this may affect transformation rates. Therefore the specific growth
rate is defined as a characteristic rate of the population. The specific
growth rate is calculated from the cellular growth rate divided by the
cellular concentration, and can be represented by the Equation 4 (Miller
and Reddy, 1998; Hiss, 2001):
X
¼
1
X
V
dX
V
dt
¼
1
X
V
r
X
ðÞ
(4)
where:
X
¼ specific growth rate (T
1
).
The specific growth rate can be calculated from cellular concentration
data if the cell viability is sufficiently high. When the cell death rate is
significant, the value obtained from Equation 4 is in fact an ‘‘apparent’’
specific rate, since the measured values in the laboratory are determined as
a balance between growth and death. The apparent rate is related to the
true specific growth rate by the following equation:
ap
X
¼
X
k
d
(5)
where:
ap
X
¼ apparent specific growth rate (T
1
);
k
d
¼ specific cell death rate (T
1
).
The specific death rate can be obtained directly from viable and dead
cell concentrations (Equation 6).
k
d
¼
1
X
v
dX
d
dt
(6)
where:
X
d
¼ dead cell concentration (M L
3
or Cel L
3
).
Mathematical models for growth and product synthesis in animal cell culture 187
The methodology normally used for the determination of dead cell
concentrations is the dye exclusion method (Freshney, 1994), although this
is not adequate in cases in which cellular lysis is significant. In these
situations, other methodologies must be adopted to determine the amount
of lysed cells, such as, for example, the measure of the lactate dehydrogen-
ase concentration (LDH) in the culture medium (Freshney, 1994; Miller
and Reddy, 1998).
It is possible define the specific substrate consumption rate (Equation 7)
and specific product synthesis rates (Equation 8) in a similar way to the
specific growth rate.
S
¼
1
X
V
dS
dt
¼
1
X
V
(r
S
) (7)
where:
S
¼ specific substrate consumption rate
(M M
1
T
1
or M Cel
1
T
1
);
P
¼
1
X
V
dP
dt
¼
1
X
V
r
P
ðÞ
(8)
where:
P
¼ specific product synthesis rate (M M
1
T
1
or M Cel
1
T
1
).
Yield coefficients
The yield coefficients that measure the substrate conversion into cells and
substrate conversion into products are also excellent variables for the
characterization of the system, as well as to follow the metabolic changes
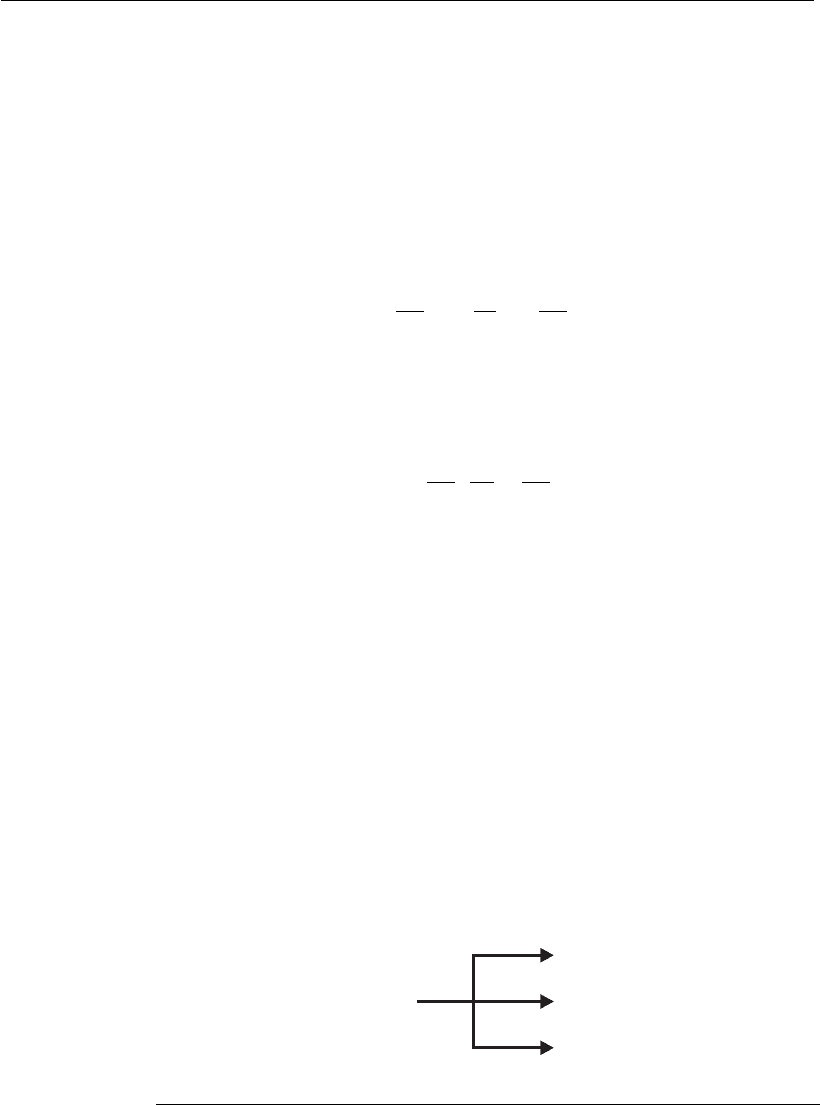
of the culture. The substrates are consumed to form cells and products (or
byproducts), and to generate energy. These conversions have characteristic
parallel reactions, as substrate consumption (S) leads to many ‘‘products’’,
that is, cells, products, and byproducts (Figure 8.3).
The substrate-to-cells or substrate-to-products yield coefficients can be
calculated in an interval of time ˜t, as indicated by Equations 9 and 10.
Substrate (S)
Cells (X)
Product (Pi)
Energy (ATP)
S
X
S
Pi
S
ATP
Figure 8.3
Simplified schema of the substrate partition between metabolic pathways;
catabolism (used for ATP and ADP synthesis) and anabolism (for biomass
synthesis). The quantities S
Pi
indicate the fraction of S destined to formation of the
product ‘‘i’’.
188 Animal Cell Technology

Y
X=S
¼
˜X
˜S
X
(9)
where:
Y
X=S
¼ substrate-to-cells yield coefficient (or factor)
(M M
1
or Cel M
1
);
˜X ¼ cellular concentration variation in the time interval ˜t
(M L
3
or Cel L
3
);
˜S
X
¼ substrate consumption for cell formation in time interval ˜t
(M L
3
).
Y
P=S
¼
˜P
˜S
P
(10)
where:
Y
P=S
¼ substrate-to-product yield coefficient (or factor) (M M
1
);
˜P ¼ product concentration variation in the time interval ˜t(M L
3
);
˜S
P
¼ substrate consumption for the product formation in the time
interval ˜t(M L
3
).
If the final destination of the substrate is unique, the yield coefficient (to
cell or products) is a stoichiometric constant that relates reagents to
‘‘products.’’ However, it is frequent that the substrate forms more than
one substance (for example, glucose may be converted to cells and lactate),
or that a specific product comes from distinct substrates (for example,
lactate formed from glucose and glutamine). In these cases, the calculation
of the real conversion factors is only possible when a labeled reagent is
used, allowing the identification of the reagent destination in the metabolic
pathway. In practice, global yield coefficients are often calculated from
total substrate consumption and the total ‘‘products’’ formed, as indicated
in Equations 9 and 10. Instantaneous yields coefficients Y
X=S
and Y
P=S
can
be calculated as a relation between substrate consumption rate and
‘‘products’’ formation rate, as indicated in Equations 11 and 12.
Y
X=S
¼
r
X
r
S
¼
X
S
(11)
Y
P=S
¼
r
P
r
S
¼
P
S
(12)
Finally, oxygen consumption per unit of substrate (Equation 13) is a
factor that helps in understanding the metabolic pathways utilized by the
cells and, therefore, it is useful in system analysis. This not exactly a yield
coefficient, because it establishes a relation of consumption between two
substrates. Similarly, other relations, not exactly yield coefficients (for
example, Y
LAC=X
;Y
NH3=X
, etc.), can be calculated and utilized for system
characterization.
Y
O
2
=S
¼
O
2
S
(13)
where:
Y
O
2
=S
¼ oxygen consumption per unit of substrate factor (M M
1
);
Mathematical models for growth and product synthesis in animal cell culture 189

O
2
¼ specific oxygen consumption rate
(M M
1
T
1
or M Cel
1
T
1
).
8.2.2 Data treatment
The treatment of experimental data is an essential activity to calculate
precise kinetic variables in the equations above. The quality of the kinetic
analysis, the identification of relevant phenomena and, subsequently,
model parameter fitting, are directly dependent on the initial data.
This section discusses treatment of experimental data, especially for
conditions where state variables change over time. These are the most
difficult data to treat and correspond to cultures from batch, fed-batch, or
any continuous transient phase. In continuous steady state, the state
variables and rates values do not alter with time, and the rate calculation
results from the algebraic equation solution.
The experimental error is also relevant to data treatment, and will also
be considered in this section. The extent of the analytic error depends on
various factors including the type of methodology adopted, operator
training, and inoculum protocols. The errors are relatively high in bio-
logical systems: for example, 10–30% for proteins concentration; 7–10%
for cells concentration and viability (especially at low viability); 2–5% for
liquid chromatography measures (glucose, lactate, amino acids) (Po
¨
rtner
and Scha
¨
fer, 1996; Miller and Reddy, 1998).
The experimental error of measurements from batch processes is nor-
mally higher than those obtained from a stationary state in processes
conducted in a continuous mode, simply because, in batch, variations in
culture conditions occur during the whole process. In a stationary state of
a continuous process, the kinetic variables are calculated from state
variable average values.
It is always possible to calculate the kinetic variables directly from the
experimental data. However, the values of kinetic variables are of higher
quality when the errors are attenuated and identified before employing the
treatment data methods.
This attenuation can be made by smoothing methods that allow data
extrapolation, if the number of experimental points is reduced. The
smoothing methods should also allow rate calculation from these points.
The most commonly used smoothing techniques of experimental data are
presented below.
(i) Manual smoothing of the experimental data, which implies tracing
an average curve with experimental points based on previous know-
ledge of the system. Subsequently, the smoothed curve is read,
creating a data table (variable ¼ f(time)).
(ii) Simple mathematical function fitting – linear, logarithmic, or poly-
nomial with low degree regressions. This can be sufficient to obtain
smooth experimental data. By applying the minimal quadratic meth-
od, it is possible to fit any of these functions, minimizing the
difference between real data and those simulated by functions. This is
a relatively easy task, since these functions are available in various
commercial software products. Although it is difficult to represent
190 Animal Cell Technology

the entire culture profile by one curve, it is always possible to fit
different functions to the various phases of culture (iii and iv below).
(iii) Mathematical function fitting by stepwise changes. This approach
aims to represent the growth phase by stepwise changes of functions.
The ‘‘spline’’ method, for example, consists of a series of low degree
polynomial regressions, which fit a low number of experimental
points (3 to 4 points) each time, ensuring continuity between the
various polynomial functions (Lancaster and Salkauskas, 1986).
(iv) A mixed approach combines the smoothing of experimental data,
based on previous knowledge of the system (i), and mathematical
function fitting (linear regression, logarithmic, polynomial, spline,
etc.), as outlined in (ii) and (iii) above.
Once the experimental errors are attenuated, data are prepared for the
calculation of kinetic variables. Frequently, it is necessary to determine the
rates (Equations 4 to 8), and the possible approaches are:
(v) the derivation of mathematical functions fitted, as proposed in (ii) and
(iv) above;
(vi) the calculation of derivatives employing geometrical methods, as Le
Duy and Zajic (1973), applied to experimental smoothed data (Hiss,
2001).
The determination of these rates allows the direct calculation of instan-
taneous yield factors, as in Equations 11 and 12. This form of calculation is
employed whenever these factors change during the cultivation time.
Alternatively, it is possible to determine yield factors by linear regression
of ‘‘product’’ concentration (cell, byproducts, or product) as a function of
the substrate concentration.
8.2.3 Phenomena identification
A lot of effort as regards phenomena identification is based on specific
growth rate analysis. In Chapter 2, cell growth and division were proposed
in three phases, based on values of specific growth rates. The number of
steps observed in a culture depends on each system, that is, some steps
may not exist or have an insignificant duration under some conditions.
A lag (or latent or adaptation) phase can occur at the beginning of
culture during which no growth occurs, followed by an acceleration phase,
a period in which the specific growth rate varies until reaching a maximum
value. The analysis of this initial behavior can reveal any problems
connected with preparation of inocula, as well as any substrate inhibition.
The other typical situation is that shown in Figure 8.2E, in which the
X
is maximum from the beginning of culture. During the exponential growth
phase, the specific growth rate remains at the maximum value (
X,max
) until
any nutritional limitation or inhibition by toxic products alters cell
growth. Thus, a specific growth rate reduction can be observed.
The behavior analysis of the other state variables (substrates and
product concentrations), at the same time as the
X
decrease, can indicate
the cause of the metabolism change. For the case exemplified in Figure 8.2
it can be observed that at 47 hours (end of exponential phase) the
Mathematical models for growth and product synthesis in animal cell culture 191