Buschow K.H.J. (Ed.) Concise Encyclopedia of Magnetic and Superconducting Materials
Подождите немного. Документ загружается.

where V
0
is the volume of unit cell, index j numerates
the branches of the dispersion relation _o
j
ð
~
qÞ;
~
q is
the phonon momentum, and the integral is taken
within the first Brillouin zone. The detailed theory of
nuclear inelastic scattering has been published by
several authors (Singwi and Sjo
¨
lander 1960; Kohn
et al. 1998, Sturhahn and Kohn 1999).
From the density of phonon states other
(thermo)dynamic quantities can be derived as the vi-
brational contribution to the internal energy, lattice
specific heat at constant volume and pressure, vibra-
tional entropy. From the sum rules (Lipkin 1999) the
density of phonon states, f
LM
and the mean square
displacement, the mean kinetic energy, the mean
force constant, and the second order Doppler shift
can be determined.
In summary, NIS gives direct access to the density
of phonon states and various (thermo)dynamic quan-
tities. It is complementary to methods as inelastic
neutron, x-ray, and light scattering. In those tech-
niques mainly dispersion relations which are fitted to
a model are measured and in a final step the density
of phonon states can be derived.
2. Applications
2.1 Applications to High Pressure
High-pressure applications are one of the domains
which benefit most from the outstanding properties
of synchrotron radiation. The small beam size allows
one to work with samples much smaller than 100 mm
in diameter. In that case state-of-the-art diamond
anvil cells (DAC) are able to reach pressures far
above the 100 GPa regime, those pressures which are
common in the center of the Earth. The small diver-
gence of the beam allows sophisticated sample envi-
ronments, in situ pressure calibration and diffraction
studies for the determination of the induced volume
change with pressure. In the following example iron
metal has been investigated by NFS and NIS in order
to follow over the pressure-induced phase transition
magnetic order (via the hyperfine field) and structural
dynamics (via the partial phonon DOS).
(a) Iron metal
Recently, the high-pressure behaviour of iron gained
much interest due to unusual superconductivity and
due to simulations of the inner core of the Earth and
improved technical developments in high-pressure
research. It is well known that a-iron undergoes un-
der pressure a magnetic and structural phase transi-
tion to the hexagonal closed-packed (h.c.p.) phase of
iron (e-iron) in the pressure range of 10–22 GPa at
ambient temperature.
A 2.5 mm thick iron foil enriched to 95% in
57
Fe
was pressurized in a DAC (Gru
¨
nsteudel 1997).
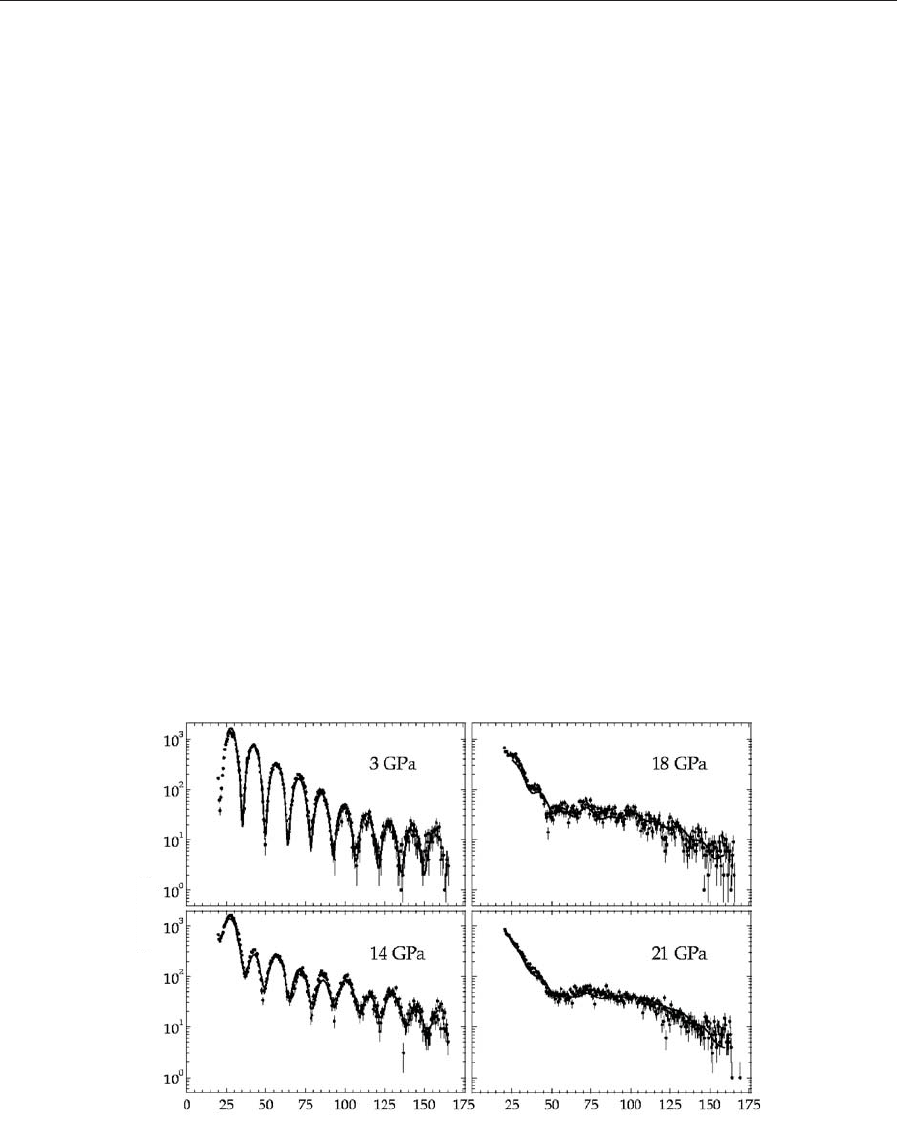
Figure 5 shows the NFS spectra for various pres-
sures. A small external magnetic field (0.6 T) aligned
the internal field perpendicular to the incoming wave
vector k
!
and the polarization
~
E (the case discussed
in Fig. 3a). At 3 GPa the spectrum reveals iron in the
pure a-phase. The regular quantum beat pattern
shows a single frequency from which a hyperfine field
Time after excitation (ns)
Intensity
Figure 5
Time spectra of NFS from the pressure induced a-e transition in Fe at various pressures (from Gru
¨
nsteudel 1997).
1000
Nuclear Resonance Scattering
of 32.4 T can be derived. Taking into account the
polarizing external field of 0.6 T the internal field be-
comes 33.0 T (in case of iron the external and internal
field align antiparallel). At 14 GPa the influence of the
e-phase is already quite pronounced. With a further
increase in pressure the influence of the nonmagnetic
e-phase becomes dominant. At 21 GPa the sample is
almost completely in the e-phase. Now the NFS
spectrum is modified only by a single Bessel minimum
at 50 ns which originates from the increased effective
thickness in comparison to that of the magnetically
split one.
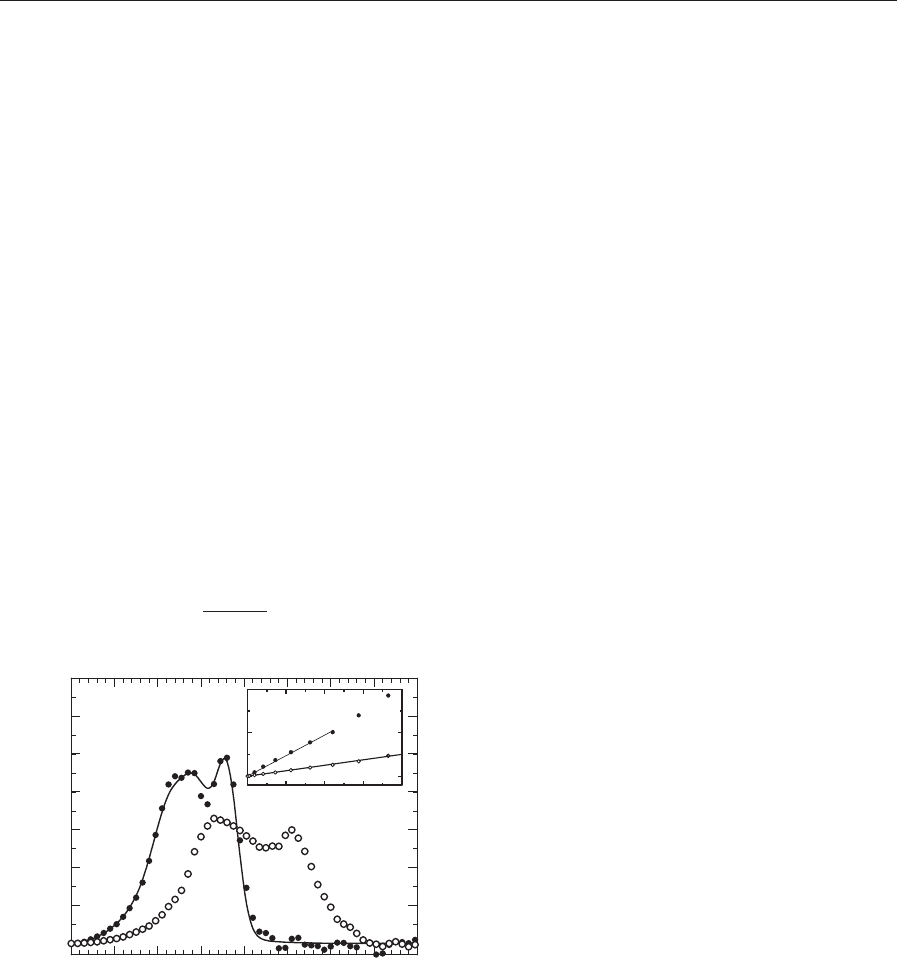
With the same sample, NIS spectra have been re-
corded and the densities of phonon states have been
extracted (Lu
¨
bbers et al. 2000b). Examples at ambi-
ent pressure and at 42 GPa are displayed in Fig. 6. All
spectral features of the density of phonon states of
e-Fe are shifted to higher energies with respect to
a-Fe revealing a hardening of the lattice vibrations.
Several thermodynamical properties have been
derived as f
LM
and the mean-square displacement,
respectively, the mean phonon energy and the corre-
sponding Debye temperature, the lattice contribution
to the specific heat c
V
, the internal energy, entropy,
and the mean force constant. Finally, from the low-
energy part of the density of phonon states the
average velocity of sound v
av
(Fig. 6 inset) has been
derived according to the relation
gðEÞ¼
V
2p
2
_
3
v
3
av
E
2
ð10Þ
with V the volume per Fe atom. Extensions to higher
pressures have been reported (Mao et al. 2001) and
investigations undertaken to account for anisotropies
(Lu
¨
bbers et al. 2000a). These sound velocity data
have been complemented by recent data-from inelas-
tic x-ray scattering and in the very high-pressure
regime by those from shock waves and in the low-
pressure regime by those from neutron scattering.
2.2 Applications to Nano-structured Material
The understanding of magnetism of self-organized
nano-structures and clusters gained much attention
because of fundamental aspects of nanoscale magnetic
ordering in general and possible applications in high-
density magnetic storage and magnetoelectronics.
(a) Iron on W (110)
As an example the perpendicular spin orientation in
ultrasmall Fe islands on W (110) will be discussed
(Ro
¨
hlsberger et al. 2001). Ultrasmall pseudomorphic
Fe islands on an atomically clean W (110) crystal have
been prepared by thermal evaporation of Fe enriched
to 95% in
57
Fe. The coverage of the Fe islands was
0.57 which is slightly below the percolation limit.
Their average diameter was determined to be 2.0 nm.
A coating of five monolayers of Ag prevents the sam-
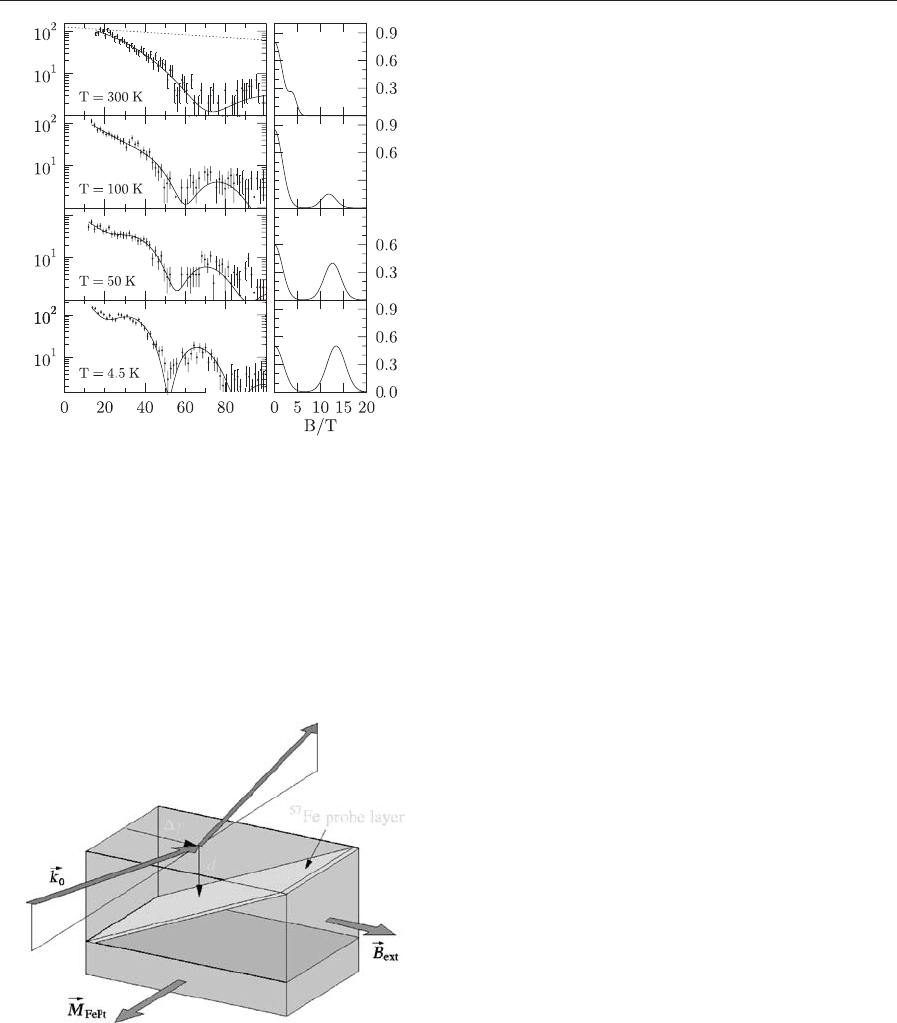
ple from contamination. Figure 7 left panel displays
the time spectra taken in grazing incidence geometry
between 300 K and 4.5 K. The right panel of Fig. 7
shows the determined weight of the magnetic compo-
nent. It increases with decreasing temperature. This
can be attributed to superparamagnetic relaxation of
the magnetic moments. At high temperatures the
magnetization of small particles is subject to fast
thermal fluctuations so that the effective magnetic
hyperfine field averages to zero. The transition from
the fast relaxation regime to the magnetically ordered
state occurs at about 50 K. However, it is a very broad
transition certainly due to the size distribution of the
islands. The modulation in the time spectra is char-
acteristic for a perpendicular magnetization. This re-
sult is quite remarkable because Fe films on W (110)
are known to be magnetized in-plane for coverages of
more than 0.6.
(b) Exchange-coupled thin films
Exchange-coupling between soft- and hard-magnetic
phases (see Multilayers: Interlayer Coupling) plays
an important role in the engineering of novel func-
tional magnetic nanostructures. There exist some
micromagnetical models describing this behavior
(see Magnets: Remanence-enhanced), however, due
to methodological difficulties there exist nearly no
direct measurements of the actual spin structure.
Utilizing the technique of probe layers, i.e., inserting
57
Fe in various depths of the thin film (see Fig. 8),
0 50 100 150 200
E
2
(meV
2
)
g(E)/(1/meV)
g (E)
0
10 20 30 40 50
60
70 80
Energy (meV)
0.0
0.01
0.02
0.03
0.04
0.05
0.06
0.07
Figure 6
Phonon density of states from the pressure induced a-e
transition in Fe at ambient pressure (solid circles) and
42 GPa (open circles). The solid line represents the DOS
from neutron scattering. The inset displays the
corresponding low energy part for the determination of
sound velocities. Here the solid lines represent a linear fit
to the data (reprinted with permission from Lu
¨
bbers
et al. (2000b); r AAAS).
1001
Nuclear Resonance Scattering
NRS directly probes the actual spin structure in var-
ious depths by selectively exciting the
57
Fe layer at
various lateral positions (Ro
¨
hlsberger et al. 2002).
The sample investigated here is a bilayer system con-
sisting of 11 nm Fe on 30 nm Fe
55
Pt
45
in the hard-
magnetic tetragonal L1
0
phase. A wedge-shaped
0.7 nm thick
57
Fe film with a slope of 0.5 nm/mm
has been produced. Different depths d in the sample
can thus be probed by adjusting the displacement Dy
of the sample transversely to the incident beam. The
sample was magnetically saturated in an external field
of 2.3 T so that the remanent magnetization
~
M
FePt
of
the Fe
55
Pt
45
layer was oriented along
~
k
0
, as shown in
Fig. 8. Time spectra at 4 K with selected in-plane ex-
ternal fields
~
B
ext
perpendicular to
~
k
0
were taken at
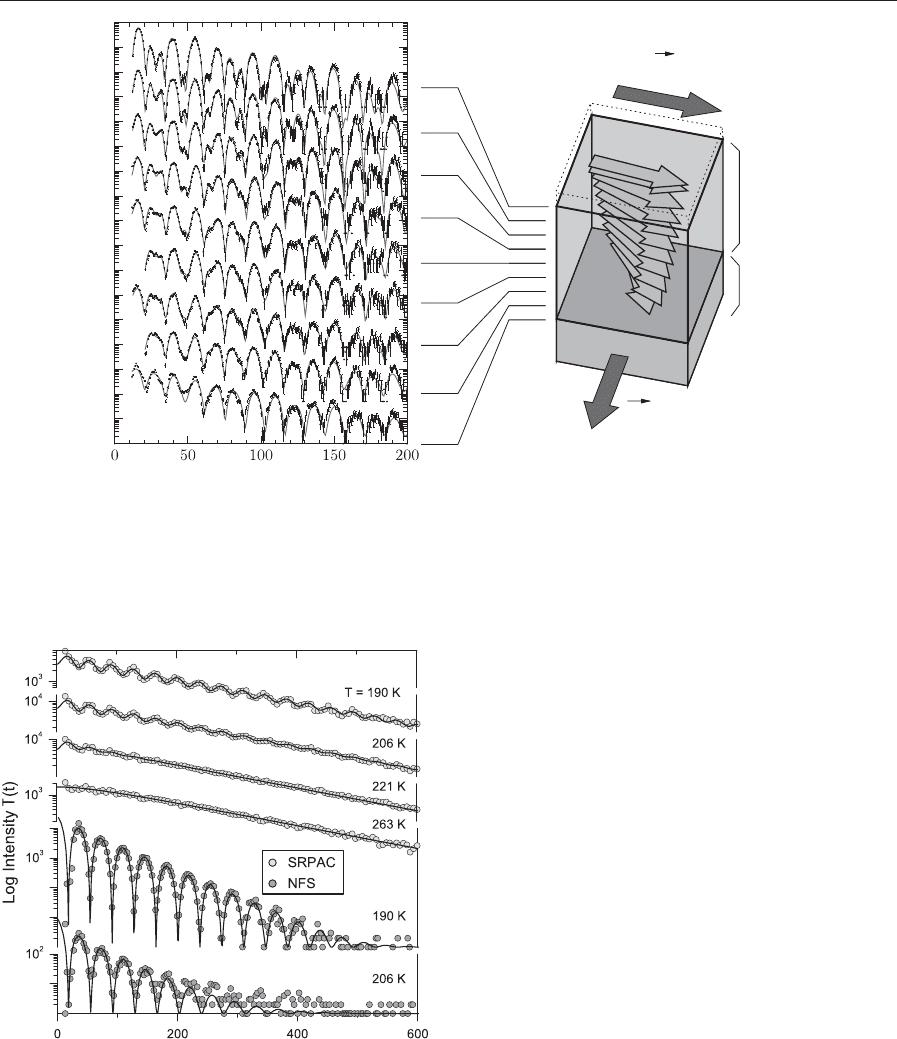
various displacements of Dy. Evaluation of the spec-
tra reveals the depth dependence of the rotation of
the magnetization in the Fe film (see Fig. 9).
2.3 Applications to Disordered Systems
NRS techniques are well suited for the investigation
of the dynamics of disordered systems over a huge
timescale. Whereas NIS covers the fast regime of
phonons, NQES techniques complement the investi-
gations to the slow time regime (10
5
–10
10
Hz). The
technique of probe molecules allows for the investi-
gation of glasses which do not contain Mo
¨
ssbauer
atoms and, furthermore, when carefully chosen, al-
lows for mode selectivity as collective and noncollec-
tive modes, respectively. In the following example, the
glass forming dibutyl phthalate (DBP), with a glass
temperature T
g
¼178 K, was investigated by NFS
(sensitive to translational and rotational dynamics)
and SRPAC (sensitive only to rotational dynamics)
(Sergueev et al. 2003). Ferrocene was used as probe
molecules. NFS spectroscopy is applicable as long as
the Lamb–Mo
¨
ssbauer factor f
LM
is greater than zero,
which holds in this case up to 210 K. SRPAC, on the
other hand, does not depend on f
LM
and can be ap-
plied in the entire temperature regime (see Fig. 10). At
the lower temperatures, the SRPAC intensity follows
an exponential decay modulated by quantum beats.
In the regime of slow relaxation, the beats are damped
at a rate proportional to rotational relaxation (see
Eqn. (4)). Similar quantum beats modulate the decay
of the NFS intensity, where the damping depends on
the sum of rotational and translational relaxation (see
Eqn. (2)). At higher temperatures, in the regime of
fast relaxation, only SRPAC spectra can be measured.
From these spectra relaxation rates have been deter-
mined. Below 190 K the data sets from both tech-
niques coincide, which means that translational
dynamics is absent in the experimental time window.
Above 190 K the NFS data begin to deviate from
the SRPAC data because translational dynamics is
activated. From these results the pure translational
relaxation rates have been derived.
Figure 8
Scattering geometry of the sample (11 nm Fe on FePt).
The incoming x-ray beam with wavevector
~
k
0
impinges
the sample at a lateral position Dy probing the spin
structure via the wedge-shaped
57
Fe probe layer (0.7 nm)
at depth d (reprinted figure with permission from
Ro
¨
hlsberger et al. (2002); r by the American Physical
Society).
Wei
g
ht
Counts
Time (ns)
Figure 7
Time spectra of nuclear resonant grazing-incidence
reflection from ultrasmall
57
Fe islands on W (110). The
modulation of the intensity is attributed to a
perpendicular magnetization of the Fe islands. The solid
lines are the results of simulations. The right panel
displays the probability density for the hyperfine field
distribution that was obtained from the simulations
(reprinted figure with permission from Ro
¨
hlsberger et al.
(2001); r by the American Physical Society).
1002
Nuclear Resonance Scattering
2.4 Summary
With the advent of powerful synchrotron radiation
sources around the world as APS (Argonne, USA),
SPring-8 (Harima, Japan), and ESRF (Grenoble,
France) nuclear resonance scattering techniques be-
came a rapid growing spectroscopy with unique ap-
plications in various fields. The probe molecule/layer
technique, the application of sophisticated sample
environments, and the possibility of applying various
NRS techniques simultaneously makes this spectro-
scopy a unique tool. The previous typical examples
demonstrate the versatility and huge potential of the
technique. Even when these examples focused on
57
Fe
for the sake of simplicity the tunable (in energy) syn-
chrotron radiation allows for a convenient and rou-
tine access to various Mo
¨
ssbauer isotopes.
See also: Magnetism: Applications of Synchrotron
Radiation; Magnetic Excitations in Solids
Bibliography
Chumakov A I, Ru
¨
ffer R, Gru
¨
nsteudel H, Gru
¨
nsteudel H F,
Gru
¨
bel G, Metge J, Leupold O, Goodwin H 1995 Energy
dependence of nuclear recoil measured with incoherent
nuclear scattering. Europhys. Lett. 30, 427–30
2
4
6
8
10
12
0
16
14
11 nm Fe
FePt
∆y (mm)
3 nm Ag
M
FePt
B
ext
Time (ns)
Log (Intensity)
Figure 9
Left panel: Time spectra of nuclear resonant grazing-incidence reflection from the probe layer (
~
B
ext
¼ 160 mT and at
4 K). Right panel: Image of the derived spin structure (blue arrows) of the iron layer (reprinted figure with permission
from Ro
¨
hlsberger et al. (2002); r by the American Physical Society).
Time
(
ns
)
Figure 10
Time spectra of SRPAC and NFS for several
temperatures from ferrocene in DBP. The solid lines
show the fit according to the full theory (from Sergueev
et al. 2003).
1003
Nuclear Resonance Scattering

Chumakov A I, Sturhahn W 1999 Experimental aspects of in-
elastic nuclear resonance scattering. Hyperfine Interactions
123/124, 781–808
Dattagupta S 1976 Effect of molecular motions in liquids on
Mo
¨
ssbauer relaxation spectra. Phys. Rev. B 14, 1329–32
Gerdau E, de Waard H (eds.) 1999/2000 Nuclear Resonant
Scattering of Synchrotron Radiation. Baltzer Science Pub-
lishers
Gerdau E, Ru
¨
ffer R, Winkler H, Tolkdorf W, Klages C,
Hannon J P 1985 Nuclear Bragg diffraction of synchrotron
radiation in yttrium iron garnet. Phys. Rev. Lett. 54, 835–8
Gru
¨
nsteudel H 1998 Nuclear Resonant Scattering of Synchro-
tron Radiation on Iron Containing Biomimetic Compounds.
PhD thesis, Medizinische Universia
¨
tzuLu
¨
beck, Lu
¨
beck
Gru
¨
nsteudel HF 1997 Der a-e-U
¨
bergang in Eisen als Beispiel fu
¨
r
nukleare Vorwa
¨
rtsstreuung von Synchrotronstrahlung an Pro-
ben unter hohem Druck. PhD thesis, Universia
¨
t Paderborn,
Paderborn
Kohn V G, Chumakov A I, Ru
¨
ffer R 1998 Nuclear resonant
inelastic absorption of synchrotron radiation in an aniso-
tropic single crystal. Phys. Rev. B 58, 8437–44
Leupold O, Rupprecht K, Wortmann G 2003 Electronic and
magnetic transitions in europium compounds studied by nu-
clear forward scattering of synchrotron radiation. Structural
Chemistry 14, 97–107
Lipkin H J 1999 Mo
¨
ssbauer sum rules for use with synchrotron
sources. Hyperfine Interactions 123/124, 349–66
Lu
¨
bbers R, Giefers H, Rupprecht K, Wortmann G, Chumakov
A I 2000a High-pressure phonon spectroscopy of oriented
hcp iron. ESRF Highlights 2000, 48–9
Lu
¨
bbers R, Gru
¨
nsteudel H F, Chumakov A I, Wortmann G
2000b Density of phonon states in iron at high pressure.
Science 287, 1250–2
Mao H K, Xu J, Struzhkin V V, Shu J, Hemley R J, Sturhahn
W, Hu M Y, Alp E E, Vocadlo L, Alfe
´
D, Price G D, Gillan
M J, Schwoerer-Bo
¨
hning M, Ha
¨
usermann D, Eng P, Shen G,
Giefers H, Lu
¨
bbers R, Wortmann G 2001 Phonon density of
states of iron up to 153 gigapascal. Science 292, 914–6
Ro
¨
hlsberger R, Bansmann J, Senz V, Jonas K-L, Bettac A,
Leupold O, Ru
¨
ffer R, Burkel E, Meiwes-Broer K-H 2001
Perpendicular spin orientation in ultrasmall Fe islands on
W(110). Phys. Rev. Lett. 86, 5597–600
Ro
¨
hlsberger R, Thomas H, Schlage K, Burkel E, Leupold O,
Ru
¨
ffer R 2002 Imaging the magnetic spin structure of ex-
change-coupled thin films. Phys. Rev. Lett. 89, 237201
Sergueev I, van Bu
¨
rck U, Chumakov A I, Asthalter T, Smirnov
G V, Franz H, Ru
¨
ffer R, Petry W 2003 Rotational and
translational dynamics studied by nuclear resonant scatter-
ing. ESRF Highlights 2003, 12–3
Seto M, Yoda Y, Kikuta S, Zhang X, Ando M 1995 Obser-
vation of nuclear resonant scattering accompanied by pho-
non excitation using synchrotron radiation. Phys. Rev. Lett.
74, 3828–31
Singwi K, Sjo
¨
lander A 1960 Resonance absorption of nuclear
gamma rays and the dynamics of atomic motions. Phys. Rev.
120, 1093–102
Sturhahn W, Kohn V G 1999 Theoretical aspects of incoherent
nuclear resonant scattering. Hyperfine Interactions 123/124,
367–99
Sturhahn W, Toellner T, Alp E E, Zhang X, Ando M, Yoda Y,
Kikuta S, Seto M, Kimball C, Dabrowski B 1995 Phonon
density of states measured by inelastic nuclear resonant scat-
tering. Phys. Rev. Lett. 74, 3832–5
R. Ru
¨
ffer
ESRF, Grenoble, France
1004
Nuclear Resonance Scattering
Optical and Magneto-optic Data Storage:
Channels and Coding
The data path of an optical recording system is ef-
fectively a communications channel with certain
bandwidth and noise characteristics. Data to be re-
corded must pass through this channel and, on re-
play, must emerge unaltered. The vehicle to navigate
the data through the channel is a recording code (also
known as a modulation code or channel code). The
recording code converts data to an appropriate for-
mat to pass through the channel and be recovered as
the original data on replay.
The frequency response of the channel falls off
sharply at high frequencies. Therefore, if the signal
representing ‘‘raw’’ data contains high-frequency
components then these will not be recorded. Because
the binary data to be recorded cannot be predicted it
is likely that the signal representing the data contains
a broad spectrum of frequencies ranging from very
low to very high. Consequently, the recording code
converts the frequency spectrum of the signal to be
recorded to a form that matches the response of the
recording channel.
An important function of a recording code is to
enable the regeneration of a timebase for effective
re-timing of the signal during playback. There will
be differences between the speed of the disk during
record and playback. It is essential, therefore, to
have a timebase signal that is accurately synchro-
nized to the rate at which data are read from the
disk. In effect, the recording code combines the data
to be recorded with a clock signal on recording. At
replay the clock signal is extracted and used to con-
trol a phase-locked-loop circuit that provides the
timebase.
For a given channel bandwidth the correct choice
of code can increase storage density above that of an
uncoded system. A common coding technique is
‘‘non return to zero immediate’’ (NRZI): binary one
is represented as a signal-level transition and zero as
no transition. However, there is a limit to how close
transitions can be packed together in an attempt to
increase storage density. Too close and their mutual
proximity begins to affect the ability of the detection
scheme to resolve them. The recording code intro-
duces constraints that define the separation of tran-
sitions. Consequently, for a given track length, a
greater number of code bits can be stored compared
to data bits. Although it takes more code bits to rep-
resent a given number of data bits, i.e., the code rate
is less than one, the result is a higher data-recording
density.
1. Bandwidth
The upper cut-off frequency of an optical-disk
channel is a function of the laser wavelength (l),
the track velocity (v) and the numerical aperture
(NA) and is given by 2NAv/l, (Heemskerk and Im-
mink 1982). Since the laser-spot diameter (D), is
equal to 0.5 l/NA (Bouwhuis et al. 1985) the cut-off
frequency becomes v/D. The number of bits that can
be stored on a disk depends on the size of the laser-
spot and is approximately equal to nA/D
2
, where A is
the area of the disk and n is the number of bits
that can be resolved within the spot. This latter var-
iable can be maximized through proper selection of
recording code.
Whilst, in principle, the channel response extends
down to d.c. it is prudent to limit its response at the
lower frequencies. This minimizes the adverse effect
that the low-frequency power components in the re-
played signal may have on the laser servo system.
Also, to reduce the effect of disk-surface blemishes,
which can detrimentally affect the replay signal, it is
necessary to employ a high-pass filter in the replay
channel that removes the lower frequencies. Other
considerations are the use of transformers, which do
not pass d.c. levels, in the replay channel.
2. d, k Constraint
One function of the code is to ensure that there are
never long periods of time during which there are no
transitions or that transitions do not occur too close
together. These codes are classed as run-length lim-
ited (RLL).
The minimum distance between two transitions is
the d constraint, whilst maximum distance is k. The d
and k values determine the performance of the code.
Ideally d should be low to permit high-density re-
cording but, given a finite laser-spot size, d cannot be
so low that it cannot be resolved. Also, intersymbol
interference (ISI) and inter-track cross-talk increase
with reducing d. The constraint value k cannot be too
large since frequent changes in the replayed signal are
necessary to synchronize a timebase that re-times the
replayed data.
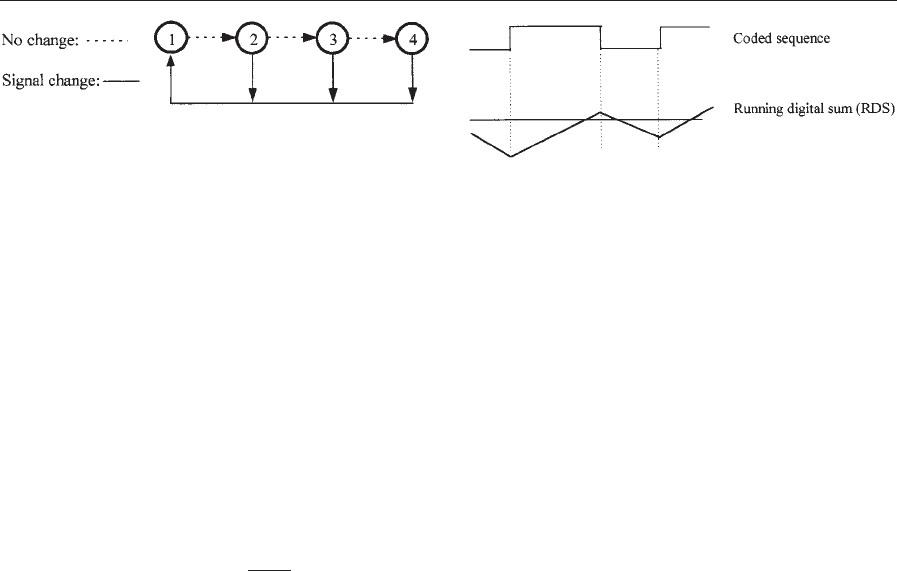
The d,k constraints of a code can be represented by
a finite-state transition diagram (FSTD) (Shannon
1948; Franaszek 1970). Figure 1 is an FSTD for a
code with constraint 1,3. The dotted paths in the di-
agram represent no level change in the code; solid
lines represent a level change, either zero to one or
one to zero. In moving from one state to another it
is seen that there must be at least one zero and a
maximum of three zeros between two changes.
O
1005
3. Channel Capa city
The maximum rate, R, at which information can be
transmitted reliably through a channel is limited by
the channel capacity C. The capacity of a channel
perturbed by white noise is given by Shannon (1948):
C ¼ Wlogð1 þ P=NÞbits s
1
ð1Þ
Where W is bandwidth and P /N is signal-to-noise
ratio. For RoC, information may be transmitted at
an arbitrarily low error rate. The actual error rate for
high R is governed by the quality of the channel and
the ingenuity of the coding scheme employed.
Shannon also defined capacity for a discrete noise-
less channel in units of user bits per channel bit
(Shannon 1948):
C ¼ lim
T-N
log
2
NðT Þ
T
ð2Þ
where N(T) is the number of allowed signals of
duration T. This reduces to log
2
l where l is the
largest root of the equation l
k þ1
l
kd
x þ1 ¼0
and d and k are the constraint parameters of the code
defined above. The equation is derived from a con-
sideration of the finite-state-timing diagram (FSTD)
of the code and its associated state transition matrix
(Siegel 1985, Immink et al. 1998).
In a recording code, m data bits are mapped into
n code bits to give a code with rate R ¼m/n, where
m/np1. The maximum theoretical code rate is known
as the capacity of the code. The efficiency of a code is
usually measured in terms of how near to C the actual
rate is.
4. Code Spectra/Equalization
Data to be recorded will be derived from a number
of diverse sources and, as such, cannot be predicted.
The various patterns of bits that are likely can be
simulated, however, using a pseudorandom binary
sequence (PRBS). If the PRBS is long it will contain
virtually all the binary combinations that the record-
ing system is likely to encounter. Assuming such a
random sequence of data, the frequency spectrum of
the ensuing coded sequence is useful in assessing code
performance. Since the optical channel response falls
off rapidly at high frequency, the high-frequency
components of a code’s spectrum should be low.
Also, the low-frequency components should have low
amplitude with a null at d.c.
Some codes are not absolutely d.c.-free: there may
be a slight dc component that will vary with the se-
quence of the signal being recorded. A measure of the
d.c.-content in the coded signal is the running digital
sum (RDS). The RDS is the running integral of the
coded signal, assuming þ1 is integrated when the
signal is high and 1 when it is low (Fig. 2). The RDS
is effectively the arithmetic sum of the area under the
graph of the integral; this should be kept low for
efficient operation. The digital sum variation (DSV)
represents the limits of the RDS graph. The d.c. con-
tent of a code is said to be bounded provided the
DSV does not extend to infinity.
A closer match between the response of the channel
and the spectrum of the code may be achieved
through equalization. Equalization is the process of
modifying the channel’s frequency response or chang-
ing the spectral content of the signal to be recorded to
more closely match the response of the channel. Here,
the channel is taken to include the write and read
electronics. One technique is to include a filter in the
channel to shape the spectrum of the code.
5. Examples of Code
In the two-thirds rate code of Horiguchi and Morita
(1976) two data bits are represented by three code
bits. The d,k value is (1,7), which gives a code
capacity of 0.679.
The code adopted for the audio compact disk (CD)
specification (and for the mini-disk) is known as
eight-to-fourteen modulation (EFM) (Heemskerk
and Immink 1982). In EFM, eight data bits are
coded into 14 code bits. However, in order to control
the d.c. content of the code, three merging bits are
added after the coding process to produce a coded
symbol 17 bits long—hence the true rate is 8/17.
Whilst the merging bits minimize the DSV, the d,k
value of (2,10) is maintained.
An improved version of EFM, EFMPlus (Immink
1995) has been adopted for the digital versatile disk
(DVD). This has the same d,k value as EFM but
the rate is higher at 8/16. Eight data bits are coded
into codewords of 16 bits using a look-up table of
Figure 2
Running digital sum (RDS) of coded sequence.
Figure 1
Finite-state transition diagram for 1,3 d,k constraint.
1006
Optical and Magneto-optic Data Storage: Channels and Coding

codewords. Rather than using merging bits to control
d.c. content, substitute codeword sequences are avail-
able at the encoder as an alternative to the main table
of codewords. During the encoding process, code-
words are taken either from the main look-up table
or from the substitute table in order to keep the DSV
at a minimum. The reduction of one bit in the code-
word yields an improvement of 6–7% in information
density compared to the EFM code.
6. Signal Detection
The basic method of determining the binary value of
the replayed analogue signal is to employ peak de-
tection. With peak detection the replayed signal is
compared with a level threshold and a binary value
registered accordingly. This is satisfactory for low to
medium density systems but if the storage density was
to be increased, inter-symbol interference would
cause signal distortion in the replayed signal. This
distortion would severely impair the detection pro-
cess. For very high-density systems, therefore, partial
response maximum likelihood (PRML) (Siegel 1991)
is usually employed. In a PRML scheme the channel
response is tightly controlled. This tight control per-
mits the ISI-induced signal distortion to be predicted,
thus enabling the corresponding binary values to be
determined in line with the replayed signal.
With peak detection a great deal of information is
wasted once the decision process is made. A more
effective, albeit more complex, method is maximum
likelihood detection. The principle behind maximum
likelihood detection is that all possible sequences of
replayed signal are known to the detector. As each
sequence is replayed it is compared to all the known
sequences: the one with the best match is the one
most likely to be the correct one. A disadvantage is
that for a reasonably long replayed sequence the de-
tection process would take too long. Viterbi detection
(Viterbi 1967) is a maximum likelihood detection
algorithm that reduces detection time by comparing
the replayed signal sequence ‘‘on-the-fly.’’ Reserved
judgements are made on sections of the replayed sig-
nal as to the likelihood of it representing a certain bit
pattern. The decision to incorporate certain combi-
nations of bits in the detected sequence depends not
only on the current signal being decoded but also on
previous evaluations: the k constraint of the record-
ing code can be used to force decisions. The result is a
detector that gives superior performance compared to
peak detection.
7. Comments
The classical work on communications channels
by Shannon can be applied to optical recording
systems, since the latter is effectively a transmit-
now, receive-later communications system. Unlike a
communications system, however, the signal power
of a recording system cannot be increased indefinitely
in order to improve performance.
A binary-data signal comprises two related com-
ponents: amplitude and time. These must be repli-
cated faithfully on replay to reconstitute the recorded
signal: this is a function of the recording code. A
further requirement of a code is to increase storage
density. However, the dual goals of achieving high
density together with reliable timebase regeneration
are contradictory. Hence, many codes have been de-
veloped in an attempt to resolve these contradictions.
The code designer must balance the storage gains to
be delivered by a code against the need for reliable
operation and cost of implementation.
The signal that is ultimately recorded is derived
from the information data, to which has been added
data for error correction, timing, synchroniza-
tion, and sundry other purposes. There is no one
‘‘supreme’’ code with all the best characteristics:
many different recording codes are in use, each de-
signed for a specific application. No small consider-
ation is the practical implementation of a code.
The recording codes in general use are single-
dimension codes, where a serial sequence of data is
coded. In an attempt to resolve the contradictory re-
quirements of a code, two-dimensional codes have
been examined (Davey et al. 1998). These codes cap-
italize on the areal format of recorded data. Mutually
related information is encoded in two dimensions.
This information is recovered at replay to support
effective detection. This concept can be extended fur-
ther to a third dimension. Such codes may be suitable
for application to multilayer disks such as the current
DVD, which has two layers, and future generations
that may possibly have many layers.
See also: Magneto-optic Recording: Overwrite and
Associated Problems; Magneto-optic Recording:
Total Film Stack, Layer Configuration
Bibliography
Bouwhuis G, et al. 1985 Principles of Optical Disc Systems.
Hilger, Bristol, UK
Davey P J, Donnelly T, Mapps D J 1998 Two-dimensional
coding for a multi-track recording system to combat inter-
track interference. IEEE Trans. Magnetics. 34 (4), 1949–51
Franaszek P A 1970 Sequence state methods of run-length-
limited coding. IBM J. Res. Dev. 14 (4),
Heemskerk J P J, Immink K A S 1982 Compact disc: system
aspects and modulation. Philips Tech. Rev. 40 (6), 157–64
Horiguchi T, Morita K 1976 An optimisation of modulation
codes in digital recording. IEEE Trans. Magn. 12 (6), 740–2
Immink K E S Coding Techniques for Digital Recorders. Pren-
tice Hall, Englewood Cliffs, NJ
Immink K A S 1995 EFMPlus: The coding format of the mul-
timedia compact disc. IEEE Trans. Consumer Electron. 41
(3), 491–7
1007
Optical and Magneto-optic Data Storage : Channels and Coding

Immink K A S, Siegel P H, Wolf J K 1998 Codes for digital
recorders. IEEE Trans. Inf. Theory. 44 (6), 2260–99
Shannon C E 1948 A mathematical theory of communication.
Bell Syst. Tech. J. 27 (3), 379–423
Siegel P H 1985 Recording codes for digital magnetic storage.
IEEE Trans. Magn (5), 1344–9
Siegel P H 1991 Recording codes for PRML. Digest Magnetic
Recording Conf. (MRC 91), paper F-2H
Siegel P H, Wolf J K 1991 Modulation coding for information
storage. IEEE Commun. Magn. (Dec), 1344–9
Viterbi A J 1967 Error bounds for convolutional codes and an
asymptotically optimum decoding algorithm. IEEE Trans.
Inf. Th. IT-13, 260–9
Watkinson J 1990 Coding for Digital Recording. Focal Press,
London
T. Donnelly
University of Plymouth, Plymouth, UK
1008
Optical and Magneto-optic Data Storage: Channels and Coding
Permanent Magnet Assemblies
Modern permanent magnets are ideally suited to
generate magnetic fields of magnitudes comparable to
their spontaneous polarization, J
s
. These fields can be
static or variable, uniform or nonuniform. They are
generated by permanent magnet structures that de-
mand no continual expenditure of energy for their
operation, and dispense with the elaborate cooling
systems required by resistive or superconducting elec-
tromagnets. Furthermore, the permanent magnet as-
semblies are compact and can offer the significant
advantage of flux confinement in the region of inter-
est. Permanent magnets are now competitive with
electromagnets for generating fields of up to about
2 T. More generally, when a high field with a rapid
spatial variation is required, they may offer the only
practicable solution.
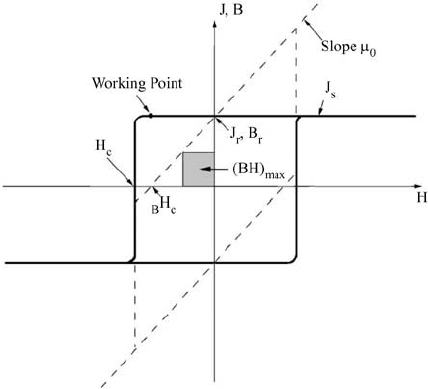
The polarization, J, of a modern hard magnet
(Skomski and Cugat 1999) deviates little from its
remanent or saturation value, J
s
, far into the second
quadrant of the hysteresis loop, before switching
at the coercive field, H
c
(see Rare Earth Magnets:
Materials, Magnets: Sintered). The plot of the polar-
ization of the magnet as a function of the magnetic
field, H, acting on it is almost rectangular in shape, as
indicated in Fig. 1. The intrinsic spontaneous polar-
ization of SrFe
12
O
19
is 0.47 T, for example, and that
of Nd
2
Fe
14
B is 1.61 T. Values of the remanent po-
larization of typical sintered magnets are given in
Table 1. They are typically 10–20% less than the
spontaneous polarization of the pure hard phase due
to imperfect crystallite alignment and the presence of
secondary phases necessary to develop coercivity.
The magnetic flux density, B, is related to the H-field
(magnetizing force) and polarization by B ¼m
0
H þJ
so that in free space, where J ¼0, the relation be-
tween B and H is simply B ¼m
0
H.
The purpose of any permanent magnet assembly is
to deliver magnetic flux into a region of space adja-
cent to the magnet known as the airgap, creating a
magnetic field, B
g
(r), in this region. Maximum energy
product, (BH)
max
, defined on the B:H loop of Fig. 1,
is equivalent to twice the energy stored in the field in
the airgap, (1/2m
0
)
R
B
2
g
dt. The energy product pro-
vides a convenient measure of the efficiency of the
magnet material for generating airgap fields. In the
case of an ideal rectangular hysteresis loop with
m
0
H
c
4J
r
/2, the maximum possible energy product,
(BH)
max
,isJ
r
2
/4m
0
.
In the structures described below, the airgap is of-
ten a cylindrical cavity surrounded by magnets. The
fields achieved in the airgap scale with, but are not
limited by the polarization of the magnets. Ideally,
the field generated is the product of a geometric con-
stant, K(r), for the structure and the remanence of the
magnet, J
r
.
KðrÞ¼B
g
ðrÞ=J
r
ð1Þ
When K41, the magnetic structure achieves flux
concentration.
Permanent magnet structures are produced by as-
sembling blocks of rare-earth magnets (see Magnets:
Sintered) or ferrite magnets (see Alnicos and Hexa-
ferrites; Ferrite Magnets: Improved Performance)in
any desired orientation. These magnets with their
wide, rectangular hysteresis loops have the property
that the field of one magnet does not significantly
perturb the magnetization of its neighbors. The mag-
net blocks behave essentially as if they are rigid and
transparent. This follows because the longitudinal
susceptibility is zero for a rectangular hysteresis loop;
the slope of the B(H) curve is m
0
, as for free space.
The transverse susceptibility, J
s
/m
0
H
a
, is only of
order 0.1, since the anisotropy field, H
a
, is much
greater than the magnetization (Table 1). Hence, for
example, the directions of magnetization of two
blocks of SmCo
5
in contact with their easy-axes per-
pendicular will deviate by less than a degree from the
easy-axes. The assumption of rigidity and transpar-
ency of the magnetization greatly simplifies the design
of magnetic circuits. Errors in the calculated airgap
Figure 1
The J(H) hysteresis loop of an ideal permanent magnet.
The corresponding B(H) loop is shown by the dotted
line. (BH)
max
is indicated by the area of the shaded
region.
P
1009