Brealey, Myers. Principles of Corporate Finance. 7th edition
Подождите немного. Документ загружается.


Brealey−Meyers:
Principles of Corporate
Finance, Seventh Edition
I. Value 4. The Value of Common
Stocks
© The McGraw−Hill
Companies, 2003
annual growth of 6.6 percent.
5
This, together with the dividend yield, gave an esti-
mate of the cost of equity capital:
An alternative approach to estimating long-run growth starts with the payout
ratio, the ratio of dividends to earnings per share (EPS). For Pinnacle, this was fore-
casted at 43 percent. In other words, each year the company was plowing back into
the business about 57 percent of earnings per share:
Also, Pinnacle’s ratio of earnings per share to book equity per share was about
11 percent. This is its return on equity, or ROE:
If Pinnacle earns 11 percent of book equity and reinvests 57 percent of that, then
book equity will increase by .57 .11 .063, or 6.3 percent. Earnings and divi-
dends per share will also increase by 6.3 percent:
Dividend growth rate g plowback ratio ROE .57 .11 .063
That gives a second estimate of the market capitalization rate:
Although this estimate of the market capitalization rate for Pinnacle stock seems
reasonable enough, there are obvious dangers in analyzing any single firm’s stock
with the constant-growth DCF formula. First, the underlying assumption of regu-
lar future growth is at best an approximation. Second, even if it is an acceptable ap-
proximation, errors inevitably creep into the estimate of g. Thus our two methods
for calculating the cost of equity give similar answers. That was a lucky chance; dif-
ferent methods can sometimes give very different answers.
Remember, Pinnacle’s cost of equity is not its personal property. In well-
functioning capital markets investors capitalize the dividends of all securities in
Pinnacle’s risk class at exactly the same rate. But any estimate of r for a single
common stock is “noisy” and subject to error. Good practice does not put too
much weight on single-company cost-of-equity estimates. It collects samples of
similar companies, estimates r for each, and takes an average. The average gives
a more reliable benchmark for decision making.
Table 4.2 shows DCF cost-of-equity estimates for Pinnacle West and 10 other
electric utilities in May 2001. These utilities are all stable, mature companies for
which the constant-growth DCF formula ought to work. Notice the variation in the
cost-of-equity estimates. Some of the variation may reflect differences in the risk,
but some is just noise. The average estimate is 10.7 percent.
r
DIV
1
P
0
g .033 .063 .096, or 9.6%
Return on equity ROE
EPS
book equity per share
.11
Plowback ratio 1 payout ratio 1
DIV
EPS
1 .43 .57
r
DIV
1
P
0
g .033 .066 .099, or 9.9%
66 PART I Value
5
In this calculation we’re assuming that earnings and dividends are forecasted to grow forever at the
same rate g. We’ll show how to relax this assumption later in this chapter. The growth rate was based
on the average earnings growth forecasted by Value Line and IBES. IBES compiles and averages fore-
casts made by security analysts. Value Line publishes its own analysts’ forecasts

Brealey−Meyers:
Principles of Corporate
Finance, Seventh Edition
I. Value 4. The Value of Common
Stocks
© The McGraw−Hill
Companies, 2003
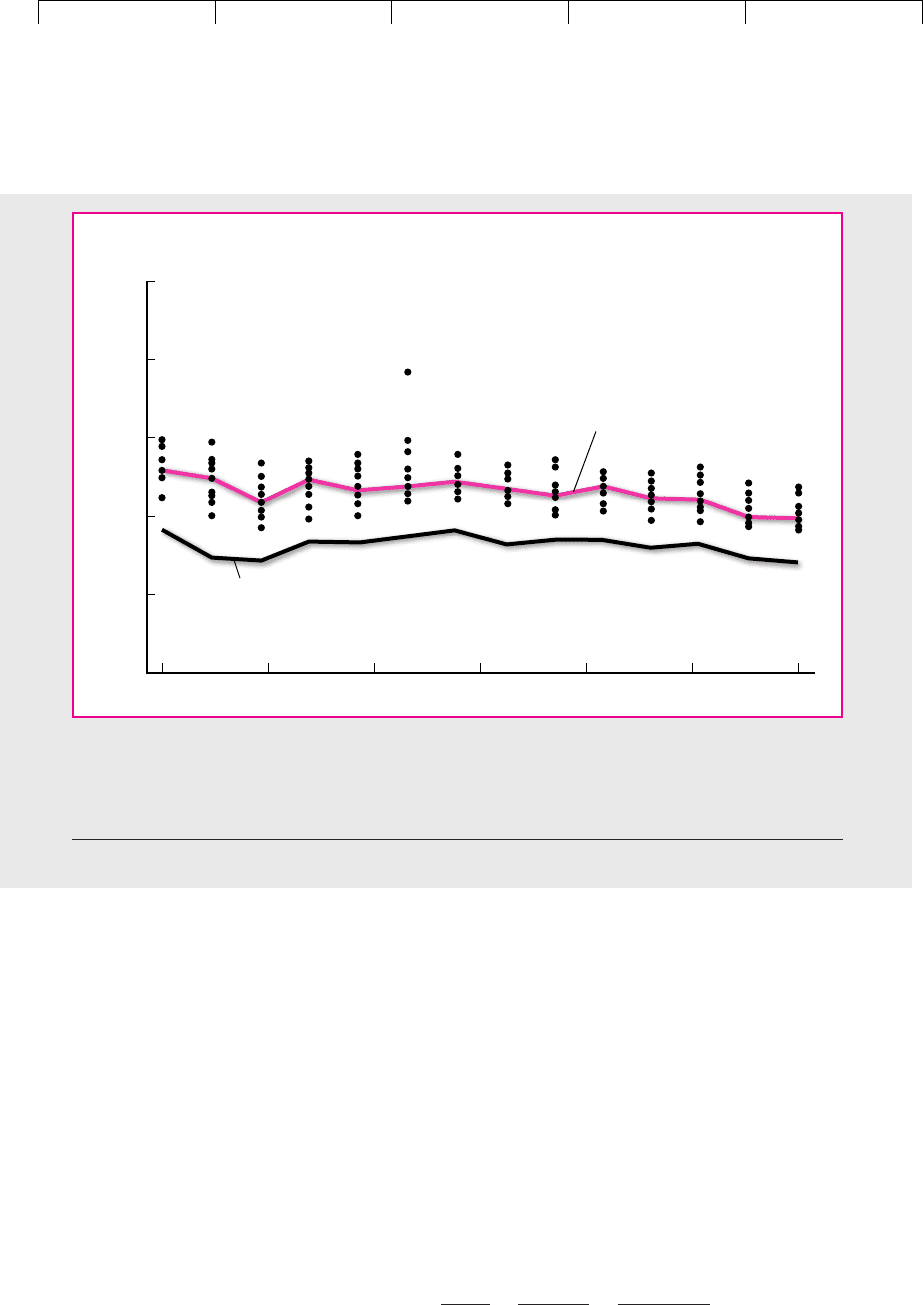
Figure 4.2 shows DCF costs of equity estimated at six-month intervals for a sam-
ple of electric utilities over a seven-year period. The burgundy line indicates the
median cost-of-equity estimates, which seem to lie about 3 percentage points
above the 10-year Treasury bond yield. The dots show the scatter of individual es-
timates. Again, most of this scatter is probably noise.
Some Warnings about Constant-Growth Formulas
The simple constant-growth DCF formula is an extremely useful rule of thumb, but
no more than that. Naive trust in the formula has led many financial analysts to
silly conclusions.
We have stressed the difficulty of estimating r by analysis of one stock only. Try
to use a large sample of equivalent-risk securities. Even that may not work, but at
least it gives the analyst a fighting chance, because the inevitable errors in estimat-
ing r for a single security tend to balance out across a broad sample.
In addition, resist the temptation to apply the formula to firms having high cur-
rent rates of growth. Such growth can rarely be sustained indefinitely, but the
constant-growth DCF formula assumes it can. This erroneous assumption leads to
an overestimate of r.
Consider Growth-Tech, Inc., a firm with DIV
1
$.50 and P
0
$50. The firm has
plowed back 80 percent of earnings and has had a return on equity (ROE) of 25 per-
cent. This means that in the past
Dividend growth rate plowback ratio ROE .80 .25 .20
The temptation is to assume that the future long-term growth rate g also equals
.20. This would imply
r
.50
50.00
.20 .21
CHAPTER 4 The Value of Common Stocks 67
Stock Price, Dividend, Dividend Yield, Growth Cost of Equity,
P
0
DIV
1
DIV
1
/P
0
Rate, grⴝ DIV
1
/P
0
ⴙ g
American Corp. $41.71 $2.64 6.3% 3.8% 10.1%
CH Energy Corp. 43.85 2.20 5.0 2.0 7.0
CLECO Corp. 46.00 .92 2.0 8.8 10.8
DPL, Inc. 30.27 1.03 3.4 9.6 13.0
Hawaiian Electric 36.69 2.54 6.9 2.6 9.5
Idacorp 39.42 1.97 5.0 5.7 10.7
Pinnacle West 49.16 1.60 3.3 6.6 9.9
Potomac Electric 22.00 1.75 8.0 5.7 13.7
Puget Energy 23.49 1.93 8.2 4.8 13.0
TECO Energy 31.38 1.44 4.6 7.7 12.3
UIL Holdings 48.21 2.93 6.1 1.9 8.0
Average 10.7%
TABLE 4.2
DCF cost-of-equity estimates for electric utilities in 2001.
Source: The Brattle Group, Inc.
Brealey−Meyers:
Principles of Corporate
Finance, Seventh Edition
I. Value 4. The Value of Common
Stocks
© The McGraw−Hill
Companies, 2003
But this is silly. No firm can continue growing at 20 percent per year forever, except
possibly under extreme inflationary conditions. Eventually, profitability will fall
and the firm will respond by investing less.
In real life the return on equity will decline gradually over time, but for sim-
plicity let’s assume it suddenly drops to 16 percent at year 3 and the firm responds
by plowing back only 50 percent of earnings. Then g drops to .50(.16) .08.
Table 4.3 shows what’s going on. Growth-Tech starts year 1 with assets of $10.00.
It earns $2.50, pays out 50 cents as dividends, and plows back $2. Thus it starts year
2 with assets of $10 2 $12. After another year at the same ROE and payout, it
starts year 3 with assets of $14.40. However, ROE drops to .16, and the firm earns
only $2.30. Dividends go up to $1.15, because the payout ratio increases, but the
firm has only $1.15 to plow back. Therefore subsequent growth in earnings and
dividends drops to 8 percent.
Now we can use our general DCF formula to find the capitalization rate r:
Investors in year 3 will view Growth-Tech as offering 8 percent per year dividend
growth. We will apply the constant-growth formula:
P
0
DIV
1
1 r
DIV
2
11 r2
2
DIV
3
P
3
11 r2
3
68 PART I Value
25
Cost of equity,
percent
20
15
10
5
0
Jan. 86
Jan. 87 Jan. 88 Jan. 89 Jan. 90 Jan. 91 Jan. 92
10-year Treasury
bond yield
Median
estimate
FIGURE 4.2
DCF cost-of-equity estimates for a sample of 17 utilities. The median estimates (burgundy line) track long-
term interest rates fairly well. (The blue line is the 10-year Treasury yield.) The dots show the scatter of
the cost-of-equity estimates for individual companies.
Source: S. C. Myers and L. S. Borucki, “Discounted Cash Flow Estimates of the Cost of Equity Capital—A Case Study,”
Financial Markets, Institutions and Instruments 3 (August 1994), pp. 9–45.

Brealey−Meyers:
Principles of Corporate
Finance, Seventh Edition
I. Value 4. The Value of Common
Stocks
© The McGraw−Hill
Companies, 2003
We have to use trial and error to find the value of r that makes P
0
equal $50. It turns
out that the r implicit in these more realistic forecasts is approximately .099, quite
a difference from our “constant-growth” estimate of .21.
DCF Valuation with Varying Growth Rates
Our present value calculations for Growth-Tech used a two-stage DCF valuation
model. In the first stage (years 1 and 2), Growth-Tech is highly profitable (ROE
25 percent), and it plows back 80 percent of earnings. Book equity, earnings, and
dividends increase by 20 percent per year. In the second stage, starting in year 3,
profitability and plowback decline, and earnings settle into long-term growth at 8
percent. Dividends jump up to $1.15 in year 3, and then also grow at 8 percent.
Growth rates can vary for many reasons. Sometimes growth is high in the short
run not because the firm is unusually profitable, but because it is recovering from
an episode of low profitability. Table 4.4 displays projected earnings and dividends
for Phoenix.com, which is gradually regaining financial health after a near melt-
down. The company’s equity is growing at a moderate 4 percent. ROE in year 1 is
only 4 percent, however, so Phoenix has to reinvest all its earnings, leaving no cash
for dividends. As profitability increases in years 2 and 3, an increasing dividend
can be paid. Finally, starting in year 4, Phoenix settles into steady-state growth,
with equity, earnings, and dividends all increasing at 4 percent per year.
Assume the cost of equity is 10 percent. Then Phoenix shares should be worth
$9.13 per share:
PV (first-stage dividends) PV (second-stage dividends)
We could go on to three- or even four-stage valuation models—but you get the
idea. Two warnings, however. First, it’s almost always worthwhile to lay out a simple
P
0
0
1.1
.31
11.12
2
.65
11.12
3
1
11.12
3
.67
1.10 .042
$9.13
.50
1 r
.60
11 r2
2
1.15
11 r2
3
1
11 r2
3
1.24
r .08
P
0
DIV
1
1 r
DIV
2
11 r2
2
DIV
3
11 r2
3
1
11 r2
3
DIV
4
r .08
P
3
DIV
4
r .08
CHAPTER 4
The Value of Common Stocks 69
Year
1234
Book equity 10.00 12.00 14.40 15.55
Earnings per share, EPS 2.50 3.00 2.30 2.49
Return on equity, ROE .25 .25 .16 .16
Payout ratio .20 .20 .50 .50
Dividends per share, DIV .50 .60 1.15 1.24
Growth rate of dividends (%) — 20 92 8
TABLE 4.3
Forecasted earnings and dividends for
Growth-Tech. Note the changes in year
3: ROE and earnings drop, but payout
ratio increases, causing a big jump in
dividends. However, subsequent
growth in earnings and dividends falls
to 8 percent per year. Note that the
increase in equity equals the earnings
not paid out as dividends.
再
再

Brealey−Meyers:
Principles of Corporate
Finance, Seventh Edition
I. Value 4. The Value of Common
Stocks
© The McGraw−Hill
Companies, 2003
spreadsheet, like Table 4.3 or 4.4, to assure that your dividend projections are consis-
tent with the company’s earnings and the investments required to grow. Second, do
not use DCF valuation formulas to test whether the market is correct in its assessment
of a stock’s value. If your estimate of the value is different from that of the market, it
is probably because you have used poor dividend forecasts. Remember what we said
at the beginning of this chapter about simple ways of making money on the stock
market: There aren’t any.
70 PART I
Value
Year
123 4
Book equity 10.00 10.40 10.82 11.25
Earnings per share, EPS .40 .73 1.08 1.12
Return on equity, ROE .04 .07 .10 .10
Dividends per share, DIV 0 .31 .65 .67
Growth rate of dividends (%) — — 110 4
TABLE 4.4
Forecasted earnings and
dividends for Phoenix.com. The
company can initiate and increase
dividends as profitability (ROE)
recovers. Note that the increase in
book equity equals the earnings
not paid out as dividends.
4.4 THE LINK BETWEEN STOCK PRICE AND EARNINGS
PER SHARE
Investors often use the terms growth stocks and income stocks. They buy growth
stocks primarily for the expectation of capital gains, and they are interested in the
future growth of earnings rather than in next year’s dividends. On the other hand,
they buy income stocks primarily for the cash dividends. Let us see whether these
distinctions make sense.
Imagine first the case of a company that does not grow at all. It does not plow
back any earnings and simply produces a constant stream of dividends. Its stock
would resemble the perpetual bond described in the last chapter. Remember that
the return on a perpetuity is equal to the yearly cash flow divided by the present
value. The expected return on our share would thus be equal to the yearly dividend
divided by the share price (i.e., the dividend yield). Since all the earnings are paid
out as dividends, the expected return is also equal to the earnings per share di-
vided by the share price (i.e., the earnings–price ratio). For example, if the dividend
is $10 a share and the stock price is $100, we have
Expected return dividend yield earnings–price ratio
The price equals
P
0
DIV
1
r
EPS
1
r
10.00
.10
100
.10
10.00
100
EPS
1
P
0
DIV
1
P
0

Brealey−Meyers:
Principles of Corporate
Finance, Seventh Edition
I. Value 4. The Value of Common
Stocks
© The McGraw−Hill
Companies, 2003
The expected return for growing firms can also equal the earnings–price ratio.
The key is whether earnings are reinvested to provide a return equal to the market
capitalization rate. For example, suppose our monotonous company suddenly
hears of an opportunity to invest $10 a share next year. This would mean no divi-
dend at t 1. However, the company expects that in each subsequent year the proj-
ect would earn $1 per share, so that the dividend could be increased to $11 a share.
Let us assume that this investment opportunity has about the same risk as the
existing business. Then we can discount its cash flow at the 10 percent rate to find
its net present value at year 1:
Thus the investment opportunity will make no contribution to the company’s
value. Its prospective return is equal to the opportunity cost of capital.
What effect will the decision to undertake the project have on the company’s share
price? Clearly none. The reduction in value caused by the nil dividend in year 1 is
exactly offset by the increase in value caused by the extra dividends in later years.
Therefore, once again the market capitalization rate equals the earnings–price ratio:
Table 4.5 repeats our example for different assumptions about the cash flow gen-
erated by the new project. Note that the earnings–price ratio, measured in terms of
EPS
1
, next year’s expected earnings, equals the market capitalization rate (r) only
when the new project’s NPV 0. This is an extremely important point—managers
frequently make poor financial decisions because they confuse earnings–price ra-
tios with the market capitalization rate.
In general, we can think of stock price as the capitalized value of average earnings
under a no-growth policy, plus PVGO, the present value of growth opportunities:
P
0
EPS
1
r
PVGO
r
EPS
1
P
0
10
100
.10
Net present value per share at year 1 10
1
.10
0
CHAPTER 4 The Value of Common Stocks 71
Project’s Impact
Project Rate Incremental Project NPV on Share Price Share Price EPS
1
of Return Cash Flow, C in Year 1* in Year 0
†
in Year 0, P
0
P
0
r
.05 $ .50 $ 5.00 $ 4.55 $ 95.45 .105 .10
.10 1.00 0 0 100.00 .10 .10
.15 1.50 5.00 4.55 104.55 .096 .10
.20 2.00 10.00 9.09 109.09 .092 .10
.25 2.50 15.00 13.64 113.64 .088 .10
TABLE 4.5
Effect on stock price of investing an additional $10 in year 1 at different rates of return. Notice that the earnings–price
ratio overestimates r when the project has negative NPV and underestimates it when the project has positive NPV.
*Project costs $10.00 (EPS
1
). NPV 10 C/r, where r .10.
†
NPV is calculated at year 1. To find the impact on P
0
, discount for one year at r .10.

Brealey−Meyers:
Principles of Corporate
Finance, Seventh Edition
I. Value 4. The Value of Common
Stocks
© The McGraw−Hill
Companies, 2003
The earnings–price ratio, therefore, equals
It will underestimate r if PVGO is positive and overestimate it if PVGO is negative.
The latter case is less likely, since firms are rarely forced to take projects with nega-
tive net present values.
Calculating the Present Value of Growth Opportunities
for Fledgling Electronics
In our last example both dividends and earnings were expected to grow, but
this growth made no net contribution to the stock price. The stock was in this
sense an “income stock.” Be careful not to equate firm performance with the
growth in earnings per share. A company that reinvests earnings at below
the market capitalization rate may increase earnings but will certainly reduce
the share value.
Now let us turn to that well-known growth stock, Fledgling Electronics. You may
remember that Fledgling’s market capitalization rate, r, is 15 percent. The company
is expected to pay a dividend of $5 in the first year, and thereafter the dividend is
predicted to increase indefinitely by 10 percent a year. We can, therefore, use the
simplified constant-growth formula to work out Fledgling’s price:
Suppose that Fledgling has earnings per share of $8.33. Its payout ratio is then
In other words, the company is plowing back 1 .6, or 40 percent of earnings. Sup-
pose also that Fledgling’s ratio of earnings to book equity is ROE .25. This ex-
plains the growth rate of 10 percent:
Growth rate g plowback ratio ROE .4 .25 .10
The capitalized value of Fledgling’s earnings per share if it had a no-growth pol-
icy would be
But we know that the value of Fledgling stock is $100. The difference of $44.44 must
be the amount that investors are paying for growth opportunities. Let’s see if we
can explain that figure.
Each year Fledgling plows back 40 percent of its earnings into new assets. In the
first year Fledgling invests $3.33 at a permanent 25 percent return on equity. Thus
the cash generated by this investment is .25 3.33 $.83 per year starting at t
2. The net present value of the investment as of t 1 is
NPV
1
3.33
.83
.15
$2.22
EPS
1
r
8.33
.15
$55.56
Payout ratio
DIV
1
EPS
1
5.00
8.33
.6
P
0
DIV
1
r g
5
.15 .10
$100
EPS
P
0
r a1
PVGO
P
0
b
72 PART I Value

Brealey−Meyers:
Principles of Corporate
Finance, Seventh Edition
I. Value 4. The Value of Common
Stocks
© The McGraw−Hill
Companies, 2003
Everything is the same in year 2 except that Fledgling will invest $3.67, 10 percent
more than in year 1 (remember g .10). Therefore at t 2 an investment is made
with a net present value of
Thus the payoff to the owners of Fledgling Electronics stock can be represented
as the sum of (1) a level stream of earnings, which could be paid out as cash divi-
dends if the firm did not grow, and (2) a set of tickets, one for each future year, rep-
resenting the opportunity to make investments having positive NPVs. We know
that the first component of the value of the share is
The first ticket is worth $2.22 in t 1, the second is worth $2.22 1.10 $2.44 in t
2, the third is worth $2.44 1.10 $2.69 in t 3. These are the forecasted cash val-
ues of the tickets. We know how to value a stream of future cash values that grows
at 10 percent per year: Use the constant-growth DCF formula, replacing the fore-
casted dividends with forecasted ticket values:
Now everything checks:
Share price present value of level stream of earnings
present value of growth opportunities
$55.56 $44.44
$100
Why is Fledgling Electronics a growth stock? Not because it is expanding at
10 percent per year. It is a growth stock because the net present value of its fu-
ture investments accounts for a significant fraction (about 44 percent) of the
stock’s price.
Stock prices today reflect investors’ expectations of future operating and invest-
ment performance. Growth stocks sell at high price–earnings ratios because in-
vestors are willing to pay now for expected superior returns on investments that
have not yet been made.
6
Some Examples of Growth Opportunities?
Stocks like Microsoft, Dell Computer, and Wal-Mart are often described as growth
stocks, while those of mature firms like Kellogg, Weyerhaeuser, and Exxon Mobil
are regarded as income stocks. Let us check it out. The first column of Table 4.6
EPS
1
r
PVGO
Present value of growth opportunities PVGO
NPV
1
r g
2.22
.15 .10
$44.44
Present value of level stream of earnings
EPS
1
r
8.33
.15
$55.56
NPV
2
3.33 1.10
.83 1.10
.15
$2.44
CHAPTER 4 The Value of Common Stocks 73
6
Michael Eisner, the chairman of Walt Disney Productions, made the point this way: “In school you had
to take the test and then be graded. Now we’re getting graded, and we haven’t taken the test.” This was
in late 1985, when Disney stock was selling at nearly 20 times earnings. See Kathleen K. Wiegner, “The
Tinker Bell Principle,” Forbes (December 2, 1985), p. 102.

Brealey−Meyers:
Principles of Corporate
Finance, Seventh Edition
I. Value 4. The Value of Common
Stocks
© The McGraw−Hill
Companies, 2003
shows the stock price for each of these companies in October 2001. The remaining
columns estimate PVGO as a proportion of the stock price.
Remember, if there are no growth opportunities, present value equals the av-
erage future earnings from existing assets discounted at the market capitaliza-
tion rate. We used analysts’ forecasts for 2002 as a measure of the earning
power of existing assets. You can see that most of the value of the growth stocks
comes from PVGO, that is, from investors’ expectations that the companies will
be able to earn more than the cost of capital on their future investments. How-
ever, Weyerhaeuser, though usually regarded as an income stock, does pretty
well on the PVGO scale. But the most striking growth stock is Amazon.com. Its
earnings have been consistently negative, so its PVGO accounts for more than
100 percent of its stock price. None of the company’s value can be based on its
current earnings. The value comes entirely from future earnings and the NPV
of its future investments.
7
Some companies have such extensive growth opportunities that they prefer to
pay no dividends for long periods of time. For example, up to the time that we
wrote this chapter, “glamour stocks” such as Microsoft and Dell Computer had
never paid a dividend, because any cash paid out to investors would have meant
either slower growth or raising capital by some other means. Investors were happy
to forgo immediate cash dividends in exchange for increasing earnings and the ex-
pectation of high dividends some time in the future.
74 PART I
Value
Stock Price, P
0
Cost of PVGO PVGO, percent
Stock (October 2001) EPS* Equity, r
†
ⴝ P
0
ⴚ EPS/r of Stock Price
Income stocks:
Chubb $77.35 $4.90 .088 $21.67 28
Exxon Mobil 42.29 2.13 .072 12.71 30
Kellogg 29.00 1.42 .056 3.64 13
Weyerhaeuser 50.45 3.21 .128 25.37 50
Growth stocks:
Amazon.com 8.88 .30 .24 10.13 114
Dell Computer 23.66 .76 .22 20.20 85
Microsoft 56.38 1.88 .184 46.16 82
Wal-Mart 52.90 1.70 .112 37.72 71
TABLE 4.6
Estimated PVGOs.
*EPS is defined as the average earnings under a no-growth policy. As an estimate of EPS, we used the forecasted earnings per share for
2002. Source: MSN Money (moneycentral.msn.com).
†
The market capitalization rate was estimated using the capital asset pricing model. We describe this model and how to use it in Sections
8.2 and 9.2. For this example, we used a market risk premium of 8 percent and a risk-free interest rate of 4 percent.
7
However, Amazon’s reported earnings probably understate its earnings potential. Amazon is growing
very rapidly, and some of the investments necessary to finance that growth are written off as expenses,
thus reducing current income. Absent these “investment expenses,” Amazon’s current income would
probably be positive. We discuss the problems encountered in measuring earnings and profitability in
Chapter 12.

Brealey−Meyers:
Principles of Corporate
Finance, Seventh Edition
I. Value 4. The Value of Common
Stocks
© The McGraw−Hill
Companies, 2003
What Do Price–Earnings Ratios Mean?
The price–earnings ratio is part of the everyday vocabulary of investors in the
stock market. People casually refer to a stock as “selling at a high P/E.” You can
look up P/Es in stock quotations given in the newspaper. (However, the newspa-
per gives the ratio of current price to the most recent earnings. Investors are more
concerned with price relative to future earnings.) Unfortunately, some financial an-
alysts are confused about what price–earnings ratios really signify and often use
the ratios in odd ways.
Should the financial manager celebrate if the firm’s stock sells at a high P/E?
The answer is usually yes. The high P/E shows that investors think that the firm
has good growth opportunities (high PVGO), that its earnings are relatively safe
and deserve a low capitalization rate (low r), or both. However, firms can have high
price–earnings ratios not because price is high but because earnings are low. Afirm
which earns nothing (EPS 0) in a particular period will have an infinite P/E as
long as its shares retain any value at all.
Are relative P/Es helpful in evaluating stocks? Sometimes. Suppose you own
stock in a family corporation whose shares are not actively traded. What are those
shares worth? A decent estimate is possible if you can find traded firms that have
roughly the same profitability, risks, and growth opportunities as your firm. Mul-
tiply your firm’s earnings per share by the P/E of the counterpart firms.
Does a high P/E indicate a low market capitalization rate? No. There is no reli-
able association between a stock’s price–earnings ratio and the capitalization rate
r. The ratio of EPS to P
0
measures r only if PVGO 0 and only if reported EPS is
the average future earnings the firm could generate under a no-growth policy. An-
other reason P/Es are hard to interpret is that the figure for earnings depends on
the accounting procedures for calculating revenues and costs. We will discuss the
potential biases in accounting earnings in Chapter 12.
CHAPTER 4
The Value of Common Stocks 75
4.5 VALUING A BUSINESS BY DISCOUNTED CASH FLOW
Investors routinely buy and sell shares of common stock. Companies frequently
buy and sell entire businesses. In 2001, for example, when Diageo sold its Pillsbury
operation to General Mills for $10.4 billion, you can be sure that both companies
burned a lot of midnight oil to make sure that the deal was fairly priced.
Do the discounted-cash-flow formulas we presented in this chapter work for
entire businesses as well as for shares of common stock? Sure: It doesn’t matter
whether you forecast dividends per share or the total free cash flow of a business.
Value today always equals future cash flow discounted at the opportunity cost of
capital.
Valuing the Concatenator Business
Rumor has it that Establishment Industries is interested in buying your company’s
concatenator manufacturing operation. Your company is willing to sell if it can get
the full value of this rapidly growing business. The problem is to figure out what
its true present value is.
Table 4.7 gives a forecast of free cash flow (FCF) for the concatenator business. Free
cash flow is the amount of cash that a firm can pay out to investors after paying for