Brealey, Myers. Principles of Corporate Finance. 7th edition
Подождите немного. Документ загружается.


Brealey−Meyers:
Principles of Corporate
Finance, Seventh Edition
VIII. Risk Management 28. Managing International
Risks
© The McGraw−Hill
Companies, 2003
IN THE LAST chapter we considered the risks that flow from changes in interest rates and commodity prices.
But companies with substantial overseas interests encounter a variety of other hazards, including political
risks and currency fluctuations. Political risk means the possibility that a hostile foreign government will
expropriate your business without compensation or not allow profits to be taken out of the country.
To understand currency risk, you first need to understand how the foreign exchange market works
and how prices for foreign currency are determined. We therefore start this chapter with some basic
institutional detail about the foreign exchange market and we will look at some simple theories that
link exchange rates, interest rates, and inflation. We will use these theories to show how firms assess
and hedge their foreign currency exposure.
When we discussed investment decisions in Chapter 6, we showed that financial managers do not
need to forecast exchange rates in order to evaluate overseas investment proposals. They can simply
forecast the foreign currency cash flows and discount these flows at the foreign currency cost of capital.
In this chapter we will explain why this rule makes sense. It turns out that it is the ability to hedge foreign
exchange risk that allows companies to ignore future exchange rates when making investment decisions.
We conclude the chapter with a discussion of political risk. We show that, while companies cannot
restrain a determined foreign government, they can structure their operations to reduce the risk of
hostile actions.
787
28.1 THE FOREIGN EXCHANGE MARKET
An American company that imports goods from France may need to buy euros to pay
for the purchase. An American company exporting to France may receive euros, which
it sells in exchange for dollars. Both firms make use of the foreign exchange market.
The foreign exchange market has no central marketplace. Business is conducted
electronically. The principal dealers are the larger commercial banks and invest-
ment banks. A corporation that wants to buy or sell currency usually does so
through a commercial bank. Turnover in the foreign exchange market is huge. In
London in April 2001 $504 billion of currency changed hands each day. That is
equivalent to an annual turnover of $126 trillion ($126,000,000,000,000). New York
and Tokyo together accounted for a further $400 billion of turnover per day.
1
Table 28.1 is adapted from the table of exchange rates in the Financial Times. Ex-
change rates are generally expressed in terms of the number of units of the foreign
currency needed to buy one U.S. dollar. This is termed an indirect quote. In the first
column of Table 28.1, the indirect quote for the yen shows that you can buy 120.700
yen for $1. This is often written as .
A direct exchange rate quote states how many dollars you can buy for one unit
of foreign currency. The euro and the British pound sterling are usually shown as
direct quotes.
2
For example, Table 28.1 shows that is equivalent to $1.4483 or,
more concisely, . If buys $1.4483, then $1 must buy .
Thus the indirect quote for the pound is .
3
£.6905/$
1/1.4483 £.6905£1$ˇ 1.4483/£
£1
¥120.700/$
1
The results of the triennial survey of foreign exchange business are published on www.bis.org/publ.
2
The euro is the common currency of the European Monetary Union. The 12 members of the Union are
Austria, Belgium, Finland, France, Germany, Greece, Ireland, Italy, Luxembourg, Netherlands, Portu-
gal, and Spain.
3
Foreign exchange dealers usually refer to the exchange rate between pounds and dollars as cable. In
Table 28.1 cable is 1.4483.

Brealey−Meyers:
Principles of Corporate
Finance, Seventh Edition
VIII. Risk Management 28. Managing International
Risks
© The McGraw−Hill
Companies, 2003
The exchange rates in the first column of Table 28.1 are the prices of currency for
immediate delivery. These are known as spot rates of exchange. The spot rate for
the yen is , and the spot rate for the pound is .
In addition to the spot exchange market, there is a forward market. In the forward
market you buy and sell currency for future delivery. If you know that you are going
to pay out or receive foreign currency at some future date, you can insure yourself
against loss by buying or selling forward. Thus, if you need one million yen in three
months, you can enter into a three-month forward contract. The forward rate on this
contract is the price you agree to pay in three months when the one million yen are
delivered. If you look again at Table 28.1, you will see that the three-month forward
rate for the yen is quoted at . If you buy yen for three months’ delivery, you
get fewer yen for your dollar than if you buy them spot. In this case the yen is said to
trade at a forward premium relative to the dollar, because forward yen are more ex-
pensive than spot ones. Expressed as an annual rate, the forward premium is
4
You could also say that the dollar was selling at a forward discount.
A forward purchase or sale is a made-to-measure transaction between you and the
bank. It can be for any currency, any amount, and any delivery day. You could buy, say,
99,999 Vietnamese dong or Haitian gourdes for a year and a day forward as long as
you can find a bank ready to deal. Most forward transactions are for six months or less,
but banks are prepared to buy and sell the major currencies for several years forward.
5
4 a
120.700
119.66
1 b .035, or 3.5%
¥
ˇ119.66/$
$ˇ 1.4483/£¥ˇ120.700/$
788 PART VIII
Risk Management
Forward Rate*
Spot Rate* 1 Month 3 Months 1 Year
Europe:
EMU (euro) .9094 .9088 .9076 .9057
Norway (krone) 8.8756 8.9006 8.9594 9.1889
Sweden (krona) 10.3159 10.3221 10.3389 10.4034
Switzerland (franc) 1.6680 1.6677 1.6667 1.6563
United Kingdom (pound) 1.4483 1.4468 1.4432 1.4289
Americas:
Canada (dollar) 1.5397 1.5403 1.5415 1.545
Mexico (peso) 9.1390 9.1865 9.307 9.924
Pacific/Africa:
Hong Kong (dollar) 7.7999 7.7987 7.7962 7.7954
Japan (yen) 120.700 120.36 119.66 116.535
Singapore (dollar) 1.7542 1.7525 1.7491 1.7322
South Africa (rand) 8.3693 8.4102 8.4963 8.8278
Thailand (baht) 44.3450 44.39 44.555 45.295
TABLE 28.1
Spot and forward
exchange rates, August
28, 2001.
*Rates show the number of
units of foreign currency per
U.S. dollar, except for the
euro and the UK pound,
which show the number of
U.S. dollars per unit of
foreign currency.
Source: Financial Times,
August 29, 2001.
4
Here is an occasional point of confusion. Since the quote for the yen is indirect, we calculate the pre-
mium by taking the ratio of the spot rate to the forward rate. If we use direct quotes, then we need to
calculate the ratio of the forward rate to the spot rate. In the case of the yen, the forward premium with
direct quotes is , or 3.5 percent.
5
Forward and spot trades are often undertaken together. For example, a company might need the use
of Japanese yen for one month. In this case it would buy the yen spot and simultaneously sell them for-
ward. This is known as a swap trade, but do not confuse it with the longer-term interest rate and cur-
rency swaps described in Chapter 27.
4 311/119.662/11/120.72 14 .035

Brealey−Meyers:
Principles of Corporate
Finance, Seventh Edition
VIII. Risk Management 28. Managing International
Risks
© The McGraw−Hill
Companies, 2003
There is also an organized market for currency for future delivery known as the
currency futures market. Futures contracts are highly standardized; they exist only
for the main currencies, and they are for specified amounts and for a limited choice
of delivery dates.
6
When you buy a forward or futures contract, you are committed to taking de-
livery of the currency. As an alternative, you can take out an option to buy or sell
currency in the future at a price that is fixed today. Made-to-measure currency op-
tions can be bought from the major banks, and standardized options are traded on
the options exchanges.
CHAPTER 28
Managing International Risks 789
6
See Chapter 27 for a further discussion of the difference between forward and futures contracts.
28.2 SOME BASIC RELATIONSHIPS
You can’t develop a consistent international financial policy until you understand
the reasons for the differences in exchange rates and interest rates. We will consider
the following four problems:
• Problem 1. Why is the dollar rate of interest different from, say, the yen rate ?
• Problem 2. Why is the forward rate of exchange different from the spot
rate ?
• Problem 3. What determines next year’s expected spot rate of exchange
between dollars and yen ?
• Problem 4. What is the relationship between the inflation rate in the United
States and the inflation rate in Japan ?
Suppose that individuals were not worried about risk and that there were no bar-
riers or costs to international trade. In that case the spot exchange rates, forward
exchange rates, interest rates, and inflation rates would stand in the following sim-
ple relationship to one another:
1i
¥
21i
$
2
3E1r
¥/$
24
1s
¥/$
2
1f
¥ ˇˇˇ/$
2
1r
¥
21r
$
2
Difference in
interest rates
1 +
r
Y
1 +
r
$
equals
=
Expected difference
in inflation rates
E
(1 +
i
Y
)
E
(1 +
i
$
)
=
Difference between
forward and spot rates
f
Y/$
s
Y/$
equals
equals equals
=
=
Expected change
in spot rate
E
(
s
Y/$
)
s
Y/$
=
=
Why should this be so?

Brealey−Meyers:
Principles of Corporate
Finance, Seventh Edition
VIII. Risk Management 28. Managing International
Risks
© The McGraw−Hill
Companies, 2003
Interest Rates and Exchange Rates
It is August 2001 and you have $1 million to invest for one year. U.S. dollar deposits
are offering an interest rate of about 3.65 percent; Japanese yen deposits are offer-
ing a meager .06 percent. Where should you put your money? Does the answer
sound obvious? Let’s check:
• Dollar loan. The rate of interest on one-year dollar deposits is 3.65 percent.
Therefore at the end of the year you get .
• Yen loan. The current exchange rate is . For $1 million, you can buy
. The rate of interest on a one-year yen
deposit is .06 percent. Therefore at the end of the year you get
. Of course, you don’t know what the
exchange rate is going to be in one year’s time. But that doesn’t matter. You
can fix today the price at which you sell your yen. The one-year forward rate
is . Therefore, by selling forward, you can make sure that you will
receive at the end of the year.
Thus, the two investments offer almost exactly the same rate of return.
7
They have
to—they are both risk-free. If the domestic interest rate were different from the cov-
ered foreign rate, you would have a money machine.
When you make the yen loan, you receive a lower interest rate. But you get an
offsetting gain because you sell yen forward at a higher price than you pay for
them today. The interest rate differential is
And the differential between the forward and spot exchange rates is
Interest rate parity theory says that the difference in interest rates must equal the dif-
ference between the forward and spot exchange rates:
f
¥/$
s
¥/$
1 r
¥
1 r
$
120,772,420/116.535 $ˇ 1,036,400
¥
ˇ116.535/$
120,700,000 1.0006 ¥120,772,420
1,000,000 120.700 ¥
ˇ120,700,000
¥ˇ120.700/$
1,000,000 1.0365 $
ˇ 1,036,500
790 PART VIII
Risk Management
7
The minor difference in our calculated end-of-year payoffs was mostly due to rounding in the in-
terest rates.
Difference in
interest rates
1 +
r
Y
1 +
r
$
equals
=
Difference between
forward and spot rates
f
Y/$
s
Y/$
=
=
In our example,
The Forward Premium and Changes in Spot Rates
Now let’s consider how the forward premium is related to changes in spot rates of
exchange. If people didn’t care about risk, the forward rate of exchange would de-
pend solely on what people expected the spot rate to be. For example, if the one-
1.0006
1.0365
116.535
120.700

Brealey−Meyers:
Principles of Corporate
Finance, Seventh Edition
VIII. Risk Management 28. Managing International
Risks
© The McGraw−Hill
Companies, 2003
year forward rate on yen is , that could only be because traders expect
the spot rate in one year’s time to be . If they expected it to be, say,
, nobody would be willing to buy yen forward. They could get more yen for
their dollar by waiting and buying spot.
Therefore the expectations theory of exchange rates tells us that the percentage
difference between the forward rate and today’s spot rate is equal to the expected
change in the spot rate:
¥
ˇ125/$
¥116.535/$
¥116.535/$
CHAPTER 28 Managing International Risks 791
Difference between
forward and spot rates
f
Y/$
s
Y/$
equals
=
=
Expected change
in spot rate
E(
s
Y/$
)
s
Y/$
=
=
Of course, this assumes that traders don’t care about risk. If they do care, the for-
ward rate can be either higher or lower than the expected spot rate. For example,
suppose that you have contracted to receive one million yen in three months, You
can wait until you receive the money before you change it into dollars, but this
leaves you open to the risk that the price of yen may fall over the next three months.
Your alternative is to sell yen forward. In this case, you are fixing today the price
at which you will sell your yen. Since you avoid risk by selling forward, you may
be willing to do so even if the forward price of yen is a little lower than the expected
spot price.
Other companies may be in the opposite position. They may have contracted to
pay out yen in three months. They can wait until the end of the three months and
then buy yen, but this leaves them open to the risk that the price of yen may rise.
It is safer for these companies to fix the price today by buying yen forward. These
companies may, therefore, be willing to buy forward even if the forward price of
yen is a little higher than the expected spot price.
Thus some companies find it safer to sell yen forward, while others find it safer
to buy yen forward. When the first group predominates, the forward price of yen
is likely to be less than the expected spot price. When the second group predomi-
nates, the forward price is likely to be greater than the expected spot price. On av-
erage you would expect the forward price to underestimate the expected spot price
just about as often as it overestimates it.
Changes in the Exchange Rate and Inflation Rates
Now we come to the third side of our quadrilateral—the relationship between
changes in the spot exchange rate and inflation rates. Suppose that you notice that
silver can be bought in the United States for $4.00 a troy ounce and sold in Japan
for . You think you may be onto a good thing. You decide to buy silver for $4.00
and put it on the first plane to Tokyo, where you sell it for . Then you exchange
your for . You have made a gross profit of $1.59 an ounce.
Of course, you have to pay transportation and insurance costs out of this, but there
should still be something left over for you.
Money machines don’t exist—not for long, anyway. As others notice the dis-
parity between the price of silver in Japan and the price in the United States, the
price will be forced down in Japan and up in the United States until the profit op-
portunity disappears. Arbitrage ensures that the dollar price of silver is about the
675/120.700 $
ˇ 5.59¥ˇ675
¥ˇ675
¥ˇ675

Brealey−Meyers:
Principles of Corporate
Finance, Seventh Edition
VIII. Risk Management 28. Managing International
Risks
© The McGraw−Hill
Companies, 2003
same in the two countries. Of course, silver is a standard and easily transportable
commodity, but the same forces should act to equalize the domestic and foreign
prices of other goods. Those goods that can be bought more cheaply abroad will be
imported, and that will force down the price of domestic products. Similarly, those
goods that can be bought more cheaply in the United States will be exported, and
that will force down the price of the foreign products.
This is often called purchasing power parity.
8
Just as the price of goods in Safeway
must be roughly the same as the price of goods in A&P, so the price of goods in
Japan when converted into dollars must be roughly the same as the price in the
United States:
Purchasing power parity implies that any differences in the rates of inflation will be
offset by a change in the exchange rate. For example, if prices are rising by 2.6 per-
cent in the United States while they are declining by percent in Japan, the num-
ber of yen that you can buy for $1 must fall by , or about 3.5 percent.
Therefore purchasing power parity says that to estimate changes in the spot rate of
exchange, you need to estimate differences in inflation rates:
9
.99/1.026 1
1.0
Dollar price of goods in the USA
yen price of goods in Japan
number of yen per dollar
792 PART VIII Risk Management
8
Economists use the term purchasing power parity to refer to the notion that the level of prices of goods
in general must be the same in the two countries. They tend to use the phrase law of one price when they
are talking about the price of a single good.
9
In other words, the expected difference in inflation rates equals the expected change in the exchange rate.
Strictly interpreted, purchasing power parity also implies that the actual difference in the inflation rates
always equals the actual change in the exchange rate.
10
In Section 24.1 we discussed Irving Fisher’s theory that over time money interest rates change to re-
flect changes in anticipated inflation. Here we argue that international differences in money interest
rates also reflect differences in anticipated inflation. This theory is sometimes known as the international
Fisher effect.
Expected difference
in inflation rates
E
(1 +
i
Y
)
E
(1 +
i
$
)
=
equals
Expected change
in spot rate
E
(
s
Y/$
)
s
Y/$
=
=
In our example,
Current spot rate expected difference in inflation rates expected spot rate
120.700 .99/1.026 116.5
Interest Rates and Inflation Rates
Now for the fourth leg! Just as water always flows downhill, so capital tends to
flow where returns are greatest. But investors are not interested in nominal returns;
they care about what their money will buy. So, if investors notice that real interest
rates are higher in Japan than in the United States, they will shift their savings into
Japan until the expected real returns are the same in the two countries. If the ex-
pected real interest rates are equal, then the difference in money rates must be
equal to the difference in the expected inflation rates:
10

Brealey−Meyers:
Principles of Corporate
Finance, Seventh Edition
VIII. Risk Management 28. Managing International
Risks
© The McGraw−Hill
Companies, 2003
In Japan the real one-year interest rate is just over 1 percent:
Ditto for the United States:
Is Life Really That Simple?
We have described above four theories that link interest rates, forward rates, spot
exchange rates, and inflation rates. Of course, such simple economic theories are
not going to provide an exact description of reality. We need to know how well they
predict actual behavior. Let’s check.
1. Interest Rate Parity Theory Interest rate parity theory says that the yen rate of
interest covered for exchange risk should be the same as the dollar rate. In the ex-
ample that we gave you earlier we used the rates of interest on dollar and yen de-
posits in London. Since money can be moved easily between these deposits, inter-
est rate parity almost always holds. In fact, dealers set the forward price of yen by
looking at the difference between the interest rates on deposits of dollars and yen.
11
The relationship does not hold so exactly for deposits made in different domes-
tic money markets. In these cases taxes and government regulations sometimes
prevent the citizens of one country from switching out of one country’s bank de-
posits and covering their exchange risk in the forward market.
2. The Expectations Theory of Forward Rates How well does the expectations
theory explain the level of forward rates? Scholars who have studied exchange
rates have found that forward rates typically exaggerate the likely change in the
spot rate. When the forward rate appears to predict a sharp rise in the spot rate (a
forward premium), the forward rate tends to overestimate the rise in the spot rate.
Conversely, when the forward rate appears to predict a fall in the currency (a for-
ward discount), it tends to overestimate this fall.
12
This finding is not consistent with the expectations theory. Instead it looks as
if sometimes companies are prepared to give up return to buy forward currency
and other times they are prepared to give up return to sell forward currency. In
r
$
1real2
1 r
$
E11 i
$
2
1
1.0365
1.026
1 .0102
r
¥
1real2
1 r
¥
E11 i
¥
2
1
1.0006
.99
1 .0107
CHAPTER 28 Managing International Risks 793
Difference in
interest rates
1 +
r
Y
1 +
r
$
equals
=
Expected difference
in inflation rates
E
(1 +
i
Y
)
E
(1 +
i
$
)
=
11
The forward exchange rates shown in the Financial Times and reproduced in Table 28.1 are simply cal-
culated from the differences in interest rates.
12
Many researchers have even found that, when the forward rate predicts a rise, the spot rate is more
likely to fall, and vice versa. For a readable discussion of this puzzling finding, see K. A. Froot and R. H.
Thaler, “Anomalies: Foreign Exchange,” Journal of Political Economy 4 (1990), pp. 179–192.
Brealey−Meyers:
Principles of Corporate
Finance, Seventh Edition
VIII. Risk Management 28. Managing International
Risks
© The McGraw−Hill
Companies, 2003
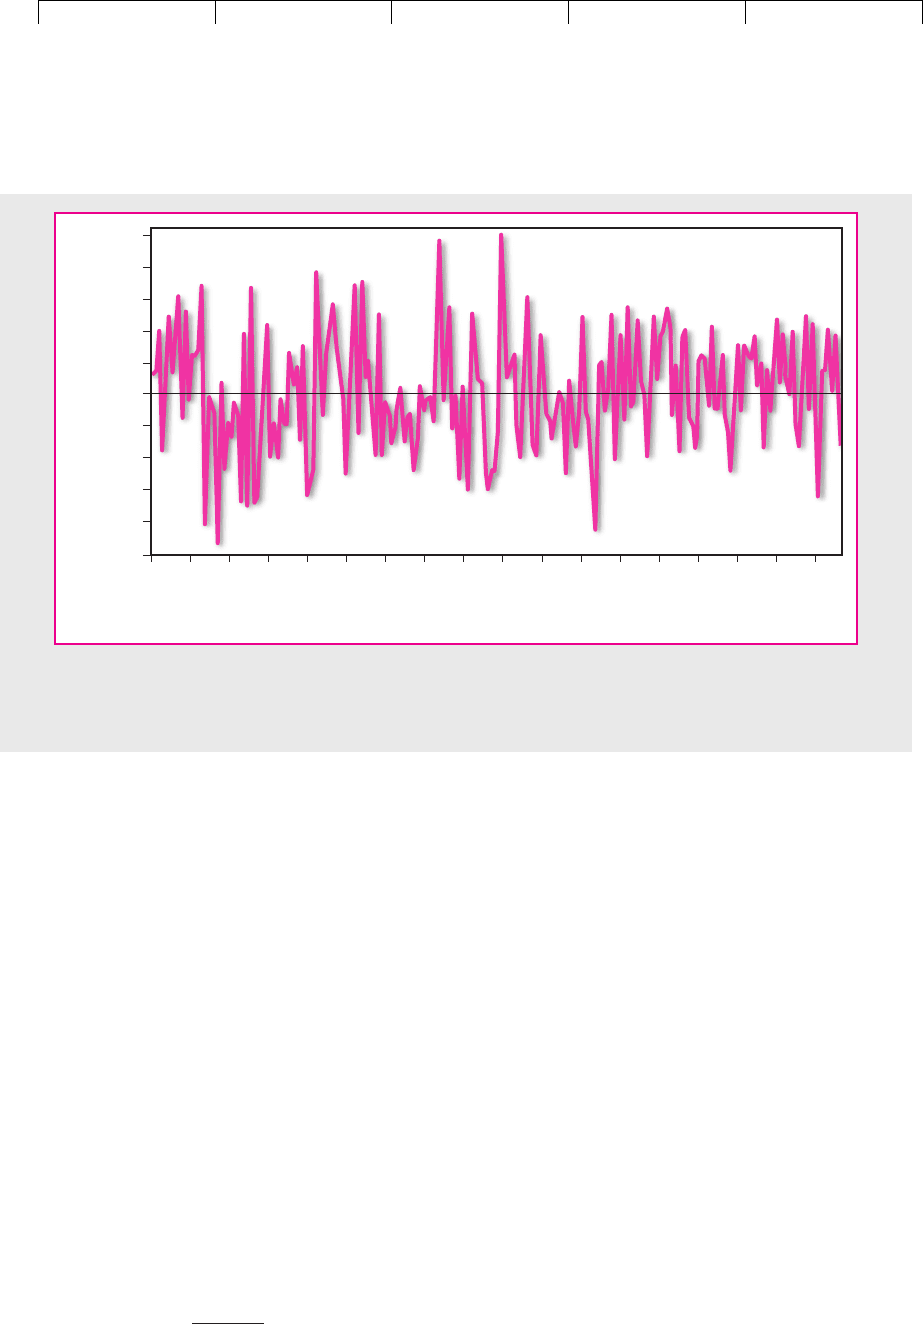
other words, forward rates seem to contain a risk premium, but the sign of this
premium swings backward and forward.
13
You can see this from Figure 28.1. Al-
most half the time the forward rate for the Swiss franc overstates the likely future
spot rate and half the time it understates the likely spot rate. On average the for-
ward rate and future spot rate are almost identical. This is important news for the
financial manager; it means that a company which always uses the forward mar-
ket to protect against exchange rate movements does not pay any extra for this
insurance.
3. Purchasing Power Parity Theory What about the third side of our quadrilat-
eral—purchasing power parity theory? No one who has compared prices in for-
eign stores with prices at home really believes that prices are the same throughout
the world. Look, for example, at Table 28.2, which shows the price of a Big Mac in
different countries. Notice that at current rates of exchange a Big Mac costs $3.65 in
Switzerland but only $2.54 in the United States. To equalize prices in Switzerland
and the United States, the number of Swiss francs that you could buy for your dol-
lar would need to increase by , or 44 percent.
This suggests a possible way to make a quick buck. Why don’t you buy a
hamburger-to-go in (say) the Philippines for the equivalent of $1.17 and take it
for resale in Switzerland, where the price in dollars is $3.65? The answer, of
course, is that the gain would not cover the costs. The same good can be sold for
3.65/2.54 1 .44
794 PART VIII
Risk Management
13
For evidence that forward exchange rates contain risk premia that are sometimes positive and some-
times negative, see, for example, E. F. Fama, “Forward and Spot Exchange Rates,” Journal of Monetary
Economics 14 (1984), pp. 319–338.
Nov. 83
Nov. 84
Nov. 85
Nov. 86
Nov. 87
Nov. 88
Nov. 89
Nov. 90
Nov. 91
Nov. 92
Nov. 93
Nov. 94
Nov. 95
Nov. 96
Nov. 97
Nov. 98
Nov. 99
Nov. 00
-10
-8
-6
-4
-2
0
Percent error
2
4
6
8
10
FIGURE 28.1
Percentage error from using the one-month forward rate for Swiss francs to forecast next month’s spot rate.
Note that the forward rate overestimates and underestimates the spot rate with about equal frequency.

Brealey−Meyers:
Principles of Corporate
Finance, Seventh Edition
VIII. Risk Management 28. Managing International
Risks
© The McGraw−Hill
Companies, 2003
different prices in different countries because transportation is costly and in-
convenient.
14
On the other hand, there is clearly some relationship between inflation and
changes in exchange rates. For example, between 1994 and 1999 prices in Turkey
rose about 20 times. Or, to put it another way, you could say that the purchasing
power of money in Turkey declined by about 95 percent. If exchange rates had not
adjusted, Turkish exporters would have found it impossible to sell their goods. But,
of course, exchange rates did adjust. In fact, the value of the Turkish currency de-
clined by 92 percent relative to the U.S. dollar.
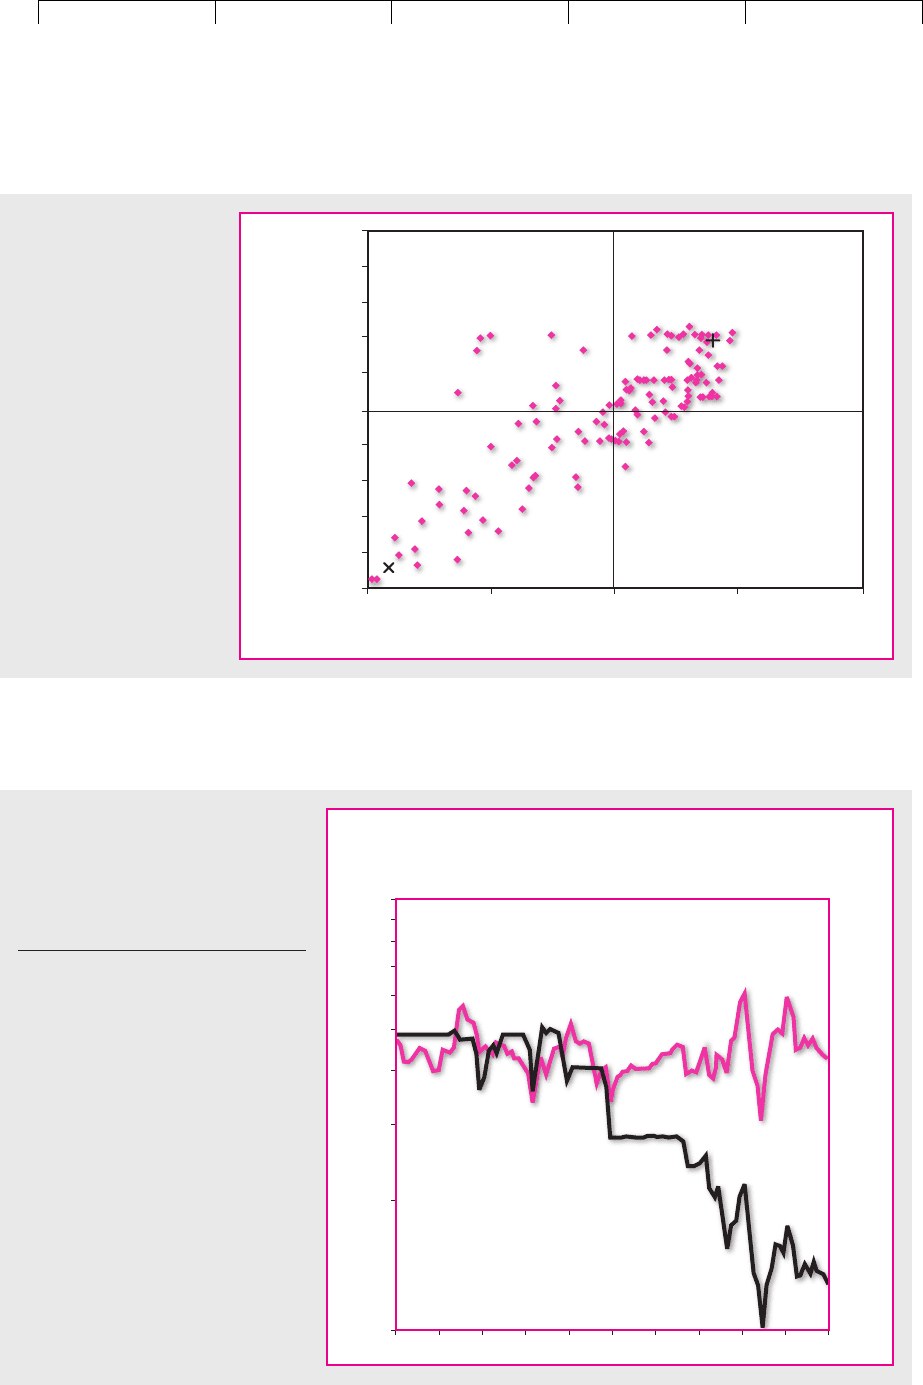
Turkey is an extreme case, but in Figure 28.2 we have plotted the relative change in
purchasing power for a sample of countries against the change in the exchange rate.
Turkey is tucked in the bottom left-hand corner; the United States is closer to the top
right. You can see that although the relationship is far from exact, large differences in
inflation rates are generally accompanied by an offsetting change in the exchange rate.
Strictly speaking, purchasing power parity theory implies that the differential
inflation rate is always identical to the change in the spot rate. But we don’t need
to go as far as that. We should be content if the expected difference in the inflation
rates equals the expected change in the spot rate. That’s all we wrote on the third
side of our quadrilateral. Look, for example, at Figure 28.3. The solid line shows
that in 2000 sterling bought almost 70 percent fewer dollars than it did at the be-
ginning of the century. But this decline in the price of sterling was largely matched
by the higher inflation rate in the United Kingdom. The thin line shows that the
inflation-adjusted, or real, exchange rate ended the century at roughly the same
level as it began.
15
Of course, the real exchange rate does change, sometimes dra-
matically. For example, the real value of sterling almost halved between 1980 and
1985 before recovering in the next five years. However, if you were a financial man-
ager called on to make a long-term forecast of the exchange rate, you could not
£1
CHAPTER 28
Managing International Risks 795
Local Price Local Price
Converted to Converted to
Country U.S. Dollars Country U.S. Dollars
Australia 1.52 Japan 2.38
Brazil 1.64 Mexico 2.36
Canada 2.14 Philippines 1.17
China 1.20 Russia 1.21
Denmark 2.93 Sweden 2.33
Germany 2.30 Switzerland 3.65
Hong Kong 1.37 United Kingdom 2.85
Hungary 1.32 United States 2.54
TABLE 28.2
Price of Big Mac hamburgers in
different countries.
Source: “Big Mac Currencies,” The
Economist, April 21, 2001, p. 74.
14
Of course, even within a currency area there may be considerable price variations. The price of a Big
Mac, for example, differs substantially from one part of the United States to another. And even after the
introduction of the euro, the price of Big Macs varied between $1.96 in Italy and $2.49 in France.
15
The real exchange rate is equal to the nominal exchange rate multiplied by the inflation differential.
For example, suppose that the value of sterling falls from to at the same time that
the price of goods rises 10 percent faster in the United Kingdom than in the United States. The inflation-
adjusted, or real, exchange rate is unchanged at
Initial exchange rate 11 i
£
2/11 i
$
2 1.40 1.1 $ˇ 1.54/£
$ˇ 1.40 £1$ˇ 1.54 £1
Brealey−Meyers:
Principles of Corporate
Finance, Seventh Edition
VIII. Risk Management 28. Managing International
Risks
© The McGraw−Hill
Companies, 2003
796 PART VIII Risk Management
–100
–100
–20
60
80
–40
40
20
–60
–80
0
100
–50 0 50 100
Relative change in purchasing power, percent
Relative change in exchange
rate, percent
FIGURE 28.2
A decline in the exchange
rate and a decline in a
currency’s purchasing
power usually go hand in
hand. In this diagram, each
of the 138 points repre-
sents the experience of a
different country between
1994 and 1999. The vertical
axis shows the change in
the value of the foreign
currency relative to the
average. The horizontal axis
shows the change in
purchasing power relative
to the average. The at
the lower left is Turkey; the
at the upper right is the
United States.
1900 1910 1920 1930 1940 1950 1960 1970 1980 1990 2000
Year
1
2
3
4
5
6
7
8
9
10
U.S. dollar/
British pound
(in log scale)
Nominal versus Real
Exchange Rates
Real exchange rate
Nominal exchange rate
FIGURE 28.3
Since 1900 sterling has fallen sharply in
value against the dollar. But this fall has
largely offset the higher inflation rate in
the UK. The real value of sterling has
been roughly constant.
Source: N. Abuaf and P. Jorion, “Purchasing
Power Parity in the Long Run,” Journal of
Finance 45 (March 1990), pp. 157–174. We
are grateful to Li Jin for extending the data.