Brealey, Myers. Principles of Corporate Finance. 7th edition
Подождите немного. Документ загружается.

Brealey−Meyers:
Principles of Corporate
Finance, Seventh Edition
III. Practical Problems in
Capital Budgeting
10. A Project is Not a Black
Box
© The McGraw−Hill
Companies, 2003
demand will be stronger than you anticipated and unit prices will be higher. And
why look in isolation at the effect of an increase in price? If inflation pushes prices
to the upper end of your range, it is quite probable that costs will also be inflated.
Sometimes the analyst can get around these problems by defining underlying
variables so that they are roughly independent. But you cannot push one-at-a-time
sensitivity analysis too far. It is impossible to obtain expected, optimistic, and pes-
simistic values for total project cash flows from the information in Table 10.2.
Scenario Analysis
If the variables are interrelated, it may help to consider some alternative plausible
scenarios. For example, perhaps the company economist is worried about the pos-
sibility of another sharp rise in world oil prices. The direct effect of this would be
to encourage the use of electrically powered transportation. The popularity of com-
pact cars after the oil price increases in the 1970s leads you to estimate that an im-
mediate 20 percent price rise in oil would enable you to capture an extra 3 percent
of the scooter market. On the other hand, the economist also believes that higher
oil prices would prompt a world recession and at the same time stimulate inflation.
In that case, market size might be in the region of .8 million scooters and both prices
and cost might be 15 percent higher than your initial estimates. Table 10.3 shows
that this scenario of higher oil prices and recession would on balance help your
new venture. Its NPV would increase to ¥6.5 billion.
Managers often find scenario analysis helpful. It allows them to look at differ-
ent but consistent combinations of variables. Forecasters generally prefer to give an
258 PART III
Practical Problems in Capital Budgeting
Cash Flows, Years 1–10, ¥ Billions
Base Case High Oil Prices and Recession Case
1. Revenue 37.5 44.9
2. Variable cost 30.0 35.9
3. Fixed cost 3.0 3.5
4. Depreciation 1.5 1.5
5. Pretax profit (1 2 3 4) 3.0 4.0
6. Tax 1.5 2.0
7. Net profit (5 6) 1.5 2.0
8. Net cash flow (4 7) 3.0 3.5
PV of cash flows 18.4 21.5
NPV 3.4 6.5
Assumptions
Base Case High Oil Prices and Recession Case
Market size 1 million .8 million
Market share .1 .13
Unit price ¥375,000 ¥431,300
Unit variable cost ¥300,000 ¥345,000
Fixed cost ¥3 billion ¥3.5 billion
TABLE 10.3
How the NPV of the electric scooter project would be affected by higher oil prices and a world
recession.

Brealey−Meyers:
Principles of Corporate
Finance, Seventh Edition
III. Practical Problems in
Capital Budgeting
10. A Project is Not a Black
Box
© The McGraw−Hill
Companies, 2003
estimate of revenues or costs under a particular scenario than to give some ab-
solute optimistic or pessimistic value.
Break-Even Analysis
When we undertake a sensitivity analysis of a project or when we look at alterna-
tive scenarios, we are asking how serious it would be if sales or costs turned out to
be worse than we forecasted. Managers sometimes prefer to rephrase this question
and ask how bad sales can get before the project begins to lose money. This exer-
cise is known as break-even analysis.
In the left-hand portion of Table 10.4 we set out the revenues and costs of the
electric scooter project under different assumptions about annual sales.
2
In the
right-hand portion of the table we discount these revenues and costs to give
the present value of the inflows and the present value of the outflows. Net present
value is of course the difference between these numbers.
You can see that NPV is strongly negative if the company does not produce a
single scooter. It is just positive if (as expected) the company sells 100,000 scooters
and is strongly positive if it sells 200,000. Clearly the zero-NPV point occurs at a lit-
tle under 100,000 scooters.
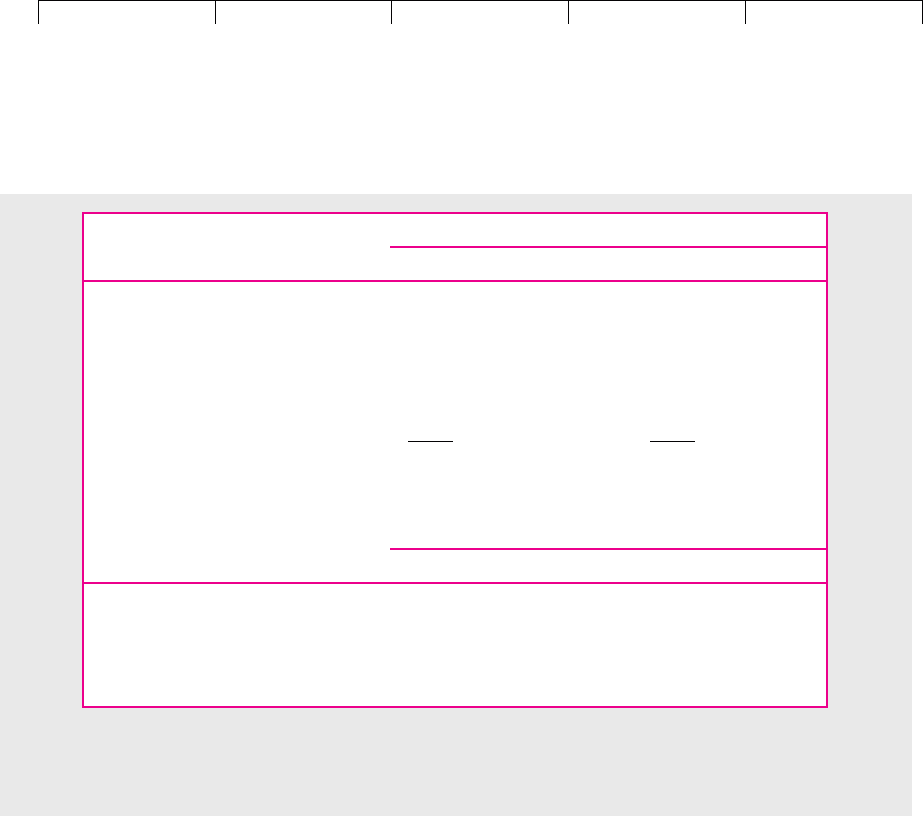
In Figure 10.1 we have plotted the present value of the inflows and outflows un-
der different assumptions about annual sales. The two lines cross when sales are
85,000 scooters. This is the point at which the project has zero NPV. As long as sales
are greater than 85,000, the project has a positive NPV.
3
Managers frequently calculate break-even points in terms of accounting profits
rather than present values. Table 10.5 shows Otobai’s after-tax profits at three lev-
els of scooter sales. Figure 10.2 once again plots revenues and costs against sales.
But the story this time is different. Figure 10.2, which is based on accounting prof-
its, suggests a break-even of 60,000 scooters. Figure 10.1, which is based on present
values, shows a break-even at 85,000 scooters. Why the difference?
When we work in terms of accounting profit, we deduct depreciation of ¥1.5 bil-
lion each year to cover the cost of the initial investment. If Otobai sells 60,000 scoot-
ers a year, revenues will be sufficient both to pay operating costs and to recover the
CHAPTER 10
A Project Is Not a Black Box 259
2
Notice that if the project makes a loss, this loss can be used to reduce the tax bill on the rest of the com-
pany’s business. In this case the project produces a tax saving—the tax outflow is negative.
3
We could also calculate break-even sales by plotting equivalent annual costs and revenues. Of course,
the break-even point would be identical at 85,000 scooters.
Inflows Outflows
Year 0 Years 1–10
Unit Sales, Revenue, Variable Fixed PV PV
Thousands Years 1–10 Investment Costs Costs Taxes Inflows Outflows NPV
00 15032.25 0 19.6 19.6
100 37.5 15 30 3 1.5 230.4 227.0 3.4
200 75.0 15 60 3 5.25 460.8 434.4 26.4
TABLE 10.4
NPV of electric scooter project under different assumptions about unit sales (figures in ¥ billions except as noted).
Brealey−Meyers:
Principles of Corporate
Finance, Seventh Edition
III. Practical Problems in
Capital Budgeting
10. A Project is Not a Black
Box
© The McGraw−Hill
Companies, 2003
initial outlay of ¥15 billion. But they will not be sufficient to repay the opportunity
cost of capital on that ¥15 billion. If we allow for the fact that the ¥15 billion could
have been invested elsewhere to earn 10 percent, the equivalent annual cost of the
investment is not ¥1.5 billion but ¥2.44 billion.
4
260 PART III Practical Problems in Capital Budgeting
Scooter sales, thousands
Break-even point:
NPV = 0
PV outflows
PV inflows
20085
PV, billions of yen
200
19.6
400
FIGURE 10.1
A break-even chart
showing the present
values of Otobai’s cash
inflows and outflows under
different assumptions
about unit sales. NPV
is zero when sales are
85,000.
Profit
Unit Sales, Variable Fixed Total after
Thousands Revenue Costs Costs Depreciation Taxes Costs Tax
0 0 0 3 1.5 2.25 2.25 2.25
100 37.5 30 3 1.5 1.5 36.0 1.5
200 75.0 60 3 1.5 5.25 69.75 5.25
TABLE 10.5
The electric scooter project’s accounting profit under different assumptions about unit sales (figures in ¥ billions except
as noted).
4
To calculate the equivalent annual cost of the initial ¥15 billion investment, we divide by the 10-year
annuity factor for a 10 percent discount rate:
See Section 6.3.
The annual revenues at 85,000 scooters per year are about ¥31.9 billion. You can check that this is
sufficient to cover variable costs, fixed costs, and taxes and still leave ¥2.44 billion per year to recover
the ¥15 billion initial investment and a 10 percent return on that investment.
15
6.145
¥2.44 billion
Equivalent annual cost
investment
10-year annuity factor
Brealey−Meyers:
Principles of Corporate
Finance, Seventh Edition
III. Practical Problems in
Capital Budgeting
10. A Project is Not a Black
Box
© The McGraw−Hill
Companies, 2003
Companies that break even on an accounting basis are really making a loss—they
are losing the opportunity cost of capital on their investment. Reinhardt has described
a dramatic example of this mistake.
5
In 1971 Lockheed managers found themselves
having to give evidence to Congress on the viability of the company’s L-1011 TriStar
program. They argued that the program appeared to be commercially attractive and
that TriStar sales would eventually exceed the break-even point of about 200 aircraft.
But in calculating this break-even point, Lockheed appears to have ignored the op-
portunity cost of the huge $1 billion capital investment on this project. Had it allowed
for this cost, the break-even point would probably have been nearer to 500 aircraft.
Operating Leverage and Break-Even Points
Break-even charts like Figure 10.1 help managers appreciate operating leverage, that
is, project exposure to fixed costs. Remember from Section 9.5 that high operating
leverage means high risk, other things equal, of course.
The electric scooter project had low fixed costs, only ¥3 billion against projected
revenues of ¥37.5 billion. But suppose Otobai now considers a different production
technology with lower variable costs of only ¥120,000 per unit (versus ¥300,000 per
unit) but higher fixed costs of ¥19 billion. Total forecasted production costs
are lower (12 19 ¥31 billion versus ¥33 billion), so profitability improves—
compare Table 10.6 to Table 10.1. Project NPV increases to ¥9.6 billion.
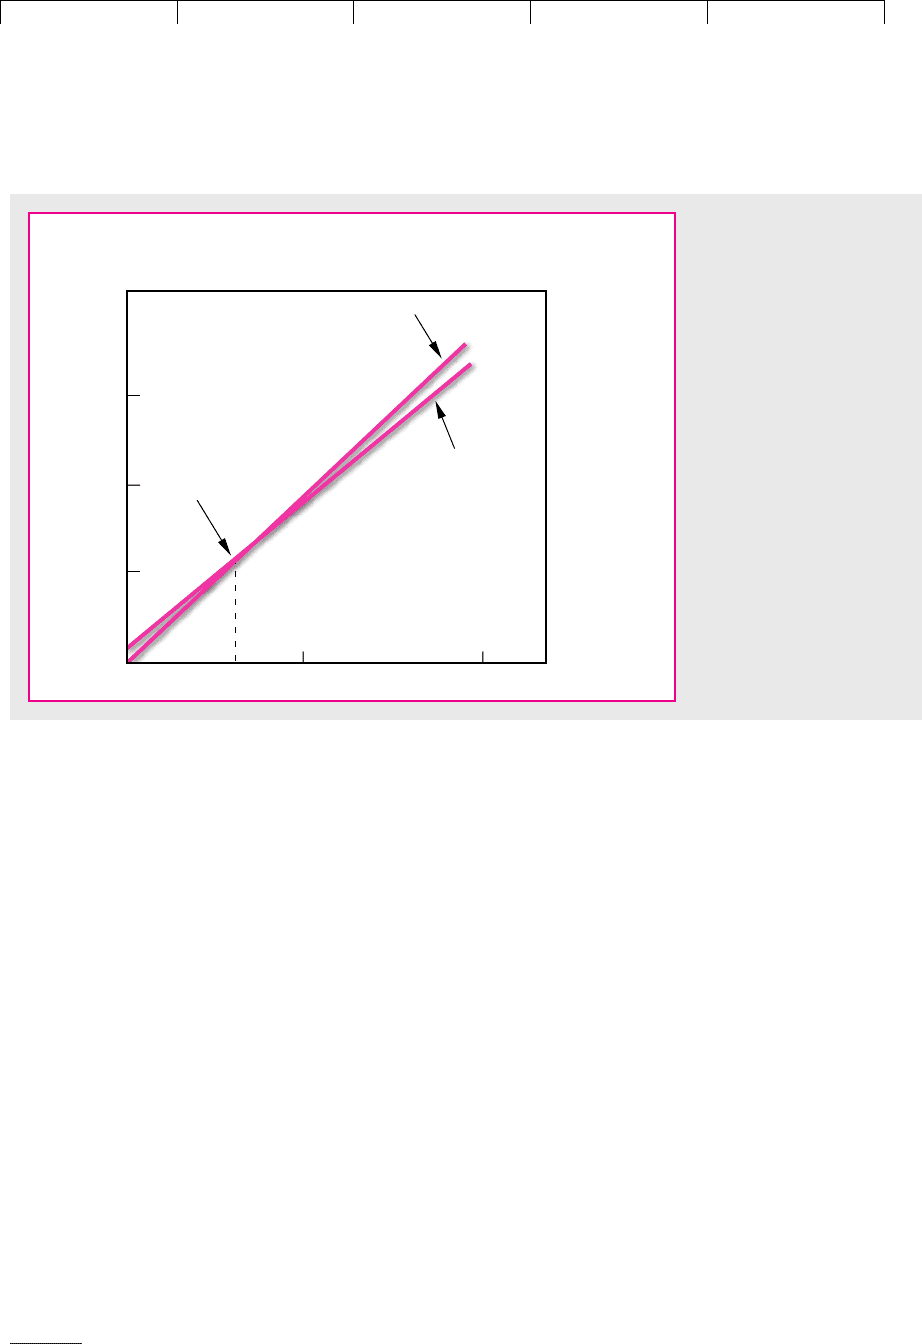
Figure 10.3 is the new break-even chart. Break-even sales have increased to 88,000
(that’s bad), even though total production costs have fallen. A new sensitivity analy-
sis would show that project NPV is much more exposed to changes in market size,
CHAPTER 10
A Project Is Not a Black Box 261
Scooter sales,
thousands
Break-even point:
Profit = 0
Costs
(including depreciation
and taxes)
Revenues
20060
Accounting revenues
and costs,
billions of yen
20
60
40
FIGURE 10.2
Sometimes break-even
charts are constructed in
terms of accounting
numbers. After-tax profit is
zero when sales are 60,000.
5
U. E. Reinhardt, “Break-Even Analysis for Lockheed’s TriStar: An Application of Financial Theory,”
Journal of Finance 28 (September 1973), pp. 821–838.
Brealey−Meyers:
Principles of Corporate
Finance, Seventh Edition
III. Practical Problems in
Capital Budgeting
10. A Project is Not a Black
Box
© The McGraw−Hill
Companies, 2003
market share, or unit price. All of these differences can be traced to the higher fixed
costs of the alternative production technology.
Is the alternative technology better than the original one? The financial man-
ager would have to consider the alternative technology’s higher business risk,
and perhaps recompute NPV at a higher discount rate, before making a final
decision.
6
262 PART III Practical Problems in Capital Budgeting
Year 0 Years 1–10
Investment 15
1. Revenue 37.5
2. Variable cost 12.0
3. Fixed cost 19.0
4. Depreciation 1.5
5. Pretax profit (1 2 3 4) 5.0
6. Tax 2.5
7. Net profit (5 6) 2.5
8. Operating cash flow (4 7) 4.0
Net cash flow 15 4.0
NPV 15
a
10
t1
4.0
11.12
t
¥9.6 billion
TABLE 10.6
Cash-flow forecasts and PV for the electric
scooter project, here assuming a production
technology with high fixed costs but low
total costs (figures in ¥ billions). Compare
Table 10.1.
Scooter sales,
thousands
Break-even point:
NPV = 0
PV outflows
PV inflows
PV, billions of yen
20088
200
400
68.8
FIGURE 10.3
Break-even chart for an
alternative production
technology with higher fixed
costs. Notice that break-even
sales increase to 88,000.
Compare Figure 10.1.
6
He or she could use the procedures outlined in Section 9.5 to recalculate beta and come up with a new
discount rate.

Brealey−Meyers:
Principles of Corporate
Finance, Seventh Edition
III. Practical Problems in
Capital Budgeting
10. A Project is Not a Black
Box
© The McGraw−Hill
Companies, 2003
Sensitivity analysis allows you to consider the effect of changing one variable at a
time. By looking at the project under alternative scenarios, you can consider the ef-
fect of a limited number of plausible combinations of variables. Monte Carlo simu-
lation is a tool for considering all possible combinations. It therefore enables you
to inspect the entire distribution of project outcomes. The use of simulation in cap-
ital budgeting was first advocated by David Hertz
7
and McKinsey and Company,
the management consultants.
Imagine that you are a gambler at Monte Carlo. You know nothing about the
laws of probability (few casual gamblers do), but a friend has suggested to you
a complicated strategy for playing roulette. Your friend has not actually tested
the strategy but is confident that it will on the average give you a 2
1
⁄2 percent re-
turn for every 50 spins of the wheel. Your friend’s optimistic estimate for any
series of 50 spins is a profit of 55 percent; your friend’s pessimistic estimate is a
loss of 50 percent. How can you find out whether these really are the odds? An
easy but possibly expensive way is to start playing and record the outcome at
the end of each series of 50 spins. After, say, 100 series of 50 spins each, plot a
frequency distribution of the outcomes and calculate the average and upper
and lower limits. If things look good, you can then get down to some serious
gambling.
An alternative is to tell a computer to simulate the roulette wheel and the strat-
egy. In other words, you could instruct the computer to draw numbers out of its
hat to determine the outcome of each spin of the wheel and then to calculate how
much you would make or lose from the particular gambling strategy.
That would be an example of Monte Carlo simulation. In capital budgeting we
replace the gambling strategy with a model of the project, and the roulette wheel
with a model of the world in which the project operates. Let’s see how this might
work with our project for an electrically powered scooter.
Simulating the Electric Scooter Project
Step 1: Modeling the Project The first step in any simulation is to give the com-
puter a precise model of the project. For example, the sensitivity analysis of the
scooter project was based on the following implicit model of cash flow:
This model of the project was all that you needed for the simpleminded sensi-
tivity analysis that we described above. But if you wish to simulate the whole proj-
ect, you need to think about how the variables are interrelated.
For example, consider the first variable—market size. The marketing depart-
ment has estimated a market size of 1 million scooters in the first year of the pro-
ject’s life, but of course you do not know how things will work out. Actual market
Costs 1market size market share variable unit cost2 fixed cost
Revenues market size market share unit price
Cash flow 1revenues costs depreciation2 11 tax rate2 depreciation
CHAPTER 10
A Project Is Not a Black Box 263
10.2 MONTE CARLO SIMULATION
7
See D. B. Hertz, “Investment Policies that Pay Off,” Harvard Business Review 46 (January–February
1968), pp. 96–108.

Brealey−Meyers:
Principles of Corporate
Finance, Seventh Edition
III. Practical Problems in
Capital Budgeting
10. A Project is Not a Black
Box
© The McGraw−Hill
Companies, 2003
size will exceed or fall short of expectations by the amount of the department’s
forecast error:
You expect the forecast error to be zero, but it could turn out to be positive or neg-
ative. Suppose, for example, that the actual market size turns out to be 1.1 million.
That means a forecast error of 10 percent, or .1:
You can write the market size in the second year in exactly the same way:
But at this point you must consider how the expected market size in year 2 is af-
fected by what happens in year 1. If scooter sales are below expectations in year 1,
it is likely that they will continue to be below in subsequent years. Suppose that a
shortfall in sales in year 1 would lead you to revise down your forecast of sales in
year 2 by a like amount. Then
Now you can rewrite the market size in year 2 in terms of the actual market size in
the previous year plus a forecast error:
In the same way you can describe the expected market size in year 3 in terms of
market size in year 2 and so on.
This set of equations illustrates how you can describe interdependence between
different periods. But you also need to allow for interdependence between different
variables. For example, the price of electrically powered scooters is likely to increase
with market size. Suppose that this is the only uncertainty and that a 10 percent
shortfall in market size would lead you to predict a 3 percent reduction in price.
Then you could model the first year’s price as follows:
Then, if variations in market size exert a permanent effect on price, you can define
the second year’s price as
actual price, year 1 °1
.3 error in
market size
forecast,
year 2
¢
Price, year 2 expected price, year 2 °1
.3 error in
market size
forecast,
year 2
¢
Price, year 1 expected price, year 1 °1
.3 error in
market size
forecast,
year 1
¢
Market size, year 2 market size, year 1 a1
forecast error,
year 2
b
Expected market size, year 2 actual market size, year 1
Market size, year 2 expected market size, year 2 a1
forecast error,
year 2
b
Market size, year 1 1 11 .12 1.1 million
Market size, year 1 expected market size, year 1 a1
forecast error,
year 1
b
264 PART III
Practical Problems in Capital Budgeting
Brealey−Meyers:
Principles of Corporate
Finance, Seventh Edition
III. Practical Problems in
Capital Budgeting
10. A Project is Not a Black
Box
© The McGraw−Hill
Companies, 2003
Notice how we have linked each period’s selling price to the actual selling prices
(including forecast error) in all previous periods. We used the same type of linkage
for market size. These linkages mean that forecast errors accumulate; they do not
cancel out over time. Thus, uncertainty increases with time: The farther out you
look into the future, the more the actual price or market size may depart from your
original forecast.
The complete model of your project would include a set of equations for each of
the variables: market size, price, market share, unit variable cost, and fixed cost.
Even if you allowed for only a few interdependencies between variables and across
time, the result would be quite a complex list of equations.
8
Perhaps that is not a
bad thing if it forces you to understand what the project is all about. Model build-
ing is like spinach: You may not like the taste, but it is good for you.
Step 2: Specifying Probabilities Remember the procedure for simulating the
gambling strategy? The first step was to specify the strategy, the second was to
specify the numbers on the roulette wheel, and the third was to tell the computer
to select these numbers at random and calculate the results of the strategy:
CHAPTER 10
A Project Is Not a Black Box 265
8
Specifying the interdependencies is the hardest and most important part of a simulation. If all compo-
nents of project cash flows were unrelated, simulation would rarely be necessary.
9
Suppose “near certainty” means “99 percent of the time.” If forecast errors are normally distributed,
this degree of certainty requires a range of plus or minus three standard deviations.
Other distributions could, of course, be used. For example, the marketing department may view any
market size between .85 and 1.15 million scooters as equally likely. In that case the simulation would re-
quire a uniform (rectangular) distribution of forecast errors.
Step 1
Model the strategy
Step 2
Specify numbers on
roulette wheel
Step 3
Select numbers and
calculate results
of strategy
The steps are just the same for your scooter project:
Step 1
Model the project
Step 2
Specify probabilities
for forecast errors
Step 3
Select numbers for
forecast errors and
calculate cash flows
Think about how you might go about specifying your possible errors in fore-
casting market size. You expect market size to be 1 million scooters. You obviously
don’t think that you are underestimating or overestimating, so the expected fore-
cast error is zero. On the other hand, the marketing department has given you a
range of possible estimates. Market size could be as low as .85 million scooters or
as high as 1.15 million scooters. Thus the forecast error has an expected value of 0
and a range of plus or minus 15 percent. If the marketing department has in fact
given you the lowest and highest possible outcomes, actual market size should fall
somewhere within this range with near certainty.
9
That takes care of market size; now you need to draw up similar estimates of the
possible forecast errors for each of the other variables that are in your model.
Brealey−Meyers:
Principles of Corporate
Finance, Seventh Edition
III. Practical Problems in
Capital Budgeting
10. A Project is Not a Black
Box
© The McGraw−Hill
Companies, 2003
Step 3: Simulate the Cash Flows The computer now samples from the distribution
of the forecast errors, calculates the resulting cash flows for each period, and
records them. After many iterations you begin to get accurate estimates of the prob-
ability distributions of the project cash flows—accurate, that is, only to the extent
that your model and the probability distributions of the forecast errors are accu-
rate. Remember the GIGO principle: “Garbage in, garbage out.”
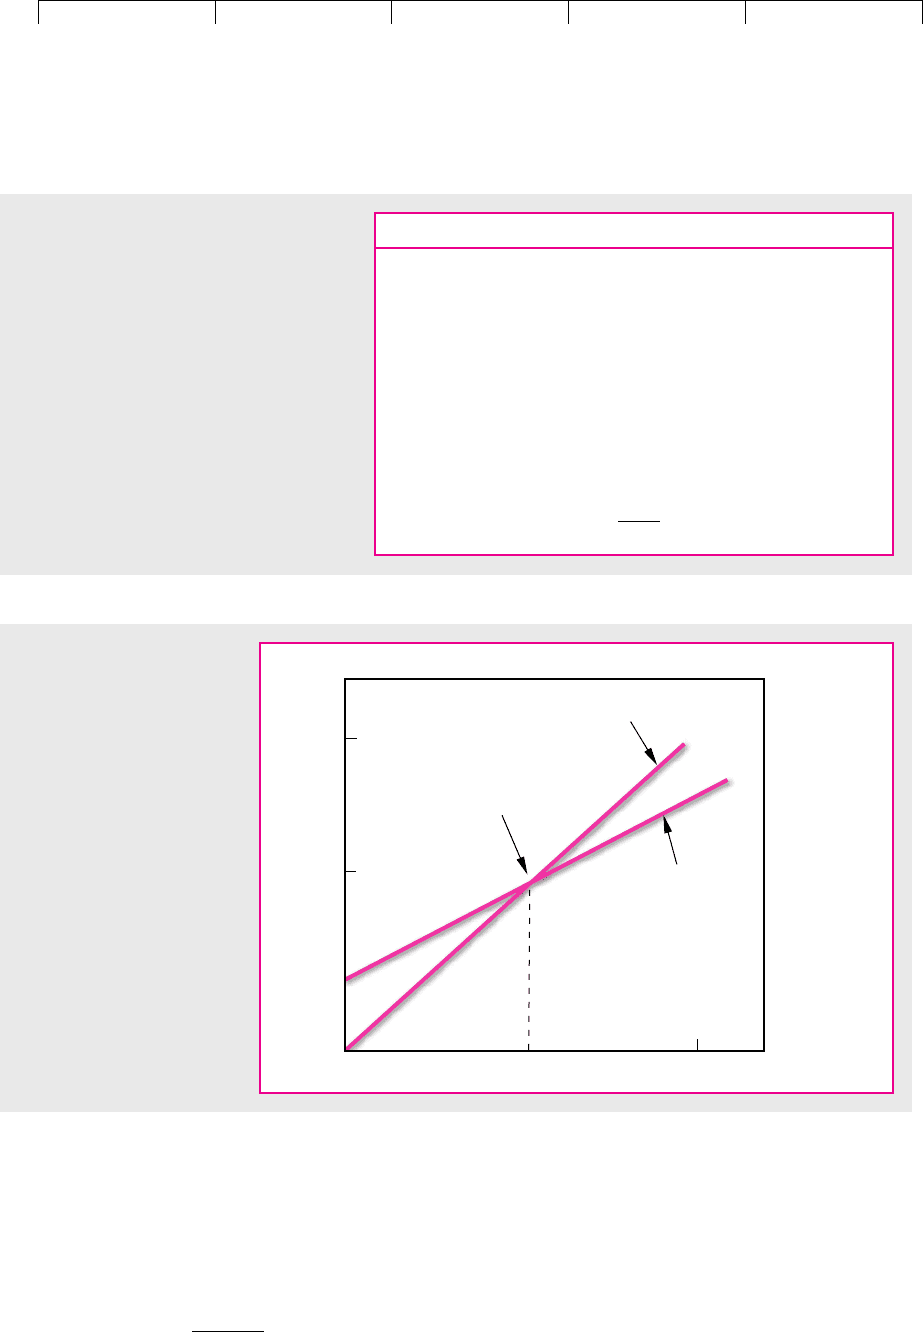
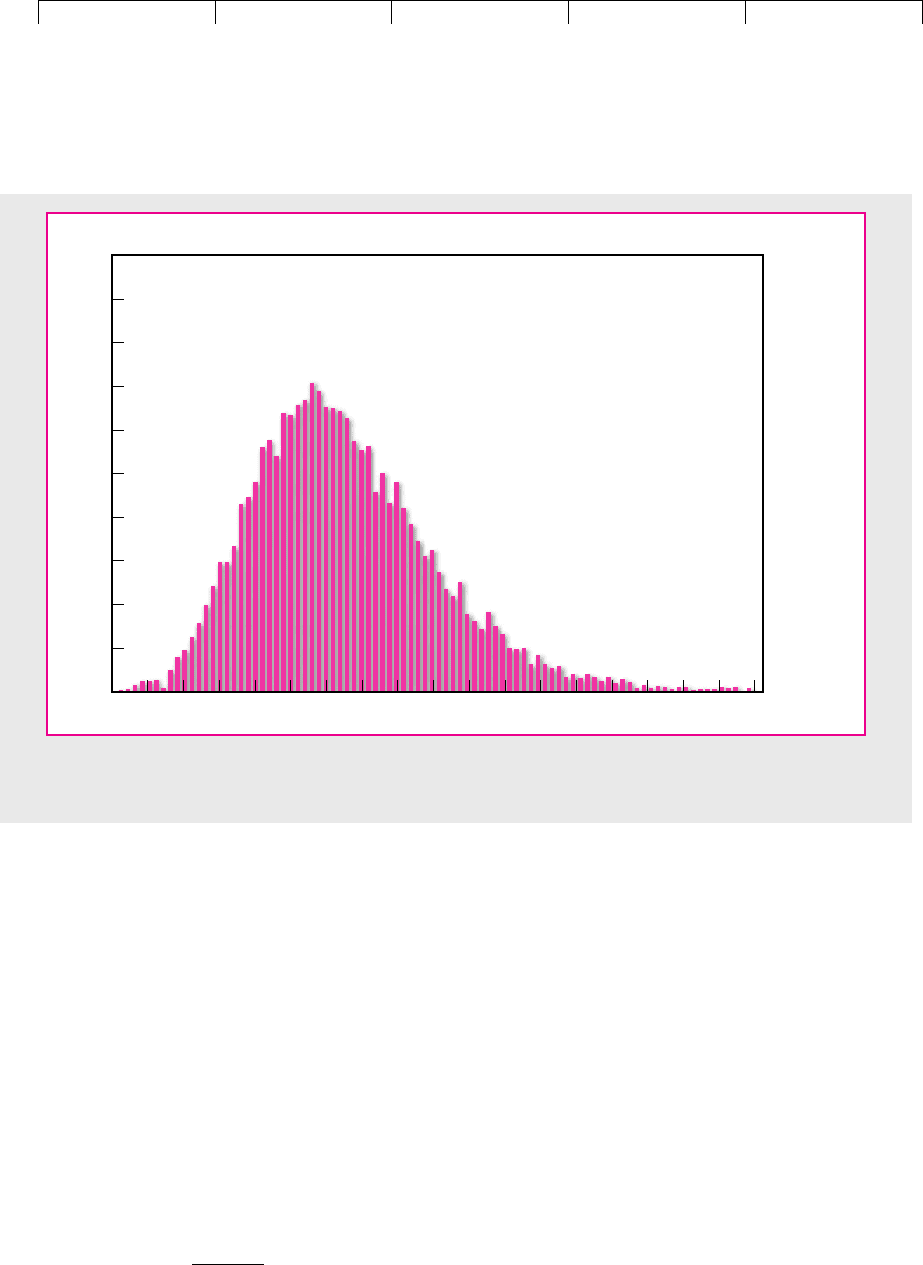
Figure 10.4 shows part of the output from an actual simulation of the electric
scooter project.
10
Note the positive skewness of the outcomes—very large out-
comes are more likely than very small ones. This is common and realistic when
forecast errors accumulate over time. Because of the skewness the average cash
flow is somewhat higher than the most likely outcome; in other words, a bit to the
right of the peak of the distribution.
11
Step 4: Calculate Present Value The distributions of project cash flows should al-
low you to calculate the expected cash flows more accurately. In the final step you
need to discount these expected cash flows to find present value.
266 PART III
Practical Problems in Capital Budgeting
10
These are actual outputs from Crystal Ball™ software used with an EXCEL spreadsheet program. The
simulation assumed annual forecast errors were normally distributed and ran through 10,000 trials. We
thank Christopher Howe for running the simulation.
11
When you are working with cash-flow forecasts, bear in mind the distinction between the expected
value and the most likely (or modal) value. Present values are based on expected cash flows—that is, the
probability-weighted average of the possible future cash flows. If the distribution of possible outcomes is
skewed to the right as in Figure 10.4, the expected cash flow will be greater than the most likely cash flow.
Cash flow,
billions of
yen
Year 10: 10,000 Trials
8.5 9.08.07.57.06.56.05.55.04.54.03.53.02.52.01.51.0.50
0.000
0.005
0.010
0.015
0.020
0.025
0.030
0.035
0.040
0.045
0.050
Frequency
FIGURE 10.4
Simulation of cash flows for year 10 of the electric scooter project.
Brealey−Meyers:
Principles of Corporate
Finance, Seventh Edition
III. Practical Problems in
Capital Budgeting
10. A Project is Not a Black
Box
© The McGraw−Hill
Companies, 2003
Simulation of Pharmaceutical Research and Development
Simulation, though sometimes costly and complicated, has the obvious merit of
compelling the forecaster to face up to uncertainty and to interdependencies. By
constructing a detailed Monte Carlo simulation, you will gain a better under-
standing of how the project works and what could go wrong with it. You will have
confirmed, or improved, your forecasts of future cash flows, and your calculations
of project NPV will be more confident.
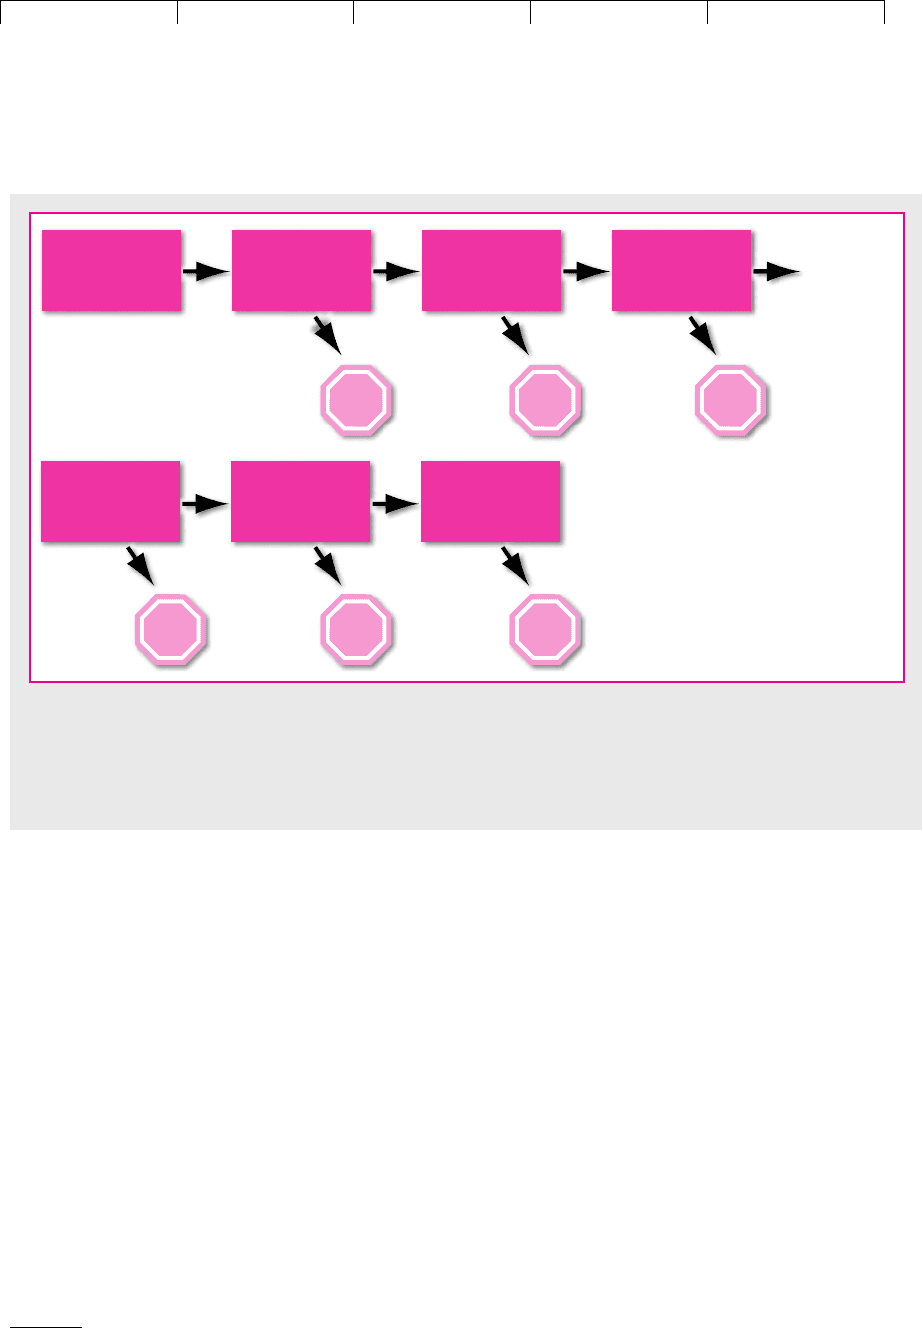
Several large pharmaceutical companies have used Monte Carlo simulation to an-
alyze investments in research and development (R&D) of new drugs. Figure 10.5
sketches the progression of a new drug from its infancy, when it is identified as a prom-
ising chemical compound, all the way through the R&D required for approval for sale
by the Food and Drug Administration (FDA). At each phase of R&D, the company
must decide whether to press on to the next phase or halt. The R&D effort lasts 10 to
12 years from preclinical testing to FDA approval and can cost $300 million or more.
12
The pharmaceutical companies face two kinds of uncertainty:
1. Will the compound work? Will it have harmful side effects? Will it ultimately
gain FDA approval? (Most drugs do not: Of 10,000 promising compounds,
CHAPTER 10
A Project Is Not a Black Box 267
Phase III clinical
trials (large-scale
testing)
FDA application
FDA approves:
Invest in marketing
and production
Basic research;
identification of
drug candidate
Preclinical
testing
Phase I clinical
trials (first tests
on humans for
safety)
Phase II clinical
trials (small-scale
tests for efficacy
and safety)
STOPSTOPSTOP
STOPSTOPSTOP
Proceed
to Phase III
FIGURE 10.5
Research and testing of a potential new drug from discovery to initial sales. This figure concentrates on the odds that
the drug will pass all required clinical tests and be approved by the Food and Drug Administration (FDA). Only a small
fraction of drug candidates identified in basic research prove safe and effective and achieve profitable production. The
“Stop” signs indicate failure and abandonment.
12
Myers and Howe estimated the average cost of bringing one new drug to market as about $300 mil-
lion after tax. The estimate was based on R&D costs and success rates from the 1970s and 1980s, but ad-
justed for inflation through 1994. See S. C. Myers and C. Howe, “A Life-Cycle Model of Pharmaceuti-
cal R&D,” MIT Program on the Pharmaceutical Industry, April 1997.