Blank B.E., Krantz S.G. Calculus: Single Variable
Подождите немного. Документ загружается.

⁄ EXAMPLE 7 Solve the equation 2
x
3
2x
5 5=4
x
for the unknown x .
Solution We
take the logarithm base 2 of both sides to obtain log
2
ð2
x
3
2x
Þ5
log
2
ð5=4
x
Þ. Applying the rules for logarithms from Theorem 2 results in
log
2
ð2
x
Þ1 log
2
ð3
2x
Þ5 log
2
ð5Þ2 log
2
ð4
x
Þ;
or
x log
2
ð2Þ1 x log
2
ð3
2
Þ5 log
2
ð5Þ2 x log
2
ð4Þ:
Gathering together all the terms involving x yields
x ðlog
2
ð2Þ1 log
2
ð9Þ1 log
2
ð4ÞÞ5 log
2
ð5Þ;
or
x log
2
ð72Þ5 log
2
ð5Þ:
Dividing by log
2
ð72Þ and using rule f of Theorem 2, we obtain
x 5
log
2
ð5Þ
log
2
ð72Þ
5 log
72
ð5Þ5 0:37633::: :
To verify this numerical calculation with a standard scientific calculator, use The-
orem 2f with x 5 5, a 5 72, and b 5 10 to express log
72
ð5Þas log
10
ð5Þ=log
10
ð72Þ: ¥
INSIGHT
Applying a logarithm, as in Example 7, is a standard technique for
moving a variable from an exponent position. The choice of base 2 in Example 7 was
arbitrary. Any other base would have led to the same result. It is a good idea to trace
through the solution of Example 7 using the application of the logarithm base a as
the first step. The value obtained for x turns out to be log
a
ð5Þ=log
a
ð72Þ, but this
expression does not depend on a since log
a
ð5Þ=log
a
ð72Þ5 log
72
ð5Þ by Theorem 2f. This is
precisely the answer we obtained with our particular choice of base 2.
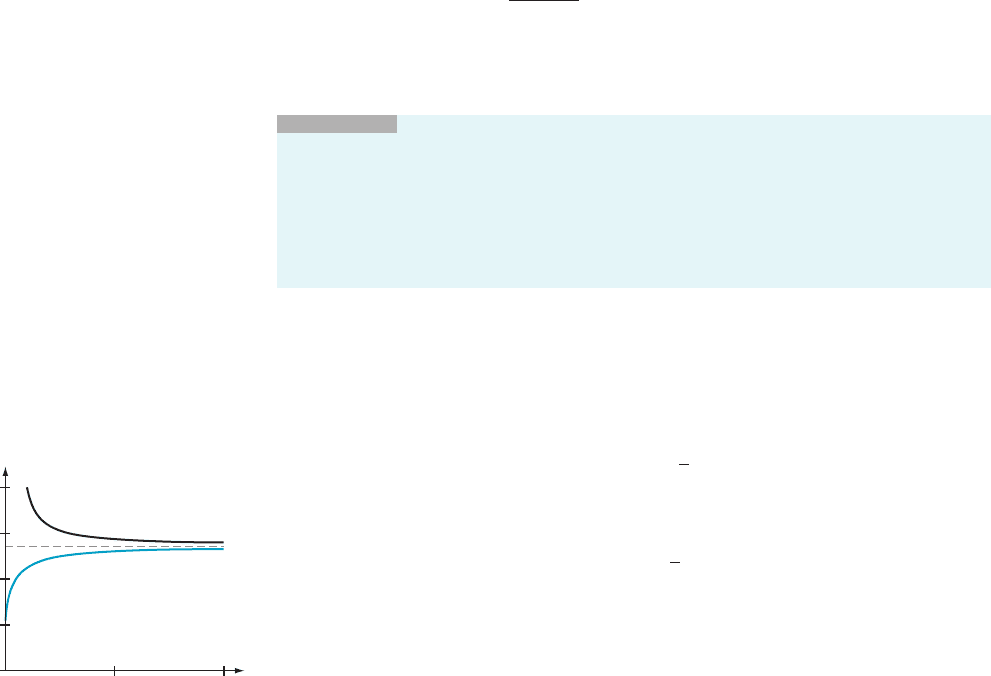
The Number e The graphs of y 5 ð111=xÞ
x
and y 5 ð121=xÞ
2x
in Figure 6 suggest that ð111=xÞ
x
is
an increasing function of x, that ð121=xÞ
2x
is a decreasing function of x, and that
there is a number e such that y 5 e is a common horiz ontal asymptote:
e 5 lim
x-N
11
1
x
x
ð2:6:9Þ
and
e 5 lim
x-N
12
1
x
2x
: ð2:6:10Þ
These inferences a re correct and can be verified by elementary (albeit technical)
arguments. Calculus will provide us with an easier method for establishing these
facts in Chapter 5.
In practice, we often us e equations (2.6.9) and (2.6.10) with a variable that
tends to infinity through integer values. Replacing x by n, a more conventional
symbol for a discrete variable, and letting n tend to infinity through integer values,
we obtain
y
e
0
10 20
1
2
3
4
y (1 1/x)
x
y (1 1/x)
x
m Figure 6
2.6 Exponential Functions and Logarithms 145
e 5 lim
n-N
11
1
n
n
ð2:6:11Þ
and
e 5 lim
n-N
12
1
n
2n
: ð2:6:12Þ
The existence of the limits in formulas (2.6.11) and (2.6.12) can also be proved
by showing that fð111=nÞ
n
g
N
n51
is a bounded, increasing sequence and that
n
ð121=nÞ
2n
o
N
n51
is a bounded, decreasing sequence. Formulas (2.6.11) and (2.6.12)
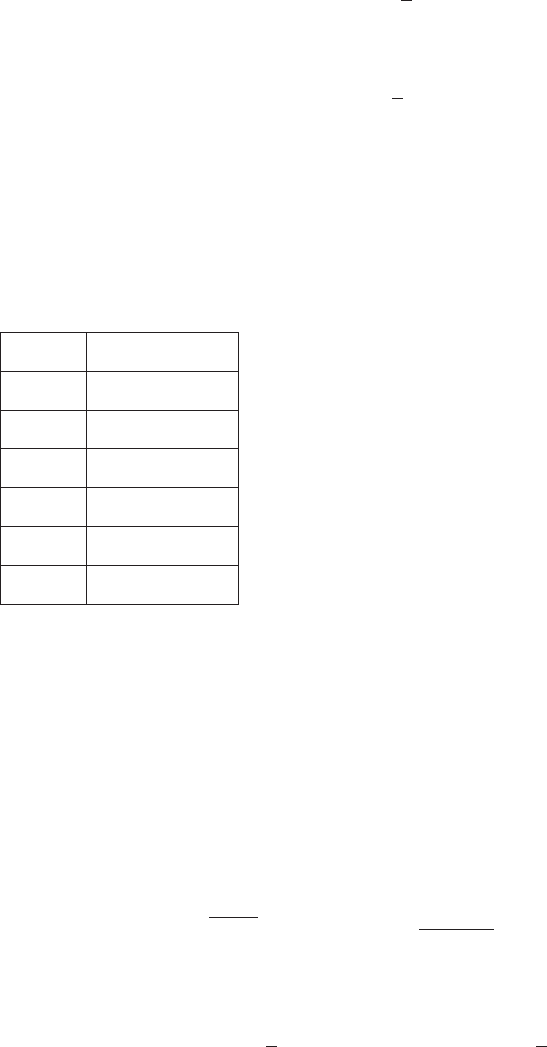
then follow from the Monotone Convergence Property. To approximate the
number e, we can calculate ð111=nÞ
n
for several values of n (see the following
table).
n (1 1 1/n)n
7 2.546499 . . .
8 2.565784 . . .
9 2.581174 . . .
10 2.593742 . . .
10
6
2.718280 . . .
10
7
2.7182816 . . .
Further calculation yields the decimal expansion
e 5 2:71828182845904523536 :::
to 20 places. (It is known that e is an irrational number.) The function x / e
x
is
called the natural exponential function or simply the exponential function. It is often
convenient to use exp to denote the exponen tial function. Thus
expðxÞ5 e
x
:
This alternative notation is particularly helpful in typesetting complicated
expressions. Compare, for example,
e
ðx
3
11Þ
2
3ðx21Þ
and exp
ðx
3
1 1Þ
2
3ðx 2 1Þ
:
⁄ EX
AMPLE 8 Show that
e
u
5 lim
x-N
11
u
x
x
and e
u
5 lim
x-N
12
u
x
2x
ð2:6:13Þ
for every number u.
146 Chapter 2 Limits

Solution We first observe that equation (2.6.13) is obvious for u 5 0. Suppose that
u . 0.
Because power functions are continuous, we have
e
u
5
ð2:6:11Þ
lim
t-N
11
1
t
t
u
5 lim
t-N
11
1
t
t
u
5
ð2:6:5Þ
lim
t-N
11
1
t
ut
:
and
e
u
5
ð2:6:12Þ
lim
t-N
12
1
t
2t
u
5 lim
t-N
12
1
t
2t
u
5
ð2:6:5Þ
lim
t-N
12
1
t
2ut
:
Set x 5 ut; and observe that 1=t 5 u=x. Additionally, notice that the variable x tends
to infinity as t does. It follows that
e
u
5 lim
t-N
11
1
t
ut
5 lim
x-N
11
u
x
x
;
and
e
u
5 lim
t-N
12
1
t
2ut
5 lim
x-N
12
u
x
2x
;
which is equation (2.6.13) for u . 0. The u , 0 case is proved in a similar way.
¥
INSIGHT
If u . 0, then x/f ðxÞ
u
is increasing if f is increasing, and x/gðxÞ
u
is
decreasing if g is decreasing. If we apply this observation to f ðxÞ5 ð1 1 1=xÞ
x
and
gðxÞ5 ð12 1=xÞ
2x
, then the solution of Example 8 shows that ð11
u
x
Þ
x
increases to e
u
when
u . 0 and ð12
u
x
Þ
2x
decreases to e
u
when u . 0: These Monotone Convergence Properties
will be important in Section 3.4 in Chapter 3 when we study the rate of change of the
exponential function.
An Application:
Compou nd Interest
If P
0
dollars are deposited in a bank account that pays r percent simple interest per
year then, after one year, the account grows to
P
0
1
r
100
P
0
5 P
0
1 1
r
100
dollars:
This represents the return of the original amount P
0
(known as the principal)
plus the interest ðr=100ÞP
0
. For an account in which the interest is compounded n
times yearly, the year is divided into n equal pieces, and, at the end of each time
interval of length 1/n, an interest pa yment of r/n percent is added to the account.
Each time this fraction of the interest is added to the account, the money in the
account is multiplied by
1 1
r= n
100
:
Because this is done n times during the year, the account grows to
Pð1Þ5 P
0
11
r
100n
n
ð2:6:14Þ
dollars at the end of one year.
2.6 Exponential Functions and Logarithms 147

For example, under semiannual (twice yearly) compounding, the account is
worth P ð1 1 r = 200Þ after six months. This becomes the principal on which interest
is paid for the second half of the year. Therefore at the end of the year, the account is
worth
P
0
1 1
r
200
1 1
r
200
5 P 11
r
200
2
:
The same reasoning shows that if r percent annual interest is compounded n times a
year, then at the end of t years, the initial principal P
0
grows to
PtðÞ5 P
0
11
r
100n
nt
:
Compounding can be performed daily, which corresponds to n 5 365 in for-
mula (2.6.14) . By setting n 5 365 3 24, we would obtain hourly compounding and so
on. Continuous compounding is the limiting result of letting n tend to infinity in
formula (2.6.14). Thus under continuous compounding, the account is worth
P 1ðÞ5 lim
n-N
P
0
11
r
100n
n
dollars at the end of one year and
PtðÞ5 lim
n-N
P
0
11
r
100n
nt
dollars after t years. These limits can be evaluated using equation (2.6.13) The next
theorem summarizes our findings.
THEOREM 3
If the interest on principal P
0
accrues at an annual rate of r
percent compounded n times per year, then the value PtðÞof the deposit after t
years is given by
PtðÞ5 P
0
11
r
100n
nt
: ð2:6:15Þ
If the interest accrues at an annual rate of r percent compounded continuously,
then the value PtðÞof the deposit after t years is given by
PðtÞ5 P
0
e
rt=100
: ð2:6:16Þ
⁄ EX
AMPLE 9 The sum of $5000 is placed in a savings account with 6%
annual interest. If simple interest is paid, then how large is the account after
4.5 years? What if the interest is compounded continuously?
Solution Use
(2.6.15) with P
0
5 5000, r 5 6, n 5 1, and t 5 4:5. We find that the size
of the account is given by
Pð4:5Þ5 5000
11
6
100
4:5
$6499:00:
When the compounding is continuous, formula (2.6.16) with P
0
5 5000, r 5 6,
and t 5 4:5 tells us that the size of the account is
Pð4:5Þ5 5000 e
6ð4:5Þ=100
$6549:82: ¥
148 Chapter 2 Limits

⁄ EXAMPLE 10 A woman wishes to set up an endowment to pay her
nephew $50,000 in cash on the day of his 21st birthday. The end owment is set up on
the day of his birth and is locked in at 9% annual interest, compounded con-
tinuously. How much principal should be put into the account to yield the desired
sum?
Solution Let P
0
be the initial principal deposited in the account on the day of the
nephew’s birth. After twenty-one years at 9% annual interest, compounded
continuously, the principal is to have grown to $50; 000:
50000 5 P
0
e
ð0:09Þ21
:
Solving for P
0
gives
P
0
5 50000 e
20:0921
5 50000 e
21:89
7553:59:
If the account were drawing only simple annual interest of 9%, then the
compounding would be done only at the end of every year. The initial principal
would be determined by the equation 50000 5 P
0
ð11:09Þ
21
. Solving this equation
for P
0
, we find that a deposit of $8184.90 would be required, which is 8.35% more
than the sum needed under continuous compounding.
¥
The Natural Logarithm The inverse of the exponential function is called the natura l logarithm and is
generally denoted by x/lnðxÞ instead of x / log
e
ðxÞ. The facts that we obtained
for logarithms with base greater than 1 hold for the natural logarithm. Thus the
domain of the natural logarithm is R
1
5 ð0; NÞ; and its image is R 5 ð2N; NÞ. For
every real s and positive t,wehave
lnðe
s
Þ5 s and e
lnðtÞ
5 t:
If x and y are positive and p is any real number, then
lnð1Þ5 0; ð2:6:17Þ
lnðeÞ5 1; ð2:6:18Þ
lnðx yÞ5 lnðxÞ1 lnðyÞ; ð2:6:19Þ
ln
x
y
5 lnðxÞ2 lnðyÞ; ð2:6:20Þ
lnðx
p
Þ5 p lnðxÞ; ð2:6:21Þ
log
a
ðxÞ5
lnðxÞ
lnðaÞ
; and ð2:6:22Þ
lnðbÞ5
1
log
b
ðeÞ
: ð2:6:23Þ
⁄ EX
AMPLE 11 Express
Q 5
4 log
3
ð5Þ2 ð1=2Þlog
3
ð25Þ
2 log
3
ð6Þ1 ð1=3Þlog
3
ð64Þ
2.6 Exponential Functions and Logarithms 149

in the form lnðuÞ=lnðνÞ.
Solution The
numerator of Q equals
log
3
ð5
4
Þ2 log
3
ð25
1=2
Þ5 log
3
ð625Þ2 log
3
ð5Þ5 log
3
ð625=5Þ5 log
3
ð125Þ:
Similarly, the denominator can be rewritten as
log
3
ð6
2
Þ1 log
3
ð64
1=3
Þ5 log
3
ð36Þ1 log
3
ð4Þ5 log
3
ð36 4Þ5 log
3
ð144Þ:
Putting these two results together and using Theorem 2 (vi) and (2.6.21), we see
that
Q 5
log
3
ð125Þ
log
3
ð144Þ
5 log
144
ð125Þ5
lnð125Þ
lnð144Þ
: ¥
Exponential Growth A quantity P(t) is said to grow exponentially if PðtÞ 5 Ae
kt
for positive constants A
and k. Notice that A 5 P(0). If we let
T 5
lnð2Þ
k
; ð2 :6:24Þ
then
Pðt 1 TÞ5 Ae
kðt1TÞ
5 Ae
kt
e
kT
5 PðtÞe
kT
5 PðtÞe
klnð2Þ=k
5 PðtÞe
lnð2Þ
5 2 PðtÞ
for every t. We call k the growth constant and T the doubling time of PðtÞ. When we
use the doubling time instead of the growth constant, it is sometimes convenient to
rewrite PðtÞ in terms of the exponential function with base 2. We do that as follows:
PðtÞ5 Ae
kt
5 A exp
lnð2Þ
T
t
5 A
e
lnð2Þ
t=T
5 A 2
t=T
: ð2:6:25Þ
⁄ EX
AMPLE 12 In a yeast nutrient broth, the population of a colony of the
bacterium Escherichia Coli (E.Coli) grows exponentially and doubles every twenty
minutes. If there are 6000 bacteria at 10:00 A.M., then how many will there be at
noon?
Solution To
answer this question, let P(t) be the number of bacteria at time t (in
hours) where 10:00 A.M. corresponds to t 5 0, and noon corresponds to t 5 2. W e
have A 5 P(0) 5 6000. We have been told that the doubling time T is tw enty
minutes. We convert this to the units with which we are working: T 5 1/3 hour.
Substituting this value of T and A 5 6000 into equation (2.6.25) results in
PðtÞ5 6000 2
3t
:
We conclude that Pð 2 Þ5 6000 2
6
5 384; 000: ¥
INSIGHT
Do not make the mistake of thinking that population problems can be
done using just arithmetic. The reasoning “if the population doubles in twenty minutes,
then it will quadruple in forty minutes” is generally wrong because populations usually
do not grow linearly.
Exponential Decay A quantity m(t) is said to decay exponentially if m(t) 5 A expð2λtÞ for positive
constants A and λ. Notice that A 5 m
0
where mð0Þ5 m
0
. If we let
τ 5
lnð2Þ
λ
; ð2:6:26Þ
150 Chapter 2 Limits

then
mðt 1 τÞ5 Ae
2λðt1τÞ
5 Ae
2λt
e
2λτ
5 mðtÞe
2λτ
5 mðtÞe
2λ lnð2Þ=λ
5 mðtÞe
2lnð2Þ
5
1
2
mðtÞ
for every t. We call λ the decay constant and τ the half-life of mðtÞ. When we use the
half-life instead of the decay constant, it is sometimes convenient to rewrite mðtÞ in
terms of the exponenti al function with base 2. We do that as follows:
mðtÞ5 A expð2λtÞ5 A exp
2
lnð2Þ
τ
t
5 A
e
2lnð2Þ
t=τ
5
A
2
t=τ
: ð2:6:27Þ
⁄ EX
AMPLE 13 Eight grams of a certain radioactive isotope decay expo-
nentially to 6 grams in 100 years. After how many more years will only 4 grams
remain?
Solution First
note that the answer is not “we lose 2 grams every hundred years so
after 100 more years, the isotope will have decayed from 6 grams to 4 grams.”
Instead, we let mðtÞ5 m
0
exp ð2λtÞ5 8expð2λtÞ denote the amount of radioactive
material at time t. Because m(100) 5 6, we have
6 5 mð100Þ5 8e
2100λ
5 8ðe
2λ
Þ
100
:
We conclude that
e
2λ
5
6
8
1=100
5
3
4
1=100
:
Thus the formula for the amount of isotope present at time t is
mðtÞ5 8e
2λt
5 8 e
2λ
t
5 8
3
4
t=100
:
Now we have complete information about the function m, and we can answer the
original question. There will be 4 grams of material present when
4 5 mðtÞ5 8
3
4
t=100
or
1
2
5
3
4
t=100
:
We solve for t by taking the natural logarithm of both sides:
lnð1=2Þ5 ln
3
4
t=100
5
t
100
lnð3=4Þ;
or
t 5 100
lnð1=2Þ
lnð3=4Þ
240 :942:
Thus at t 5 240.942, which is to say after 140.942 more years, there will be 4 grams
of the isotope remaining.
¥
QUICK QUIZ
1. True or false: Every monotone sequence converges.
2. True or false: Every bounded sequence converges.
3. Evaluate lim
n-N
ð111=nÞ
n
.
4. Solve 2expðxÞ5 3
x
.
Answers
1. False 2. False 3. e 4.
ln 2ðÞ= ln 3ðÞ2 1ðÞ
2.6 Exponential Functions and Logarithms 151

EXERCISES
Problems for Practice
c In Exercises 128, simplify the given expression. b
1.
ffiffi
ffi
2
p
ffiffi
3
p
ffiffiffi
2
p
ffiffi
3
p
2. 4
π
4
e
3. ð1=8Þ
2π=3
4. ð8
ffiffi
3
p
4
ffiffi
7
p
Þ=2
π
5. ð
ffiffiffiffiffi
11
p
ffiffi
2
p
Þ
ffiffi
2
p
6. ð
ffiffiffi
e
p
ffiffi
2
p
Þ
2
7. ð3
4
9
3
=27
2
Þ
1=2
8.
ð5
3=4
Þ
3
=
ffiffiffiffiffiffiffi
ffiffiffi
5
p
p
1=2
c In Exercises 9222, rewrite the given expression without
using any exponentials or logarithms. b
9. log
5
ð1=125Þ
10. log
7
ð
ffiffiffi
7
p
Þ
11. e
lnð3Þ
12. exp 23lnð2ÞðÞ
13. log
27
ð9=3
x
Þ
14. log
8
ð64 4
2x
2
26
Þ
15. log
2
log
2
ð4ÞðÞ
16. log
1=4
ð8
2x
2
24x
Þ
17. log
4=9
ð4
x=2
3
4x
2
25x
Þ
18. log
4
ð16
x
Þ2 log
3
ð27Þ1 4
log
4
ð5Þ
19. 2
log
8
ð27x
3
Þ
20. e
log
2
ð7Þ
lnð2Þ
21. exp
ffiffiffiffiffiffiffiffiffiffiffiffiffiffiffiffiffiffiffiffi
lnð3
lnð81Þ
Þ
q
22. ðe
3
Þ
lnð4Þ
2 3
lnð59Þ
log
3
ðeÞ
c In Exercises 23226, solve for x. b
23. 1=2
x
5 8 2
x
24. 5
x
5 125
ð122xÞ
25. 4
x
3
2x
5 8 6
2x
26. 3
2x
4
2x
5 4=9
c In Exercises 27232, sketch the graph of the given equa-
tion.
Label salient points. b
27. y 5 3
x
1 1
28. y 5 2
2x
29. y 5 3 2 e
x
30. y 5 expð1 2 xÞ
31. y 5 3 1 log
2
ð2xÞ
32. y 5 lnðx 1 eÞ
c In Exercises 33242, find the limit. b
33. lim
n-N
ð1 1 1=nÞ
n
34. lim
n-N
ð1 1 2=nÞ
n
35. lim
n-N
ð1 1 e=nÞ
n
36. lim
n-N
1 1 1= 2nðÞðÞ
n
37. lim
n-N
1 1 3= 4nðÞðÞ
n
38. lim
n-N
1 2 1=nðÞ
n
39. lim
n-N
1 2 π=nðÞ
n
40. lim
n-N
1 2 1= 2nðÞðÞ
n
41. lim
n-N
1 2 π= 4nðÞðÞ
n
42. lim
n-N
1 2 ln 3ðÞ=nðÞ
n
c In Exercises 43252, find the limit. b
43. lim
x-e
2
lnðx
3
Þ
44. lim
x-e
2
ðπÞ
1=ðx2eÞ
45. lim
x-e
1
ðe=πÞ
1=ðx2eÞ
46. lim
x-0
3
sinðxÞ=x
47. lim
x-1
5
log
3
ðxÞ
48. lim
x-N
ð12 1 7e
23x
Þ
49. lim
x-2N
ð1 1 3=xÞ
x
50. lim
x-2N
121=ðπxÞðÞ
x
51. lim
x-N
e
2x
2 e
22x
e
2x
1 e
22x
52. lim
x-N
10 3
2x
2 2
x
2 9
x
1 5
2x
c In Exercises 53256, find all asymptotes of the graph of the
given equation. b
53. y 5 ðe
7x
1 e
27x
Þ=ðe
7x
2 e
27x
Þ
54. y 5 e
2x
2
55. y 5 32=ð8 2 2
x
Þ
56. y 5 ð3
x
1 2
x
Þ=ð3
x
2 3Þ
c In each of Exercises 57260, an initial investment P
0
,an
annual interest rate, and a number m are given. Determine
the value of the investment after m months under the fol-
lowing conditions: b
a. Simple
interest
b. Semiannual compounding
c. Quarterly compounding
d. Daily compounding
e. Continuous compounding b
57. P
0
5 1000; 6%; m 5 12
58. P
0
5 1000; 7%; m 5 60
59. P
0
5 5000; 5:25%; m 5 36
60. P
0
5 10000; 7:5%; m 5 24
c In each of Exercises 61264, you are given certain infor-
mation
about a population of bacteria. Assuming exponential
growth, find the number of bacteria at 8:00 P.M. b
61. 5000
bacteria at noon;
8000 bacteria at 3:00 P.M.
152 Chapter 2 Limits

62. 4000 bacteria at 5:00 P.M.;
population doubles every two hours
63. 6500 bacteria at 7:00 P.M.;
8000 bacteria at 9:00 P.M.
64. 7000 bacteria at 4:00 P.M.;
population triples every 8 hours
c In each of Exercises 65268 you are given a certain
amount
(in grams) of a radioactive isotope, and some
information a bout its rate of decay. Assuming exponential
decay, determine how much of the s ubstance is present in
the year 2010. b
65. 5
grams in 1955;
4 grams in 1996
66. 8 grams in 1994;
half-life is 30 years
67. 12 grams in 2028;
10 grams in 2040
68. 15 grams in 2000;
10 grams in 2100
c In each of Exercises 69272, determine the half-life from
the
given information about the rate of decay of a radioactive
substance. b
69. 12
grams in 1960;
8 grams in 2000
70. 10 grams in 1960;
7 grams in 2010
71. 14 grams in 1880;
10 grams in 1980
72. 20 grams in 1900;
15 grams in 1950
Further Theory and Practice
c In Exercises 73276, sketch the graph of the given
equation. b
73. y 5 je
x
2 1j
74. y 5 e
jxj
75. y 5 lnðjx 2 2jÞ
76. y 5 jlnðje 2 xjÞj
c In Exercises 77280, evaluate the given limit. b
77. lim
n-N
n11
n
n
78. lim
n-N
n
n11
n
79. lim
n-N
11
3
n
2n
80. lim
n-N
11
1
n
2
n
2
81. Suppose that a
n
-1as n-N: Because any power of 1 is
also 1, it might seem as if a
n
n
-1: To the contrary, for any
v . 0, it is possible to find a sequence fa
n
g such that
a
n
-1; but a
n
n
- v: Use formula (2.6.11) to demonstrate
this fact.
c If an amount A is
to be received at time T in the future,
then the present value of that payment is the amount P
0
that,
if deposited immediately with the current interest rate locked
in, will grow to A by time T under continuous compounding.
The present value of an income stream is the sum of the
present values of each future payment. In each of Exercise
82285, calculate the present value of the specified income
stream. b
82. Mr.
Woodman wants to give $100,000 to his son Chip
when Chip turns 25 years old. Given that current interest
rates are 5%, and Chip has just turned 18, what is the
present value of the gift?
83. Mrs. Woodman wants to present a $144,000 college fund
to her newborn daughter Sylvia when Sylvia turns 18
years old. Given that current interest rates are 6:5%, what
is the present value of the gift?
84. A winning lottery ticket pays $300,000 immediately and
four more payments of the same amount at yearly
intervals. If the current interest rate is 4.5%, what is the
present value of the winnings?
85. Mr. Woodman pledges three equal payments of $1000 at
yearly intervals to a forrest conservation organization. If
the first installment is to be paid in two years, and if the
current interest rate is 4%, what is the present value of
the donation?
86. Every exponential function can be expressed by means of
the natural exponential function. To be specific, for any
fixed a . 0, there is a constant k such that a
x
5 e
kx
for
every x. Express k in terms of a.
87. Investment advisors refer to the following rule of thumb: If
an investment is left to compound continuously at a constant
annual rate of r%, then the time required for the investment
to double in value is 72/r years. What is the exact rule that this
“rule of 72” approximates? What integer gives a better
approximation than 72? (The number 72 is used because 72
is divisible by r for r 5 3, 4, 6, 8, 9, and 12.)
88. If at time t 5 0, an object is placed in an environment that
is maintained at a constant temperature T
N
, then
according to Newton’s Law of Heating and Cooling, the
temperature T(t) of the object at time t is
TðtÞ5 T
N
1 ðTð0Þ2 T
N
Þe
2kt
for some constant k . 0. What is the limiting temperature
of the object as t-N? What asymptote does the graph of
T have? Sketch the graph of T assuming that Tð0Þ. T
N
.
Sketch the graph of T assuming that Tð0Þ, T
N
.
2.6 Exponential Functions and Logarithms 153

89. Suppose M and P
0
are constants such that M . P
0
. 0. The
size of a population P is given as a function of time t by
PðtÞ5
P
0
M
P
0
1 ðM 2 P
0
Þe
2kt
for some positive constant k. This equation for PðtÞ is
known as the logistic growth formula.Inapopulation
model, time is generally restricted to an interval with a left
endpoint, but assume that 2N , t , N here. By calcu-
lating lim
t-N
PðtÞ and lim
t-2N
PðtÞ, determine the hor-
izontal asymptotes of the graph of P.
90. If the air resistance to a falling object is proportional to
the speed of that object with positive proportionality
constant k, then the speed of that object when dropped
from a height is
vðtÞ5 kgð1 2 e
2t=k
Þ:
What is the limit of vðtÞ as t-N? (This limiting value is
known as the terminal velocity of the falling object.) Sketch
the graph of v. What horizontal asymptote does it have?
91. When a drug is intravenously introduced into a patient’s
bloodstream at a constant rate, the concentration C of the
drug in the patient’s body is typically given by
CðtÞ5
α
β
ð1 2 e
2βt
Þ
where α and β are positive constants. What is the limiting
concentration lim
t-N
CðtÞ? Sketch the graph of C. What
horizontal asymptote does it have?
92. The diffusion of a solute through a cell membrane is
described by Fick’s Law:
cðtÞ5 ðcð0Þ2 CÞexpð2 ktÞ1 C;
where cðtÞ is the concentration of the solute in the cell, C
is the concentration of the solute outside the cell, and k is
a positive constant. What is the limit of the concentration
of the solute in the cell? Sketch the graph of c when
cð0Þ. C and when cð0Þ, C. What horizontal asymptote
does each graph have?
93. Suppose that α . 1. Let x
0
5 1. For n . 1, let x
n
5
ðα 1 x
n21
Þ=2. Show that fx
n
g is a bounded increasing
sequence. To what number does fx
n
g converge?
94. Let s
n
5 1 1 1=2! 1 1=3! 1 1 1=n! for every integer n.
It is evident that fs
n
g is an increasing sequence. To prove
that it is also bounded, show that k! $ 2
k21
for every
positive integer k. It then follows that
s
n
, 1 1 1=2 1 1=4 1 1=8 1 :
Use this inequality and formula (2.5.3) to obtain an upper
bound U for fs
n
g. The Monotone Convergence Property
tells us that fs
n
g converges to a number not greater than
U. In Chapter 10, we will see that the limit is e 2 1.
c Radiocarbon Dating Tw
o isotopes of carbon,
12
C, which is
stable, and
14
C, which decays exponentially with a 5700-year
half-life, are found in a known fixed ratio in living matter. After
death, carbon is no longer metabolized, and the amount m(t)of
14
C decreases due to radioactive decay. In the analysis of a
sample performed T years after death, the mass of
12
C,
unchanged since death, can be used to determine the mass m
0
of
14
C that the sample had at the moment of death. The time T
since death can then be calculated from the law of exponential
decay and the measurement of m(T). Use this information for
solving Exercises 95298. b
95. Until
relatively recently, mammoths were thought to
have become extinct 10,000 years ago. In 1991, fossils of
dwarfed woolly mammoths found on Wrangel Island,
which is located in the Arctic Ocean off the coast of
Siberia, were analyzed. From this radiocarbon dating, it
was determined that mammoths survived on Wrangel
Island until at least 1700 BCE. What percentage of m
0
was the measured amount of
14
C in these fossils?
96. In 1994, a parka-clad mummified body of a girl was found in
a subterranean meat cellar near Barrow, Alaska. Radio-
carbon analysis showed that the girl died around
CE 1200.
What percentage of m
0
was the amount of
14
Cinthe
mummy?
97. Prehistoric cave art has recently been found in a number of
new locations. At Chauvet, France, the amount of
14
Cin
some charcoal samples was determined to be 0:0879 m
0
.
About how old are the cave drawings?
98. The skeletal remains of a human ancestor, Lucy, are
reported to be 3,180,000 years old. Explain why the
radiocarbon dating of matter of this age would be futile.
Calculator/Computer Exercises
99. Plot y 5 expðxÞ for 0 # x # 2. Let PðcÞ denote the point
c; expðcÞðÞon the graph. The purpose of this exercise is
to graphically explore the relationship between expðcÞ
and the slope of the tangent line at PðcÞ . For c 5 1=2, 1,
and 3/2, calculate the slope mðcÞ of the secant line that
passes through the pair of points Pðc 2 0:001Þ and
Pðc 1 0:001Þ. For each c, calculate jexpðcÞ2 mðcÞj to see
that mðcÞ is a good approximation of expðcÞ. Add the
three secant lines to your viewing window. For each of
c 5 1=2, 1, and 3/2, add to the viewing window the line
through PðcÞ with slope expðcÞ.
As we will see in
Chapter 3, these are the tangent lines at Pð1=2Þ, Pð1Þ,
and Pð3=2Þ. It is likely that they cannot be distinguished
from the secant lines in your plot.
100. Plot y 5 lnðxÞ for 1=2 # x # 3. Let PðcÞ denote the
point c; lnðcÞðÞon the graph. The purpose of this exer-
cise is to graphically explore the relationship between 1/
c and the slope of the tangent line at PðcÞ . For c 5 1, 3/2,
and 2, calculate the slope mðcÞ of the secant line that
154 Chapter 2 Limits