Bhushan B. Nanotribology and Nanomechanics: An Introduction
Подождите немного. Документ загружается.

626 Adrian B. Mann
a priori, (12.1) can be used to calculate the contact area, A, and, hence, you have
avalueforA
c
at a depth δ
c
. Repeating this procedure for a range of depths will give
a numerical version of the function A
c
(δ
c
). Then, it is simply a case of fitting (12.15)
to the numerical data. If the hardness, H, is known and not a function of depth, and
the calibration specimen was fully plastic during testing, then essentially the same
approach could be used but based on (12.12). Situations where a constant H is used
to calibrate the tip are extremely rare.
In addition to the tip shape function, the machine compliance must be calibrated.
Basic Newtonian mechanics tells us that for the tip to be pushed into a surface the
tip must be pushing off of another body. During nanoindentation testing the other
body is the machine frame. As a result, during a nanoindentation test it is not just
the sample, but the machine frame that is being loaded. Consequently, a very small
elastic deformation of the machine frame contributes to the total stiffness obtained
from the unloading curve. The machine frame is usually very stiff, > 10
6
N/m, so
the effect is only important at relatively large loads.
To calibrate the machine frame stiffness or compliance, large nanoindentations
are made in a soft material such as aluminum with a known, isotropic elastic modu-
lus. For very deep nanoindentations made with a Berkovich pyramid, the contact
area, A
c
(δ
c
), can be reasonably approximated to 24.5δ
2
c
, thus (12.1) can be used to
find the expected contact stiffness for the material. Any difference between the ex-
pected value of S and the value measured from the unloading curve will be due to
the compliance of the machine frame. Performing a number of deep nanoindenta-
tions enables an accurate value for the machine frame compliance to be obtained.
Currently, because of its ready availability and predictable mechanical proper-
ties, the most popular calibration material is fused silica (E = 72GPa, ν = 0.17),
though aluminum is still used occasionally.
12.3.6 Modifications to the Analysis
Since the development of the analysis routines in the early 1990s, it has become
apparent that the standard analysis of nanoindentation data is not applicable in all
situations, usually because errors occur in the calculated contact depth or contact
area. Pharr et al. [61–64] have used finite element modeling (FEM) to help under-
stand and overcome the limitations of the standard analysis. Two important sources
of errors have been identified in this way. The first is residual stress at the sample
surface. The second is the change in the shape of nanoindents after elastic recovery.
The effect of residual stresses at a surface on the indentationpropertieshas been
the subjectof debatefor manyyears [65–67]. The perceivedeffect wasthat compres-
sive stresses increased hardness, while tensile stresses decreased hardness. Using
FEM it is possible to model a pointed nanoindenter being pushed into a model ma-
terial that is in residual tension or compression. An FEM model of nanoindentation
into aluminumalloy 8009 [61] has confirmed earlier experimentalobservations [68]
indicating that the contact area calculated from the unloading curve is incorrect if
there are residual stresses. In the FEM model of an aluminum alloy the mechanical
behavior of the material is modeled using a stress-strain curve, whichresembles that
12 Nanomechanical Properties of Solid Surfaces and Thin Films 627
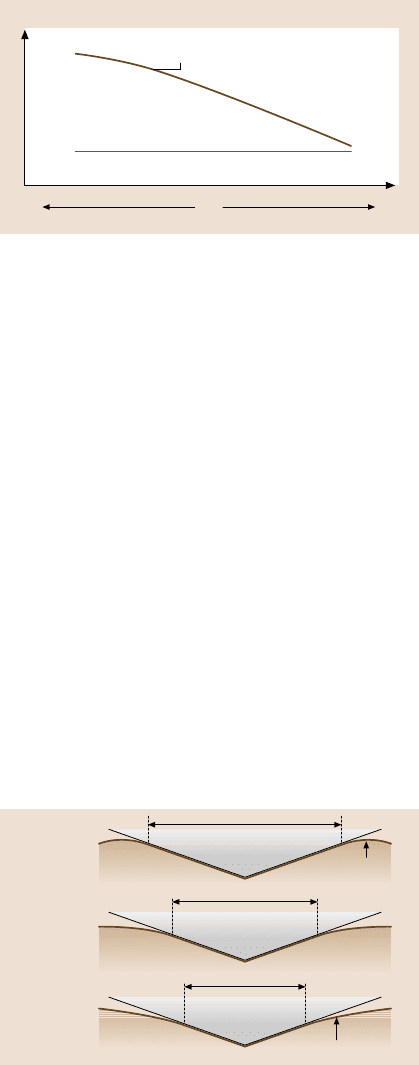
Contact area A
Real contact area
O & P calculated contact area
Compression
Applied stress
Tension0
Fig. 12.16. When a surface is in a state of stress there is a significant difference between the
contact area calculated using the Oliver and Pharr method and the actual contact area [61].
For an aluminum alloy this can lead to significant errors in the calculated hardness and elastic
modulus
of an elastic-perfectly-plastic metal with a flow stress of 425.6MPa. Yielding starts
at 353.1MPa and includes a small amount of work hardening. The FEM model was
used tofind the contact areadirectly andusing the simulated unloadingcurvein con-
junction with Oliver and Pharr’s method. The results as a function of residual stress
are illustrated in Fig. 12.16. Note that the differences between the two measured
contact areas lead to miscalculations of E and H.
Errors in the calculated contact area stem from incorrect assumptions about the
pile-up and sink-in at the edge of the contact, as illustrated by Fig. 12.17.The Oliver
and Pharr analysis assumes the geometry of the sample surface is the same as that
given by Sneddon[47] in his analytical model for the indentation of elastic surfaces.
Clearly, for materials where there is significant plastic deformation, it is possible
that there will be large deviations from the surface geometry found using Sneddon’s
elastic model. In reality, the error in the contact area depends on how much the
geometry of the test sample surface differs from that of the calibration material
(typically fused silica). It is possible that a test sample, even without a residual
stress, will have a different surface geometry and, hence, contact area at a given
depth, when compared to the calibration material. This is often seen for thin films
Residual
compression
Sneddon’s
surface
profile
Residual
tension
Pile-up
Sink-in
Fig. 12.17. Pile-up and sink-
in are affected by residual
stresses, and, hence, errors
are introduced into standard
Oliver and Pharr analysis

628 Adrian B. Mann
on a substrate (e.g., Tsui et al. [69, 70]). Residual stresses increase the likelihood
that the contact area calculated using Oliver and Pharr’s method will be incorrect.
The issue of sink-in and pile-up is always a factor in nanoindentation testing.
However, there is still no effective way to deal with these phenomena other than
reverting to imaging of the indentations to identify the true contact area. Even this is
difficult, as the edge of an indentation is not easy to identify using AFM or electron
microscopy. One approach that has been used [71] with some success is measuring
the ratio E
2
r
/H, ratherthan E
r
and H separately. Because E
r
is proportionalto 1/
√
A
and H is proportional to 1/A, E
2
r
/H should be independent of A and, hence, unaf-
fected by pile-up or sink-in. While this does not provide quantitative values for me-
chanical properties, it does provide a way to identify any variations in mechanical
properties with indentation depth or between similar samples with different residual
stresses.
Another source of error in the Oliver and Pharr analysis is due to incorrect as-
sumptions about the nanoindentation geometry after unloading [63]. Once again,
this is due to differences between the test sample and the calibration material. The
exact shape of an unloaded nanoindentationon a material exhibiting elastic recovery
is not simply an impression of the tip shape; rather, there is some elastic recovery of
the nanoindentation sides giving them a slightly convex shape (see Fig. 12.18). The
shape actually dependson Poisson’s ratio, so the standard Oliver and Pharr analysis
will only be valid for a material where ν = 0.17, the value for fused silica, assuming
it is used for the calibration.
To deal with the variations in the recovered nanoindentation shape, it has been
suggested [63] that a modified nanoindenter geometry with a slightly concave side
be used in the analysis (see Fig. 12.18). This requires a modification to (12.1):
S = γ2E
r
A
π
, (12.18)
where γ isa correctionterm dependenton thetip geometry.For aBerkovichpyramid
the best value is:
γ =
π
4
+ 0.15483073cotΦ
(1−2ν
s
)
4(1−ν
s
)
π
2
−0.83119312cotΦ
(1−2ν
s
)
4(1−ν
s
)
2
, (12.19)
a)
b)
Actual shape
Elastic recovery
of sides of indent
Expected shape
Modified
indenter
shape
Fig. 12.18. (a) Hay et al. [63]
found from experiments and
FEM simulations that the
actual shape of an indentation
after unloading is not as ex-
pected. (b) They introduced
a γ term to correct for this
effect. This assumes the in-
denter has slightly concave
sides
12 Nanomechanical Properties of Solid Surfaces and Thin Films 629
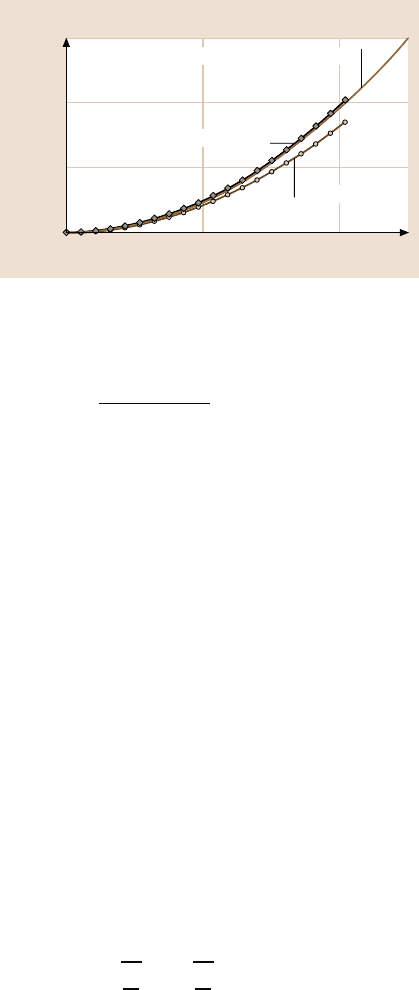
Contact area (mm
2
)
3 u 10
7
2 u 10
7
1 u 10
7
0
Ideal Berkovich pyramid
O & P calculated area
Displacement (nm)
1,000500
γ corrected area
Fig. 12.19. For a real
Berkovich tip the γ corrected
area [63] is less at a given
depth than the area calculated
using the Oliver and Pharr
method
where Φ = 70.32
◦
. For a cube corner the correction can be even largerand γ is given
by:
γ = 1+
(1−2ν
s
)
4(1−ν
s
)tanΦ
, (12.20)
where Φ = 42.28
◦
. Figure 12.19 shows how the modified contact area varies with
depth for a real diamond Berkovich pyramid.
The validity of the γ-modified geometry is questionable from the perspective of
contact mechanics since it relies on assuming an incorrect geometry for the nanoin-
denter tip to correct for an error in the geometry of the nanoindentation impression.
The values for E and H obtained using the γ-modification are, however, good and
can be significantly different to the values obtained with the standard Oliver and
Pharr analysis.
12.3.7 Alternative Methods of Analysis
All of the preceding discussion on the analysis of nanoindentation curves has fo-
cused on the unloading curve, virtually ignoring the loading curve data. This is for
the simple reason that the unloading curve can in many cases be regarded as purely
elastic, whereas the shape of the loading curve is determined by a complex mix of
elastic and plastic properties.
It is clear that there is substantially more data in the loading curve if it can be
extracted. Page et al. [57, 72] have explored the possibility of curve fitting to the
loading data using a combination of elastic and plastic properties. By a combina-
tion of analysis and empirical fitting to experimental data, it was suggested that the
loading curve is of the following form:
P = E
⎛
⎜
⎜
⎜
⎜
⎜
⎝
ψ
H
E
+ φ
E
H
⎞
⎟
⎟
⎟
⎟
⎟
⎠
−2
δ
2
, (12.21)
where ψ and φ are determined experimentally to be 0.930 and 0.194, respectively.
For homogenoussamples this equation givesa linear relationshipbetween P and δ
2
.
630 Adrian B. Mann
Coatings, thin film systems, and samples that strain-harden can give significant de-
viations from linearity. Analysis of the loading curve has yet to gain popularity as
a standard method for examining nanoindentation data, but it should certainly be
regarded as a prime area for further investigation.
Another alternative method of analysis is based on the work involved in mak-
ing an indentation. In essence, the nanoindentation curve is a plot of force against
distance indicating integration under the loading curve will give the total work of
indentation, or the sum of the elastic strain energy and the plastic work of indenta-
tion.Integratingunder the unloadingcurveshouldgiveonlythe elastic strain energy.
Thus, the work involved in both elastic and plastic deformation during nanoinden-
tation can be found. Cheng and Cheng [73] combined measurements of the work of
indentation with a dimensional analysis that deals with the effects of scaling in a ma-
terial that work-hardens to estimate H/E
r
. They subsequently evaluated H and E
using the Oliver and Pharr approach to find the contact area.
12.3.8 Measuring Contact Stiffness
As discussed earlier, it is possible to add a small AC load on top of the DC load used
during nanoindentation testing, providing a way to measure the contact stiffness
throughoutthe entire loading and unloading cycle [74,75].The AC load is typically
at a frequency of ≈ 60Hz and creates a dynamic system, with the sample acting
as a spring with stiffness S (the contact stiffness), and the nanoindentation system
acting as a series of springs and dampers. Figure 12.20 illustrates how the small
AC load is added to the DC load. Figure 12.21 shows how the resulting dynamic
system can be modeled. An analysis of the dynamic system gives the following
relationships for S based on the amplitude of the AC displacement oscillation and
the phase difference between the AC load and displacement signals:
"
"
"
"
"
P
os
δ(ω)
"
"
"
"
"
=
,
S
−1
+C
f
-
−1
+ K
s
−mω
2
2
+ω
2
D
2
, (12.22)
tan(χ) =
ωD
,
S
−1
+ C
f
-
−1
+ K
s
−mω
2
, (12.23)
where C
f
is the load frame compliance (the reciprocal of the load frame stiffness),
K
s
is the stiffness of the support springs (typically in the region of 50–100N/m),
Load P
Displacement δ
Small, sinusoidal
AC load
Fig. 12.20. A small AC load can be added to the
DC load. This enables the contact stiffness, S ,to
be calculated throughout the indentation cycle
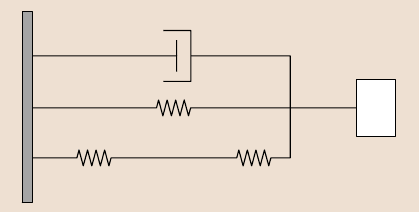
12 Nanomechanical Properties of Solid Surfaces and Thin Films 631
K
s
I/C
f
S
D
m
Fig. 12.21. The dynamic
model used in the analysis of
the AC response of a nanoin-
dentation device
D is the damping coefficient, P
os
is the magnitude of the load oscillation, δ(ω)isthe
magnitude of the displacement oscillation, ω is the oscillation frequency, m is the
mass of the indenter, and χ is the phase angle between the force and the displace-
ment.
In order to find S using either (12.22) or (12.23), it is necessary to calibrate
the dynamic response of the system when the tip is not in contact with a sample
(S
−1
= 0). This calibration combined with the standard DC calibrations will provide
the values for all of the constants in the two equations.All that needs to be measured
in order to obtain S is either δ(ω)orχ, both of which are measured by the lock-in
amplifierused to generate the AC signal. Sincethe S obtainedis the sameas the S in
(12.1),it followsthat the Oliverand Pharr analysis can be appliedto obtain E
r
and H
throughout the entire nanoindentation cycle.
The dynamic analysis detailed here was developedfor the MTS Nanoindenter™
(Oakridge, Tennessee), but a similar analysis has been applied to other commer-
cial instruments such as the Hysitron Triboscope™ (Minneapolis, Minnesota) [76].
For all instruments, an AC oscillation is used in addition to the DC voltage, and
a dynamic model is used to analyze the response.
12.3.9 Measuring Viscoelasticity
Using an AC oscillation in addition to the DC load introduces the possibility of
measuring viscoelastic properties during nanoindentation testing. This has recently
been the subject of considerable interest with researchers looking at the loss modu-
lus, storage modulus, and loss tangent of various polymeric materials [25, 77].
Recording the displacement response to the AC force oscillation enables the com-
plex modulus (including the loss and storage modulus) to be found. If the modulus
is complex, it is clear from (12.1) that the stiffness also becomes complex. In fact,
the stiffness will have two components: S
, the component in phase with the AC
force and S
, the component out of phase with the AC force.
The dynamic model illustrated in Fig. 12.21 is no longer appropriate for this
situation, as the contact on the test sample also includes a damping term, shown
in Fig. 12.22. Equations (12.22) and (12.23) must also be revised. Neglecting the
load frame compliance, C
f
, which in most real situations is negligible, (12.22) and

632 Adrian B. Mann
K
s
S
D
m
D
s
Fig. 12.22. The simplified
dynamic model used when
the sample is viscoelastic. It
is assumed that the load frame
compliance is negligible
(12.23) when the sample damping, D
s
, is included become:
"
"
"
"
"
P
os
δ
(
ω
)
"
"
"
"
"
=
!
/
S +K
s
−mω
2
0
2
+ω
2
(
D+D
s
)
2
, (12.24)
tan
(
χ
)
=
ω
(
D+ D
s
)
S + K
s
−mω
2
. (12.25)
In order to find the loss modulus and storage modulus, (12.1) is used to relate S
(storage component) and S
(loss component) to the complex modulus.
This method for measuring viscoelastic properties using nanoindentation has
now been proven in principal, but has still only been applied to a very small range
of polymers and remains an area of future growth.
12.4 Modes of Deformation
As described earlier, the analysis of nanoindentation data is based firmly on the
results of elastic continuum mechanics. In reality, this idealized, purely elastic situ-
ation rarely occurs. For very shallow contacts on metals with thin surface films such
as oxides, carbon layers, or organic layers [78,79], the contact can initially be very
similar to that modeled by Hertz and, later, Sneddon. It is very important to realize
that this in itself does not constitute proof that the contact is purely elastic, because
in many cases a small number of defects are present. These may be preexisting
defects that move in the strain-field generated beneath the contact. Alternatively,
defects can be generated either when the contact is first made or during the initial
loading [52, 80]. When defects such as short lengths of dislocation are present the
curves may still appear to be elastic even though inelastic processes like dislocation
glide and cross-slip are taking place.
12.4.1 Defect Nucleation
Nucleation of defects during nanoindentation testing has been the subject of many
experimental [81, 82] and theoretical studies [83, 84]. This is probably because
nanoindentation is seen as a way to deform a small, defect-free volume of material
12 Nanomechanical Properties of Solid Surfaces and Thin Films 633
to its elastic limit and beyond in a highly controlled geometry. There are, unfor-
tunately, problems in comparing experimental results with theoretical predictions,
largely because the kinetic processes involved in defect nucleation are difficult to
model. Simulationsconducted at 0 K do not permit kinetic processes, and molecular
dynamics simulations are too fast (nanoseconds or picoseconds). Real nanoindenta-
tion experiments take place at ≈ 293K and last for seconds or even minutes.
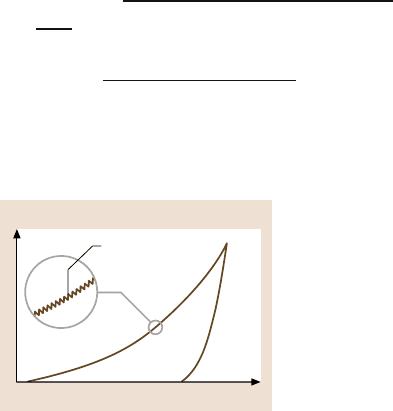
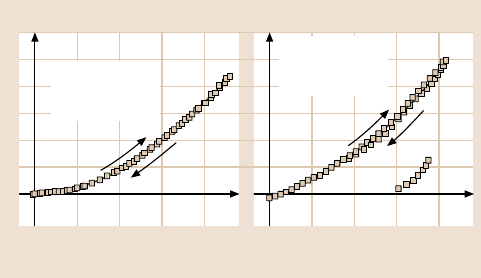
Kinetic effects appear in many forms, for instance, during the initial contact
between the indenter tip and the surface when defects can be generated by the com-
bined action of the impact velocity and surface forces [51]. A second example of
a kinetic effect occurs during hold cycles at large loads when what appears to be
an elastic contact can suddenly exhibit a large discontinuity in the displacement
data [80]. Figure 12.23 shows how these kinetic effects can affect the nanoindenta-
tion data and the apparent yield point load.
During the initial formation of a contact, the deformation of surface asperi-
ties [51] and ledges [85] can create either point defects or short lengths of dislo-
cation line. During the subsequent loading, the defects can help in the nucleation
and multiplication of dislocations. The large strains present in the region surround-
ing the contact, coupled with the existence of defects generated on contact, can
result in the extremely rapid multiplication of dislocations and, hence, pronounced
discontinuities in the load-displacement curve. It is important to realize that the dis-
continuities are due to the rapid multiplication of dislocations, which may or may
not occur at the same time that the first dislocation is nucleated. Dislocations may
have been present for some time with the discontinuity only occurring when the
existing defects are configured appropriately, as a Frank–Read source, for instance.
Even under large strains, the time taken for a dislocation source to form from preex-
isting defects may be long. It is, therefore, not surprising that large discontinuities
can be seen during hold cycles or unloading.
The generation of defects at the surface and the initiation of yielding is a com-
plex process that is extremely dependent on surface asperities and surface forces.
Load (mN)
3
2
1
0
Depth (nm)
100 203040
W (100)
Impact velocity
4 nm/s
Loading
Unloading
Load (mN)
Depth (nm)
100 203040
W (100)
Impact velocity
20 nm/s
Loading
Unloading
Fig. 12.23. Load-displacement curves for W(100) showing how changes in the impact veloc-
ity can cause a transition from perfectly elastic behavior to yielding during unloading
634 Adrian B. Mann
These, in turn, are closely related to the surface chemistry. It is not only the mag-
nitude of surface forces, but also their range in comparison to the height of surface
asperities that determines whether defects are generated on contact. Small changes
in the surface chemistry or the velocity of the indenter tip when it first contacts the
surface, can cause a transition from a situation in which defects are generated on
contact to one where the contact is purely elastic [52].
When the generation of defects during the initial contact is avoided and the
deformed region under the contact is truly defect free, then the yielding of the sam-
ple should occur at the yield stress of a perfect crystal lattice. The load at which
plastic deformation commences under these circumstances becomes very repro-
ducible [86]. Unfortunately, nanoindenter tips on the near-atomic scale are not per-
fectly smooth or axisymmetric. As a result, accurately measuring the yield stress is
very difficult. In fact, a slight rotation in the plane of the surface of either the sample
or the tip can give a substantial change in the observed yield point load. Coating the
surface in a cushioning self-assembled monolayer [87] can alleviate some of these
variations,but italso introducesa largeuncertainty in thecontact area.Surfaceoxide
layers, which may be several nanometersthick, have also been found to enhancethe
elastic behavior seen for very shallow nanoindentations on metallic surfaces [78].
Removal of the oxide has been shown to alleviate the initial elastic response.
While nanoindentation testing is ideal for examining the mechanical properties
of defect-free volumes and looking at the generation of defects in perfect crystal
lattices, it should be clear from the preceding discussion that great care must be
taken in examininghow the surface propertiesand the loading rate affect the results,
particularly when comparisonsare being made to theoretical models for defect gen-
eration.
12.4.2 Variations with Depth
Ideal elastic-plastic behavior, as described by Tabor [48], can be seen during inden-
tation testing, provided the sample has been work-hardened so that the flow stress
is a constant. However, it is often the case that the mechanical properties appear to
change as the load (or depth) is increased. This apparent change can be a result of
several processes, including work-hardening during the test. This is a particularly
important effect for soft metals like copper. These metals usually have a high hard-
ness at shallow depths, but it decreases asymptotically with increasing indentation
depth to a hardness value that may be less than half that observed at shallow depths.
This type of behavior is due to the increasing density of geometrically necessary
dislocations at shallow depths [88]. Hence the effects of work-hardening are most
pronounced at shallow depths. For hard materials the effect is less obvious.
Work-hardening is one of the factors that contribute to the so-called indentation
size effect (ISE), whereby at shallow indentation depths the material appears to be
harder. The ISE has been widely observed during microindentation testing, with at
least part of the effect appearing to result from the increased difficulty in optically
measuring the area of an indentation when it is small. During nanoindentation test-
ing the ISE can also be observed, but it is often due to the tip area function, A
c
(δ
c
),
12 Nanomechanical Properties of Solid Surfaces and Thin Films 635
being incorrectly calibrated. However, there are physical reasons other than work-
hardening for expecting an increase in mechanical strength in small volumes. As
described in the previous section, small volumes of crystalline materials can have
either no defects or only a small number of defects present, making plastic yielding
more difficult. Also, because of dislocation line tension, the shear stress required to
make a dislocation bow out increases as the radius of the bow decreases. Thus, the
shear stress needed to make a dislocation bow out in a small volume is greater than
it is in a largevolume. These physical reasons for small volumes appearing stronger
than large volumes are particularly important in thin film systems, as will be dis-
cussed later. Note, however, that these physical reasons for increased hardness do
not apply for an amorphous material such as fused silica, which partially explains
its value as a calibration material.
12.4.3 Anisotropic Materials
The analysis methods detailed earlier were concerned primarily with the interpre-
tation of data from nanoindentations in isotropic materials where the elastic modu-
lus is assumed to be either independent of direction or a polycrystalline average
of a material’s elastic constants. Many crystalline materials exhibit considerable
anisotropy in their elastic constants, hence, these analysis techniques may not al-
waysbe appropriate.The theoreticalproblemof a rigidindenter pressedinto an elas-
tic, anisotropic half-space has been considered by Vlassak and Nix [89]. Their aim
was to identify the feasibility of interpreting data from a depth-sensing indentation
apparatus for samples with elastic constants that are anisotropic. Nanoindentation
experiments [90] have shown the validity of the elastic analysis for crystalline zinc,
copper, and beta-brass. The observed indentation modulus for zinc, as predicted,
varied by as much as a factor of 2 between different orientations. The variations in
the observed hardness values for the same materials were smaller, with a maximum
variation with orientation of 20% detected in zinc. While these variations are clearly
detectable with nanoindentation techniques, the variations are small in comparison
to the actual anisotropy of the test material’s elastic properties. This is because the
indentation modulus is a weighted average of the stiffness in all directions.
At this time theeffects of anisotropy onthe hardness measuredusing nanoinden-
tation have not been fully explored. For materials with many active slip planes it is
likely that the small anisotropy observed by Vlassak and Nix is correct once plastic
flow has been initiated. It is possible, however, that for defect-free crystalline speci-
mens with a limited number of active slip planes that very shallow nanoindentations
may show a much larger anisotropy in the observed hardness and initial yield point
load.
12.4.4 Fracture and Delamination
Indentation testing has been widely used to study fracture in brittle materials [91],
but the lower loads and smaller deformation regions of nanoindentation tests make