Bhushan B. Nanotribology and Nanomechanics: An Introduction
Подождите немного. Документ загружается.

616 Adrian B. Mann
1.0
0.8
0.6
0.4
0.2
Signal
–25
z/λ
0
–50 0
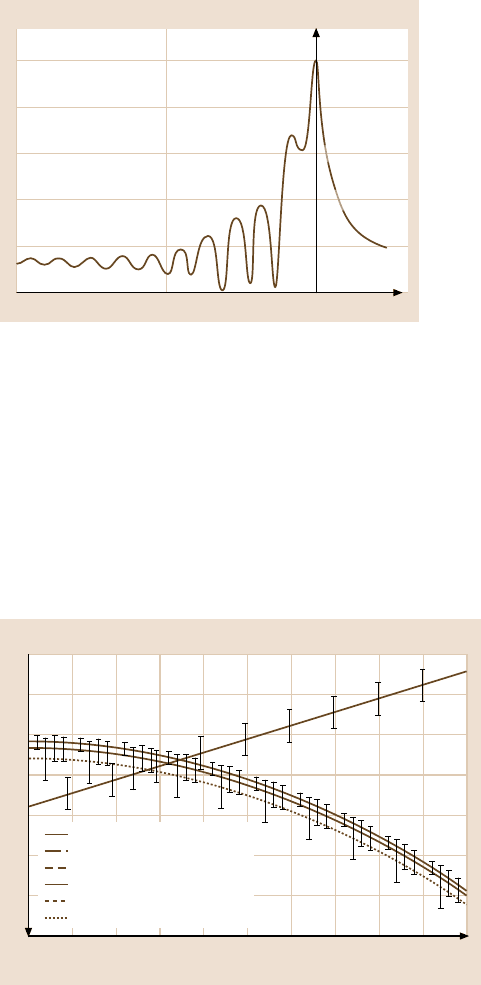
Fig. 12.7. A typical V(z)
curve obtained with a SAM
when testing fused silica
tation combined to find both E
s
and ν
s
, as illustrated by Fig. 12.8 [34]. This is not
possible when using only one of the techniques alone.
In addition to measuring surface properties, SAM has been used to study thin
films on a surface.However,the Rayleigh wave velocitycan be dependenton a com-
plex mix of the film and substrate properties. Other acoustic methods have been
utilized to study freestanding films. A freestanding film can be regarded as a plate,
and, therefore, it is possible to excite Lamb waves in the film. Using a pulsed laser
to generate the waves and a heterodyne interferometer to detect the arrival of the
Lamb wave, it is possible to measure the flexural modulus of the film [35]. This has
Young’s modulus (GPa)
85
80
75
70
65
60
55
50
0
Silica acoustic
Nanoindentation
Nanoindentation
Nanoindentation
Nanoindentation
Nanoindentation
1,000 nm
500 nm
150 nm
200 nm
100 nm
Poissons ratio
0.05 0.1 0.15 0.2 0.25 0.3 0.35 0.4 0.45 0.5
Fig. 12.8. Because SAM and nanoindentation have different dependencies on Young’s modu-
lus, E, and Poissons ratio, ν, it is possible to use the two techniques in combination to find
E and ν [34]. On the graph, the intersection of the curves gives E and ν
12 Nanomechanical Properties of Solid Surfaces and Thin Films 617
been successfully demonstrated for multilayer films with a total thickness < 10µm.
In the plate configuration, due to the nonlinearity of elastic properties, it is also pos-
sible to measure stress. This has been demonstrated for horizontally polarized shear
waves in plates [36], but thin plates require very high frequencytransducers or laser
sources.
12.2.7 Imaging Methods
When measuring the mechanical properties of a surface or thin film using nanoin-
dentation, it is not always easy to visualize what is happening. In many instances
there is a risk that the mechanical data can be completely misinterpreted if the geo-
metry of the test is not as expected. To expedite the correct interpretation of the
mechanical data, it is generally worthwhile to use optical, electron, or atomic force
microscopy to image the nanoindentations. Obviously, optical techniques are only
of use for larger indentations, but they will often reveal the presence of median or
lateral cracks[37]. Electron microscopyand AFM, however, can be used to examine
even the smallest nanoindentations. The principle problem with these microscopy
techniques is the difficulty in finding the nanoindentations. It is usually necessary
to make large, “marker” indentations in the vicinity of the nanoindentations to be
examined in order to find them [38].
It is possible to see features such as extrusions with a scanning electron micro-
scope (SEM) [39], as well as pile-up and sink-in around the nanoindents, though
AFM is generally better for this. Transmission electron microscopy (TEM) is useful
for examining what has happened subsurface, for instance, the indentation induced
dislocations in a metal [40] or the phases present under a nanoindent in silicon [21].
However, with TEM there is the added difficulty of sample preparation and the as-
sociated risk of observing artifacts. Recently, there has been considerable interest in
the use of focused ion beams to cut cross sections through nanoindents [41]. When
used in conjunction with SEM or TEM this provides an excellent means to see what
has happened in the subsurface region.
One other technique that has proved to be useful in studying nanoindents is
micro-Ramanspectroscopy. This involvesusing a microscope to focus a laser on the
sample surface. The same microscope is also used to collect the scattered laser light,
which is then fed into a spectroscope. The Raman peaks in the spectrum provide
information on the bonding present in a material, while small shifts in the wave
number of the peaks can be used as a measure of strain. Micro-Raman has proven
to be particularly useful for examining the phases present around nanoindentations
in silicon [42].
12.3 Data Analysis
The analysis of nanoindentation data is far from simple. This is mostly due to the
lack of effective models that are able to combine elastic and plastic deformation
under a contact. However, provided certain precautions are taken, the models for
618 Adrian B. Mann
perfectly elastic deformation and ideal plastic materials can be used in the analysis
of nanoindentationdata. For this reason, it is worth briefly reviewing the models for
perfect contacts.
12.3.1 Elastic Contacts
The theoretical modeling of elastic contacts can be traced back many years, at least
to the late nineteenth century and the work of Hertz (1882) [43] and Boussinesq
(1885) [44]. These models, which are still widely used today, consider two ax-
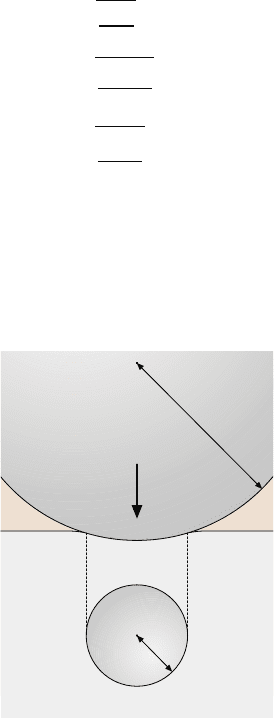
isymmetric curved surfaces in contact over an elliptical region (see Fig. 12.9). The
contact region is taken to be small in comparison to the radius of curvature of the
contacting surfaces, which are treated as elastic half-spaces. For an elastic sphere,
radius R, in contact with a flat, elastic half-space, the contact region will be circular
and the Hertz model gives the following relationships:
a =
3
3PR
4E
r
, (12.3)
δ =
3
9P
2
16RE
2
r
, (12.4)
P
0
=
3
6PE
2
r
π
3
R
2
, (12.5)
where a is the radius of the contact region, E
r
is given by (12.2), δ is the displace-
ment of the sphere into the surface, P is the applied load and P
0
is the maximum
pressure under the contact (in this case at the center of the contact).
The work of Hertz and Boussinesq was extended by Love [45,46] and later by
Sneddon [47], who simplified the analysis using Hankel transforms. Love showed
P
Side
Below
a
R
Fig. 12.9. Hertzian contact of a sphere, radius R,
on a semi-infinite, flat surface. The contact in this
case is a circular region of radius a

12 Nanomechanical Properties of Solid Surfaces and Thin Films 619
how Boussinesq’s model could be used for a flat-ended cylinder and a conical in-
denter, while Sneddon produced a generalized relationship for any rigid axisym-
metric punch pushed into an elastic half-space. Sneddon applied his new analysis
to punches of various shapes and derived the following relationships between the
applied load, P, and displacement, δ, into the elastic half-space for, respectively,
a flat-ended cylinder, a cone of semi-vertical angle φ, and a parabola of revolution
where a
2
= 2kδ:
P =
4μaδ
1−ν
, (12.6)
P =
4μcotφ
π
(
1−ν
)
δ
2
, (12.7)
P =
8μ
3
(
1−ν
)
2kδ
3
1/2
, (12.8)
where μ and ν are the shear modulus and Poisson’s ratio of the elastic half-space,
respectively.
The key point to note about (12.6), (12.7), and (12.8) is that they all have the
same basic form, namely:
P = αδ
m
, (12.9)
where α and m are constants for each geometry.
Equation (12.9) and the relationships developed by Hertz and his successors,
(12.3–12.8),form the foundationfor much of the current nanoindentationdata anal-
ysis routines.
12.3.2 Indentation of Ideal Plastic Materials
Plastic deformation during indentation testing is not easy to model. However, the
indentation response of ideal plastic metals was considered by Tabor in his classic
text,“The Hardnessof Metals” [48]. An idealplastic material (or moreaccurately an
ideal elastic-plasticmaterial) hasa linear stress-straincurveuntil it reachesits elastic
limit and then yields plastically at a yield stress,Y
0
, that remains constant even after
deformation has commenced. In a 2-D problem, the yielding occurs because the
Huber-Mises [49] criterion has been reached. In other words, the maximum shear
stress acting on the material is around 1.15Y
0
/2.
First, we consider a 2-D flat punch pushed into an ideal plastic material. By
using the method of slip lines it is found that the mean pressure, P
m
, across the end
of the punch is related to the yield stress by:
P
m
= 3Y
0
. (12.10)
If the Tresca criterion [50] is used, then P
m
is closer to 2.6Y
0
. In general, for
both 2-D and three-dimensional punches pushed into ideal plastic materials, full
plasticity across the entire contact region can be expected when P
m
= 2.6to3.0Y
0
.

620 Adrian B. Mann
However, significant deviations from this range can be seen if, for instance, the
material undergoeswork-hardeningduring indentation, or the material is a ceramic,
or there is friction between the indenter and the surface.
The apparently straightforwardrelationshipbetween P
m
and Y
0
makes the mean
pressure a very useful quantity to measure. In fact, P
m
is very similar to the Vickers
hardness, H
V
,ofamaterial:
H
V
= 0.927P
m
. (12.11)
During nanoindentation testing it is the convention to take the mean pressure
as the nanohardness. Thus, the “nanohardness”, H, is defined as the peak load, P,
applied during a nanoindentation divided by the projected area, A, of the nanoin-
dentation in the plane of the surface, hence:
H =
P
A
. (12.12)
12.3.3 Adhesive Contacts
During microindentation testing and even most nanoindentation testing the effects
of intermolecularand surface forces can be neglected.Very small nanoindentations,
however, can be influenced by the effects of intermolecular forces between the sam-
ple and the tip. These adhesive effects are most readily seen when testing soft poly-
mers, but there is some evidence that forces between the tip and sample may be
important in even relatively strong materials [51,52].
Contact adhesion is usually described by either the JKR or DMT model, as dis-
cussed earlier in this chapter. Both the models consider totally elastic spherical con-
tacts under the influence of attractive surface forces. The JKR model considers the
surface forces in terms of the associated surface energy, whereas the DMT model
considers the effects of adding van der Waals forces to the Hertzian contact model.
The differences between the two models are illustrated by Fig. 12.10.
Fornanoindentationtests conductedin air the condensationof water vaporat the
tip-sample interface usually determines the size of the adhesive force acting during
unloading. The effects of water vapor on a single nanoasperity contact have been
studied using force-controlled AFM techniques [53] and, more recently, nanoinden-
tation methods [26]. Unsurprisingly, it has also been found that water vapor can
affect the deformation of surfaces during nanoindentation testing [27].
In addition to water vapor, other surface adsorbates can cause dramatic changes
in the nanoscale mechanical behavior. For instance, oxygenon a clean metal surface
can cause an increase in the apparent strength of the metal [54]. These effects are
likely to be related to, firstly, changesin the surface and intermolecular forces acting
between the tip and the sample and, secondly,changes in the mechanical stability of
surface nanoasperities and ledges. Adsorbates can help stabilize atomic-scale varia-
tions in surface morphology, thereby making defect generation at the surface more
difficult.
12 Nanomechanical Properties of Solid Surfaces and Thin Films 621
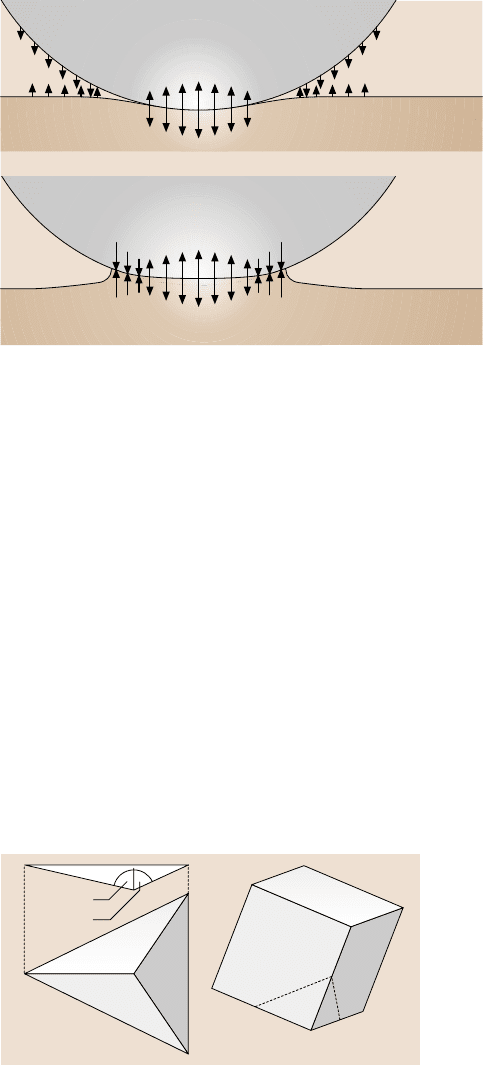
Only compressive
elastic forces in
region of contact
Van der Waals
forces outside
region of contact
DMT
All compressive
and tensile forces act
in region of contact
No forces outside
region of contact
JKR
Fig. 12.10. The contact geometry for the DMT and JKR models for adhesive contact. Both
models are based on the Hertzian model. In the DMT, model van der Waals forces outside the
region of contact introduce an additional load in the Hertz model. But for the JKR model, it
is assumed that tensile, as well as compressive stresses can be sustained within the region of
contact
12.3.4 Indenter Geometry
All of the indenter geometries considered up to this point have been axisymmetric,
largely because they are easier to deal with theoretically. Unfortunately, fabricating
axisymmetric nanoindentation tips is extremely difficult, because shaping a hard
tip on the scale of a few nanometers is virtually impossible. Despite these prob-
lems, there has been considerable effort put into the use of spherical nanoindenta-
tion tips [55]. This clearly demonstrates that the spherical geometrycan be useful at
larger indentation depths.
Because of the problems associated with creating axisymmetricnanoindentation
tips, pyramidal indenter geometries have now become standard during nanoinden-
tation testing. The most common geometries are the three-sided Berkovich pyramid
and cube-corner (see Fig. 12.11). The Berkovich pyramid is based on the four-sided
Berkovich pyramid
Corner of a cube
77.03q
65.27q
Fig. 12.11. The ideal geo-
metry for the three-sided
Berkovich pyramid and cube
corner tips
622 Adrian B. Mann
Vickers pyramid, the opposite sides of which make an 136
◦
angle. For both the
Vickers and Berkovich pyramids the cross-sectional area of the pyramid’s base, A,
is related to the pyramid’s height, D, by:
A = 24.5D
2
. (12.13)
The cube-corner geometry is now widely used for making very small nanoin-
dentations, because it is much sharper than the Berkovich pyramid. This makes it
easier to initiate plastic deformation at very light loads, but great care should be
taken when using the cube-corner geometry. Sharp cube-corners can wear down
quickly and become blunt, hence the cross-sectional area as a function of depth can
change over the course of several indentations. There is also a potential problem
with the standard analysis routines [56], which were developed for much blunter
geometries and are based on the elastic contact models outlined earlier. The elas-
tic contact models all assume the displacement into the surface is small compared
to the tip radius. For the cube-corner geometry this is probably only the case for
nanoindentationsthat are no more than a few nanometers deep.
12.3.5 Analyzing Load/Displacement Curves
The load/displacement curves obtained during nanoindentation testing are decep-
tively simple. Most newcomers to the area will see the curves as being somewhat
akin to the stress/strain curves obtained during tensile testing. There is also a real
temptation just to use the values of hardness, H, and elastic modulus, E, obtained
from standard analysis software packages as the “true” values. This may be the
case in many instances, but for very shallow nanoindents and tests on thin films the
geometry of the contact can differ significantly from the geometry assumed in the
analysis routines. Consequently, experimentalists should think very carefully about
the test itself before concluding that the values of H and E are correct.
The basic shape of a load/displacement curve can reveal a great deal about the
type of material being tested. Figure 12.12 shows some examples of ideal curves
for materials with different elastic moduli and yield stresses. Discontinuities in the
load/displacementcurve can alsoprovideinformation on such processes as fracture,
dislocationnucleation,and phasetransformations.Initially, though,we will consider
ideal situations such as those illustrated by Fig. 12.12.
Theloadingsectionof theload/displacementcurveapproximatesa parabola[57]
whose width depends on a combination of the material’s elastic and plastic proper-
ties. The unloading curve, however, has been shown to follow a more general rela-
tionship [56] of the form:
P = α
(
δ −δ
i
)
m
, (12.14)
where δ is the total displacement and δ
i
is the intercept of the unloading curve with
the displacement axis shown in Fig. 12.13.
Equation (12.14) is essentially the same as (12.9) but with the origin displaced.
Since (12.9) is obtained by considering purely elastic deformation, it follows that
12 Nanomechanical Properties of Solid Surfaces and Thin Films 623
Load
Displacement
High H
High E
Load
Displacement
Low H
High E
Load
Displacement
High H
Low E
Load
Displacement
Low H
Low E
Fig. 12.12. Examples of
load/displacement curves
for idealized materials with
a range of hardness and
elastic properties
a)
b)
Load P
Displacement δ
δ
c
δ
max
δ
i
δ
P
Loading
Unloading
S
Load P
Displacement δ
δ
max
δ
i
δ
P
Loading
Unloading
S
Range of δ
c
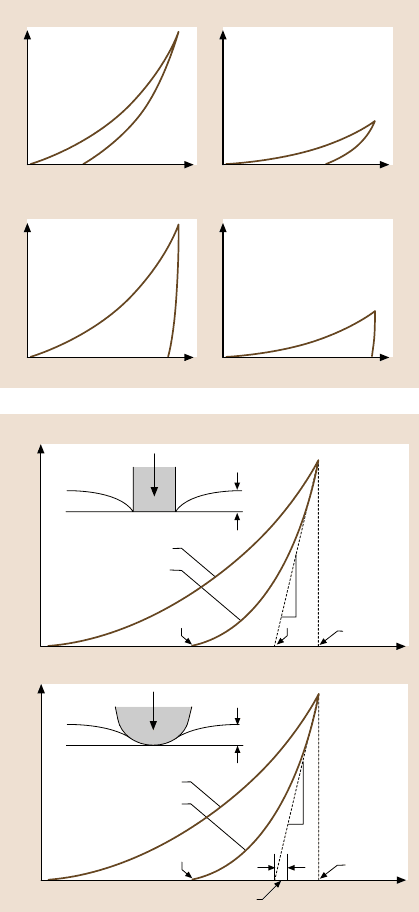
Fig. 12.13. Analysis of the
load/displacement curve
gives the contact stiffness, S ,
and the contact depth, δ
c
.
These can then be used to
find the hardness, H,and
elastic, or Young’s modu-
lus, E.(a) The first method
of analysis [58–60] assumed
the unloading curve could be
approximated by a flat punch
on an elastic half-space. (b)
A more refined analysis [56]
uses a paraboloid on an elas-
tic half-space
the unloading curve is exhibiting purely elastic behavior. Since the shape of the un-
loading curve is determined by the elastic recovery of the indented region, it is not
entirelysurprisingthat its shape resemblesthat found for purelyelastic deformation.
What is fortuitous is that the elastic analysis used for an elastic half-space seems to
be valid for a surface where there is a plastically formed indentation crater present
624 Adrian B. Mann
under the contact. However, the validity of this analysis may only hold when the
crater is relatively shallow and the geometry of the surface does not differ signifi-
cantly from that of a flat, elastic half-space. For nanoindentations with a Berkovich
pyramid, this is generally the case.
BeforeOliver and Pharr [56] proposed their now standard method foranalyzing
nanoindentation data, the analysis had been based on the observation that the initial
part of the unloading curve is almost linear. A linear unloading curve, equivalent to
m = 1 in (12.14), is expected when a flat punch is used on an elastic half-space. The
flat punch approximation for the unloading curve was used in [58–60] to analyze
nanoindentation data. When Oliver and Pharr looked at a range of materials they
found m was typically larger than 1, and that m = 1.5, or a paraboloid, was a better
approximation than a flat punch. Oliver and Pharr used (12.1) and (12.12) to obtain
the values for a material’s elastic modulus and hardness. Equation (12.1) relates the
contact stiffness during the initial part of the unloading curve (see Fig. 12.13) to
the reduced elastic modulus and the contact area at the peak load. Equation (12.12)
gives the hardness as the peak load divided by the contact area. It is immediately
obvious that the key to measuring the mechanical properties of a material is know-
ing the contact area at the peak load. This is the single most important factor in
analyzing nanoindentation data. Most mistakes in the analysis come from incorrect
assumptions about the contact area.
To find the contact area, a function relating the contact area, A
c
, to the contact
depth, δ
c
, is needed. For a perfect Berkovich pyramid this would be the same as
(12.13). But since making a perfect nanoindenter tip is impossible, an expanded
equation is used:
A
c
(
δ
c
)
= 24.5δ
2
c
+
7
j=1
C
j
2
j
δ
c
, (12.15)
where C
j
are calibration constants of the tip.
There is a crucial step in the analysis before A
c
can be calculated, namely, find-
ing δ
c
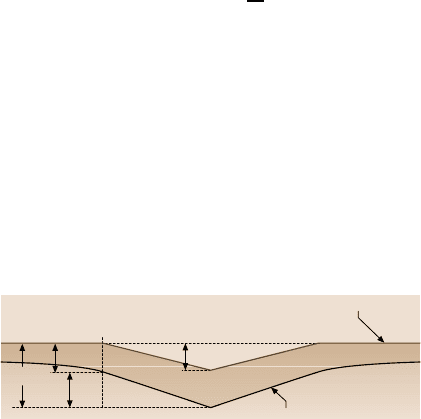
. The contact depth is not the same as the indentation depth, because the sur-
face aroundthe indentation will be elastically deflected duringloading, as illustrated
by Fig. 12.14. Sneddon’s analysis [47] provides a way to calculate the deflection of
the surface at the edge of an axisymmetric contact. Subtracting the deflection from
the total indentation depth at peak load gives the contact depth. For a paraboloid, as
used by Oliver and Pharr [56] in their analysis, the elastic deflection at the edge of
Surface after removal of load
Surface under load
δ
max
δ
s
δ
i
δ
c
Fig. 12.14. Profile of surface
under load and unloaded
showing how δ
c
compares
to δ
i
and δ
max
12 Nanomechanical Properties of Solid Surfaces and Thin Films 625
the contact is given by:
δ
s
= ε
P
S
= 0.75
P
S
, (12.16)
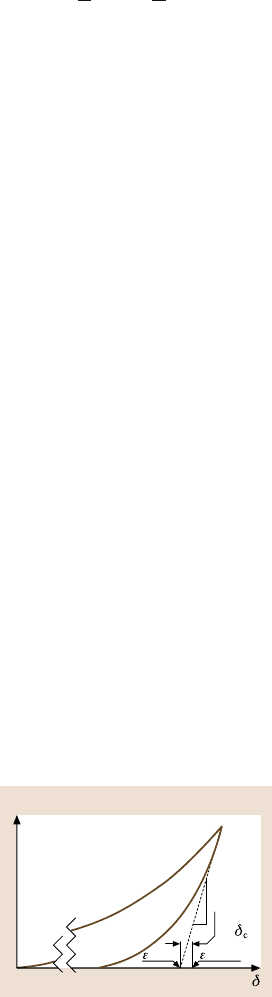
where S is the contact stiffness and P the peak load. The constant ε is 0.75 for
a paraboloid, but ranges between 0.72 (conic indenter) and 1 (flat punch). Fig-
ure 12.15 shows howthe contactdepth depends on the value of ε. The contact depth
at the peak load is, therefore:
δ
c
= δ −δ
s
. (12.17)
Using the load/displacement data from the unloading curve and (12.1), (12.2),
(12.12),(12.14–12.17),the hardnessandreduced elastic modulusfor thetest sample
can be calculated. To find the elastic modulus of the sample, E
s
, it is also necessary
to know Poisson’s ratio, ν
s
, for the sample, as well as the elastic modulus, E
t
,and
Poisson’s ratio, ν
t
, of the indenter tip. For diamond these are 1141GPa and 0.07,
respectively.
There also remains the issue of calibrating the tip shape, or finding the values
for C
j
in (12.15). Knowing the exact expansion of A
c
(δ
c
) is vital if the values for
E
s
and H are to be accurate. Several methods for calibrating the tip shape have been
used, including imaging the tip with an electron microscope, measuring the size
of nanoindentations using SEM or TEM of negative replicas, and using scanning
probes to examine either the tip itself or the nanoindentations made with the tip.
There are strengths and weaknesses to each of these methods. In general, however,
the accuracy and usefulness of the methods depends largely on how patient and
rigorous the experimentalist is in performing the calibration.
Because of the experimental difficulties and time involved in calibrating the tip
shape by these methods, Oliver and Pharr [56] developed a method for calibra-
tion based on standard specimens. With a standard specimen that is mechanically
isotropic and has a known E and H that does not vary with indentation depth, it
shouldbe possibleto performnanoindentationstoa rangeof depths,and thenuse the
analysis routines in reverse to deduce the tip area function, A
c
(δ
c
). In other words, if
you perform a nanoindentation test, you can find the contact stiffness, S, at the peak
load, P, and the contact depth, δ
c
, from the unloading curve. Then if you know E
Load P
S
Range
of
= 0.72= 1.0
Displacement
Fig. 12.15. Load-displacement curve showing how
δ
c
varies with ε