Bhushan B. Nanotribology and Nanomechanics: An Introduction
Подождите немного. Документ загружается.

252 A. Schirmeisen et al.
22
20
18
20 22 24
Amplitude (nm)
Phase (deg)
a)
ω < ω
0
ω < ω
0
ω < ω
0
b) c)
z-position (nm)
25
20
15
10
5
0
0
45
90
135
180
0 10203040
z-position (nm)
0 10203040
z-position (nm)
0 10203040
Amplitude (nm)
Phase (deg)
25
20
15
10
5
0
0
45
90
135
180
Amplitude (nm)
Phase (deg)
25
20
15
10
5
0
0
45
90
135
180
d
ret
d
app
d
ret
d
app
d
ret
d
ret
d
app
d
ret
d
app
d
ret
d
app
d
ret
d
app
d
app
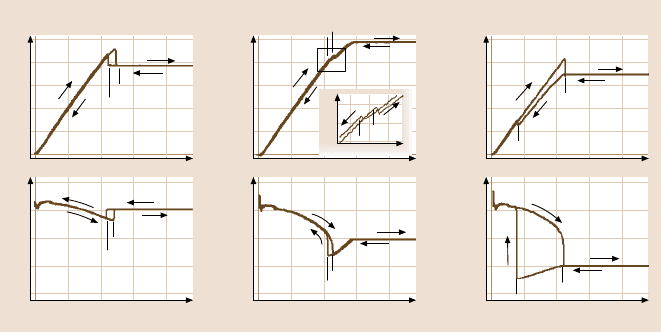
Fig. 6.12. Amplitude and phase diagrams with excitation frequency (a)below(b) exactly
at and (c) above the resonant frequency for tapping-mode AFM from experiments with a Si
cantilever on a Si wafer in air
the resonant frequency towards smaller values, induced by the attractive force in-
teraction, will reduce the oscillation amplitude. The distance between the tip and
sample is, therefore, reduced as well, and the self-amplifying effect with the sudden
instability does not occur as long as repulsive forces are not encountered. However,
at closer tip–sample distances, repulsive forces will cause the resonant frequency
to shift again towards higher values, increasing the amplitude with decreasing tip–
sample distance. Therefore, a self-enhancing instability will also occur in this case,
but at the crossover from purely attractive forces to the regime where repulsive
forces occur. Correspondingly, a small kink in the amplitude curve can be observed
in Fig. 6.11b. An even clearer indication of this effect is manifested by the sudden
change in the phase signal at d
app
.
In thelast case, with ω>ω
0
,theeffect of amplitudereductiondue tothe resonant
frequency shift is even larger. Again, we find no instability in the amplitude signal
during approach in the attractive force regime. However, as soon as the repulsive
force regime is reached, the instability occurs due to the induced positive frequency
shift. Consequently, a large jump in the phase curvefrom valuessmaller than 90 deg
to values larger than 90 deg is observed. The small change in the amplitude curve is
not resolved in the simulated curves in Fig. 6.11c, however, it can be clearly seen in
the experimental curves.
Figure 6.12depicts the correspondingexperimental amplitudeand phase curves.
The measurements were performed in air with a Si cantilever approaching a Si
wafer, with a cantilever resonant frequency of 299.95kHz. Qualitatively, all promi-
nent features of the simulatedcurves can also be found in the experimentaldata sets.
Hence, this model seems to capture the important factors necessary for an appropri-
ate description of the experimental situation.
6 Dynamic Modes of Atomic Force Microscopy 253
But what is the reason for this unexpected behavior? We have to turn to the
numerical simulations again, where we have access to all physical parameters, in
order to understand the underlying processes. The lower part of Fig. 6.11 also
shows the interaction force between the tip and the sample at the point of closest
approach, i.e., the sample-side turnaround point of the oscillation. We see that ex-
actly at the points of the discontinuities the total interaction force changes from the
net-attractive regime to the attractive–repulsive regime, also termed the intermittent
contact regime. The term net-attractive is used to emphasize that the total force is
attractive, despite the fact that some minor contributions might still originate from
repulsive forces. As soon as a minimum distance is reached, the tip also starts to
experience repulsive forces, which completely changes the oscillation behavior. In
other words, the dynamic system switches between two oscillatory states.
Directly related to this fact is the second phenomenon: the hysteresis effect.
We find separate curves for the approach of the probe towards the surface and the
retraction. This seems to be somewhat counterintuitive, since the tip is constantly
approaching and retreating from the surface, and the average values of amplitude
and phase should be independentof the direction of the averagetip–sample distance
movement. A hysteresis between approach and retraction within one oscillation due
to dissipative processes should directly influence amplitude and phase. However,
no dissipation models were included in the simulation. In this case, the hysteresis in
Fig. 6.11 is due to the fact that the oscillation jumps into different modes; the system
exhibits bistability. This effect is often observed in oscillators under the influence of
nonlinear forces [23].
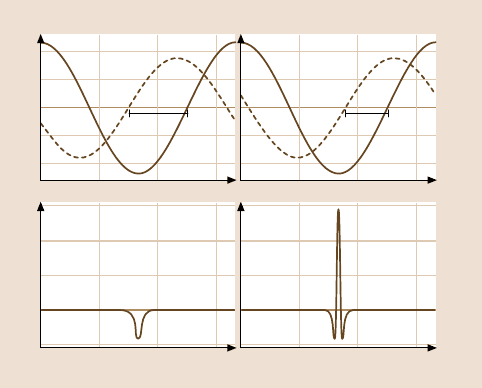
For the interpretation of these effects it is helpful to look at Fig. 6.13, which
shows the behavior of the simulated tip trajectory and the force during one oscil-
lation cycle over time. The data is shown for the z-positions where hysteresis is
observed, while (a) was taken during the approach and (b) during the retraction.
Excitation was in resonance, where the amplitude shows a small hysteresis. Also
note that the amplitude is almost exactly the same in (a) and (b). We see that the
oscillation at the same z-position exhibits two different modes: while in (a) the ex-
perienced force is net-attractive, in (b) the tip is exposed to attractive and repulsive
interactions. Experimentaland simulated datashow that thechange between thenet-
attractive and intermittent contact mode takes place at different z-positions (d
app
and
d
ret
) for approach and retraction. Between d
app
and d
ret
the system is in a bistable
mode. Depending on the history of the measurement, e.g., whether the position d
app
during the approach (or d
ret
during retraction) has been reached, the system flips to
the other oscillation mode. While the amplitude might not be influenced strongly,
the phase is a clear indicator of the mode switch. On the other hand, if the point
d
app
is never reached during the approach, the system will stay in the net-attractive
regime and no hysteresis is observed, i.e., the system remains stable.
In conclusion, we find that, although a qualitative interpretation of the inter-
action forces is possible, the AM-AFM is not suitable to gain direct quantitative
knowledge of tip–sample force interactions. However, it is a very useful tool for
imaging nanometer-sized structures in a wide variety of setups, in air or even in
254 A. Schirmeisen et al.
Deflection (nm)
Force (nN)
a) b)
Time (μs)
20
10
0
–10
–20
30
20
10
0
–10
Time (μs)
Excitation (Å)
1.0
0.5
0.0
– 0.5
– 1.0
01230123
φ
1
φ
2
Repulsive
Attractive
Repulsive
Attractive
Fig. 6.13. Simulation of the tapping-mode cantilever oscillation in the (a) net-attractive and
(b) the intermittent contact regime. The dashed line represents the excitation amplitude and
the solid line is the oscillation amplitude
liquid. We find that two distinct modes exist for the externally excited oscillation –
the net-attractive and the intermittent contact mode – which describe what kind of
forces govern the tip–sample interaction. The phase can be used as an indicator of
the current mode of the system.
In particular, it can be easily seen that, if the free resonant frequency of the can-
tilever is higher than the excitation frequency, the system cannot stay in the net-
attractive regime due to a self-enhancing instability. Since in many applications
involving soft and delicate biological samples strong repulsive forces should be
avoided,the tapping-modeAFM shouldbe operatedat frequenciesequal to or above
the free resonant frequency [24]. Even then, statistical changes of tip–sample forces
during the scan might induce a sudden jump into the intermittent contact mode, and
the previously explained hysteresis will tend to keep the system in this mode. It is
therefore of high importance to tune the oscillation parameters in such a way that
the AFM stays in the net-attractive regime [25]. A concept that achieves this task
is the Q-control system, which will be discussed in some detail in the forthcoming
paragraphs.
A last word concerning the overlap of simulation and experimental data: while
the qualitative agreement down to the detailed shape of hysteresis and instabilities
is rather striking, we still find some quantitative discrepancies between the positions
of the instabilities d
app
and d
ret
. This is probably due to the simplified force model,
which only takes into account van der Waals and repulsive forces. Especially at
ambient conditions, an omnipresent water meniscus between the tip and sample
will give rise to much stronger attractive and also dissipative forces than considered
6 Dynamic Modes of Atomic Force Microscopy 255
Phase (deg)
z-position
0
90
180
Δφ
1
Repulsive
Attractive
Free
Δφ
2
Fig. 6.14. Phase shift in
tapping mode as a function of
tip–sample distance
in the model. A very interesting feature is that the simulated phase curves in the
intermittent contact regime tend to have a steeper slope in the simulation than in the
experiments (seealso Fig. 6.14). We will later show that this effect is a fingerprint of
an effect that was not included in this simulation at all: dissipative processes during
the oscillation, giving rise to an additional loss of oscillation energy.
6.3.2 Self-Excitation Modes
Despite the wide rangeof technical applications of the AM mode of dynamic AFM,
it has been found unsuitable for measurements in an environment extremely useful
for scientific research: vacuum or ultrahigh vacuum (UHV) with pressures reaching
1×10
−10
mbar. The STM has already shown how much insight can be gained from
some highly defined experiments under those conditions.
Consider(6.11) from the previoussection. The time constantτ for the amplitude
to adjust to a different tip–sample force scales with 1/Q. In vacuum applications, Q
of the cantilever is on the order of 10,000, which means that τ is in the range of
some 10ms. This is clearly too long for a scan of at least (100×100) data points.
On the other hand, the resonant frequency of the system will react instantaneously
to tip–sample forces. This has led Albrecht et al. [11] to use a modified excitation
scheme.
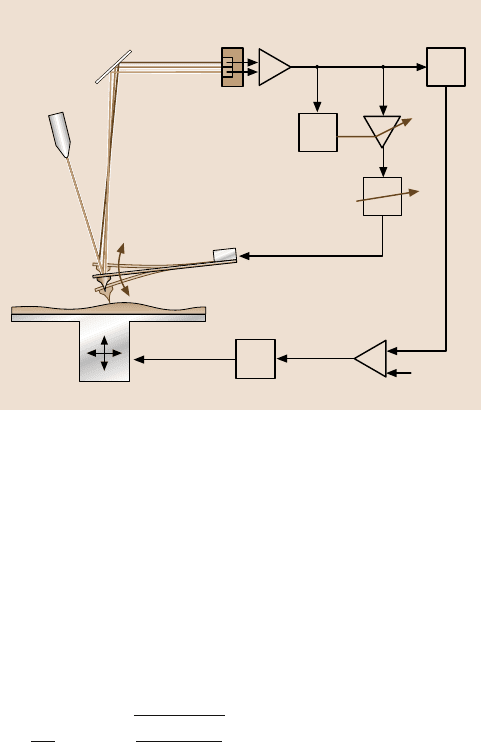
The system is always oscillated at its resonant frequency. This is achieved by
feeding back the oscillation signal from the cantilever into the excitation piezo-
element. Figure 6.15 illustrates the method in a block diagram. The signal from the
PSD is phase-shifted by 90deg (and, therefore, always exciting in resonance) and
used as the excitation signal of the cantilever. An additional feedback loop adjusts
the excitation amplitude in such a way that the oscillation amplitude remains con-
stant. This ensures that the tip–sample distance is not influenced by changes in the
oscillation amplitude. The only degree of freedom that the oscillation system still
has, which can react to the tip–sample forces, is the change of the resonant fre-
quency. This shift of the frequency is detected and used as the set-point signal for
256 A. Schirmeisen et al.
Laser
Detector
Mirror
Frequency
demodulator
PID-controller
x,y,z-scanner
Piezo
Sample
Cantilever
+ tip
Detector signal
Excitation signal
Set-point
Error signalz-Signal
Amplitude
control
Variable
phase shifter
G
Φ
Fig. 6.15. Dynamic AFM operated in the self-excitation mode, where the oscillation signal is
directlyfed back to theexcitation piezo. The detector signal is amplifiedwith thevariable gain
G and phase shifted by phase ϕ. The frequency demodulator detects the frequency shift due
to tip–sample interactions, which serves as the control signal for the probe–sample distance
surface scans. Therefore, this mode is also called the frequency-modulated (FM)
mode.
Let us take a look at the sensitivity of the dynamic AFM. If electronic noise,
lasernoise,and thermaldriftcan be neglected,the main noisecontributionwill come
from thermal excitations of the cantilever. A detailed analysis of a dynamic system
yields, for the minimum detectable force gradient, the following relation [11]:
∂F
∂z
|
MIN
=
4k·k
B
T ·B
ω
0
Q
z
2
osc
(6.17)
Here B is the bandwidth of the measurement, T the temperature, and
z
2
osc
is the
mean-square amplitude of the oscillation. Please note that this sensitivity limit was
deliberately calculated for the FM mode. A similar analysis of the AM mode, how-
ever, yields virtually the same result [26].We find that the minimum detectable force
gradient, i.e., the measurement sensitivity, is inversely proportional to the square
rootof the Q-factor of the cantilever. This meansthat it should bepossible to achieve
very high-resolution imaging under vacuum conditions where the Q-factor is very
high.
A breakthrough in high-resolution AFM imaging was the atomic-resolution
imaging of the Si(111)–(7×7) surface reconstruction by Giessibl [8] under UHV
conditions. Moreover, Sugawara et al. [27] observed the motion of single atomic
defects on InP with true atomic resolution. However, imaging on conducting or
6 Dynamic Modes of Atomic Force Microscopy 257
semiconducting surfaces is also possible with the scanning tunneling microscope
(STM) and these first non-contact AFM (NC-AFM) images provided little new in-
formation on surface properties. The true potential of NC-AFM lies in the imag-
ing of nonconducting surface with atomic precision, which was first demonstrated
by Bammerlin et al. [28] on NaCl. A long-standing question about the surface re-
construction of the technologically relevant material aluminium oxide could be an-
sweredby Barthet al. [29],whoimagedthe atomic structureof thehigh-temperature
phase of α-Al
2
O
3
(0001).
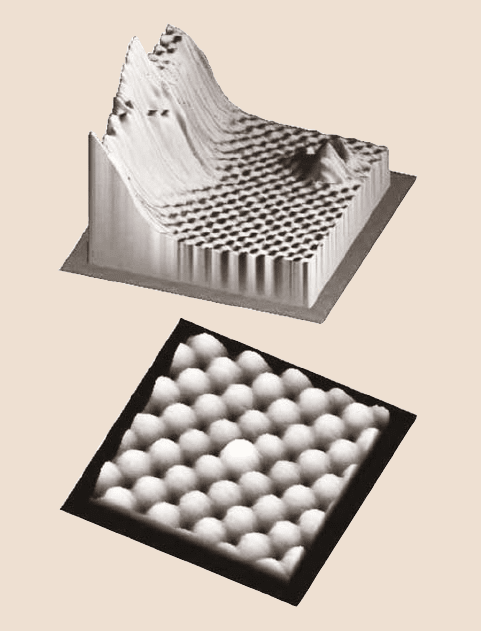
The high-resolution capabilities of non-contact atomic force microscopy are
nicely demonstrated by the images shown in Fig. 6.16. Allers et al. [30] imaged
steps and defects on the insulator nickel oxide with atomic resolution. Such a reso-
a)
b)
Fig. 6.16. Imaging of a NiO(001) sample surface with non-contact AFM. (a) Surface step
and an atomic defect. The lateral distance between two atoms is 4.17 Å. (b) A dopant atom is
imaged as a light protrusion about 0.1 Å higher than the other atoms. (Images courtesy of W.
Allers and S. Langkat, University of Hamburg)
258 A. Schirmeisen et al.
lution is routinely obtained today by different research groups (for an overview see,
e.g., [31–33]).
However, we are concerned with measuring atomic force potentials of a single
pair of molecules. Clearly, FM-mode AFM will allow us to identify single atoms,
and with sufficient care we will be able to ensure that only one atom from the tip
contributes to the total force interaction. Can we, therefore, fill in the last bit of
information and find a quantitative relation between the oscillation parameters and
the force?
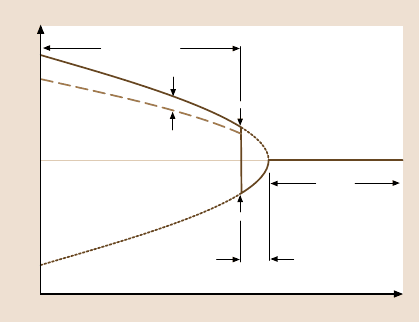
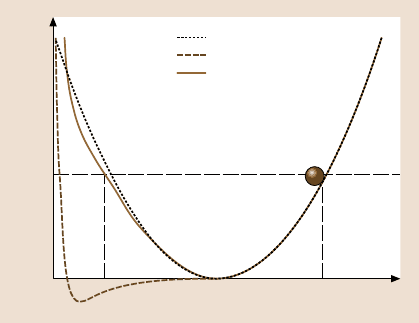
A good insight into the cantilever dynamics can be drawn from the tip potential
displayed in Fig. 6.17 [34]. If the cantilever is far away from the sample surface,
the tip moves in a symmetric parabolic potential (dotted line), and the oscillation is
harmonic. In such a case, the tip motion is sinusoidal and the resonant frequency is
determined by the eigenfrequency f
0
of the cantilever. If the cantilever approaches
the samplesurfacethe potentialis changed, given byan effectivepotential V
eff
(solid
line) which is the sum of the parabolic potential and the tip–sample interaction po-
tential V
ts
(dashed line). This effective potential differs from the original parabolic
potential and shows an asymmetric shape. As a result the oscillation becomes an-
harmonic, and the resonant frequency of the cantilever depends on the oscillation
amplitude.
Gotsmann et al. [35] investigated this relation with a numerical simulation. Dur-
ing each oscillation cycle the tip experiences a whole range of forces. For each step
during the approach the differential equation for the whole oscillation loop (also
including the feedback system) was evaluated and finally the quantitative relation
between the force and frequency shift was revealed.
However, there is also an analytical relationship, if some approximations are
accepted [7,36,37]. Here, we will follow the route indicated by [37], although alter-
native ways have also been proven successful. Consider the tip oscillation trajectory
reaches over a large part of the force gradient curve in Fig. 6.2. We model the tip–
sample interaction as a spring constant of stiffness k
ts
(z) = ∂F/∂z|
z
0
as in Fig. 6.1.
0
Cantilever potential
Tip-sample potential
Effective potential
E
D
z
min
D + 2Az
V(z)
Fig. 6.17. The frequency shift
in dynamic force microscopy
is caused by the tip–sample
interaction potential (dashed
line), which alters the har-
monic cantilever potential
(dotted line). Therefore, the
tip moves in an anharmonic
and asymmetric effective po-
tential (solid line). Here, z
min
is the minimum position of
the effective potential (from
Hölscher et al. [34])

6 Dynamic Modes of Atomic Force Microscopy 259
For small oscillation amplitudes we already found that the frequency shift is pro-
portional to the force gradient in (6.4). For large amplitudes, we can calculate an
effective force gradient k
eff
as a convolution of the force and the fraction of time, the
tip spends between the positions x and x+ dx:
k
eff
(z) =
2
πA
2
z+2A
z
F(x)·g
x−z
A
−1
dx with g(u) = −
u
√
1−u
2
. (6.18)
In the approximation that the vibration amplitude is much larger than the range of
the tip sample forces the above equation can be simplified to:
k
eff
(z) =
√
2
π
A
3/2
·
∞
z
F(x)
√
x−z
dx. (6.19)
This effective force gradient can now be used in (6.4), the relation between the
frequency shift and force gradient. We find:
Δ f =
f
0
√
2π ·kA
3/2
·
∞
z
F(x)
√
x−z
dx. (6.20)
If we separate the integral from other parameters, we can define:
Δ f =
f
0
kA
3/2
·γ(z)
with γ(z) =
1
√
2π
·
∞
z
F(x)
√
x−z
dx. (6.21)
This means we can define γ(z), which is only dependent on the shape of the force
curve F(z) but independent of the external parameters of the oscillation. The func-
tion γ(z)isalsoreferredtoasthenormalized frequency shift [7], a very useful pa-
rameter, which allows us to compare measurements independent of resonant fre-
quency, amplitude and spring constant of the cantilever.
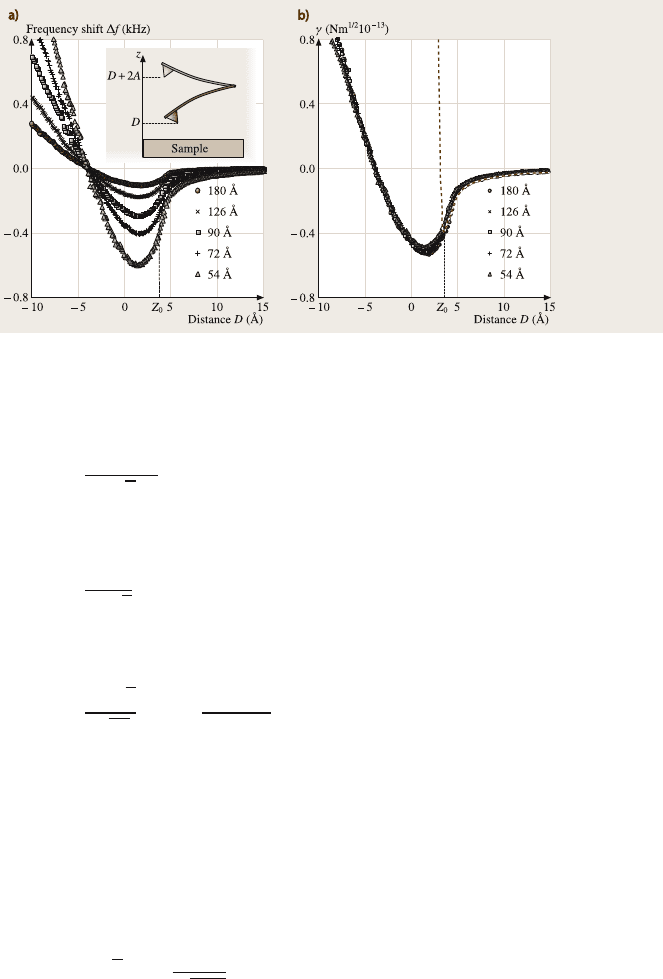
The dependence of the frequency shift on the vibration amplitude is an espe-
cially useful relation, since this parameter can be easily varied during one exper-
iment. A nice example is depicted in Fig. 6.18, where frequency shift curves for
different amplitudes were found to coincide very well in the γ(z) diagrams [38].
This relationship has been nicely exploited for the calibration of the vibration
amplitude by Guggisberg [39], which is a problem often encountered in dynamic
AFM operation and worthwhile discussing. One approaches tip and sample and
records frequency shift versus distance curves, which show a reproducible shape.
Then, with the z-feedback disabled, several curves with different amplitudes are
acquired. The amplitudes are typically chosen by adjusting the amplitude set point
in volts. One has to take care that drift in the z-direction is negligible. An analysis
of the correspondingγ(z)-curves will show the same curves (as in Fig. 6.18), but the
curves will be shifted in the horizontal axis. These shifts correspond to the change
in amplitude, allowing one to correlate the voltage values with the z-distances.
For the often-encounteredforce contributionsfrom electrostatic, van der Waals,
and chemical binding forces the frequency shift has been calculated from the force
laws. In the approximation that the tip radius R is larger than the tip–sample dis-
tance z, an electrostatic potential V will yield a normalized frequency shift of
(adapted from Guggisberg [40]):
260 A. Schirmeisen et al.
Fig. 6.18. (a) Frequency shift curves for different oscillation amplitudes for a silicon tip on
a graphite surface in UHV, (b) γ-curves calculated from the Δ f-curves in (a) (reprinted from
Hölscher et al. [38] with permission, Copyright (2000) by The American Physical Society)
γ(z) =
πε
0
R·V
2
√
2
·z
−1/2
. (6.22)
For van der Waals forces with Hamaker constant H and also with R larger than z we
find accordingly:
γ(z) =
H·R
12
√
2
·z
−3/2
(6.23)
Finally, short-range chemical forces represented by the Morse potential (with the
parameters binding energy U
0
, decay length λ and equilibrium distance z
equ
yield:
γ(z) =
U
0
√
2
√
πλ
·exp
−
(z−z
equ
)
λ
. (6.24)
These equations allow the experimentalist to interpret the spectroscopic measure-
ments directly. For example, the contributions of the electrostatic and van der Waals
forces can be easily distinguished by their slope in a double logarithmic plot (for an
example, see Guggisberg et al. [40]).
Alternatively, if the force law is not known beforehand, the experimentalist
wants to analyze the experimental frequency-shift data curves and extract the force
or energy potential curves. We, therefore, have to invert the integral in (6.21) to find
the tip–sample interaction potential V
ts
from the γ(z)-curves [37]:
V
ts
(z) =
√
2·
∞
z
γ(x)
√
x−z
dx. (6.25)
Using this method, quantitative force curves were extracted from Δ f-spectroscopy
measurements on different, atomically resolved sites of the Si(111)-(7×7) recon-
struction [1]. Comparison to theoretical molecular dynamics (MD) simulations
6 Dynamic Modes of Atomic Force Microscopy 261
showed good quantitative agreement with theory and confirmed the assumption
that force interactions were governed by a single atom at the tip apex. Our initially
formulated goal seems to be achieved: with FM-AFM we have found a powerful
method that allows us to measure the chemical bond formation of single molecules.
The last uncertainty, the exact shape and identity of the tip apex atom, can possi-
bly be resolved by employing the FIM technique to characterize the tip surface in
combination with FM-AFM.
All the above equations are only valid in the approximation that the oscilla-
tion amplitudes are much larger than the distance range of the encountered forces.
However, for amplitudes of, e.g., 10 nm and long-ranged forces like electrostatic
interactions this approximation is no longer valid. Several approaches have been
proposed by different authors to solve this issue [41–43]. The matrix method [42]
uses the fact that in a real experiment the frequency shift curve is not continuous,
but rather a set of discrete values acquired at equidistant points. Therefore the in-
tegral in (6.18) can be substituted by a sum and the equation can be rewritten as
a linear equation system, which in turn can be easily inverted by appropriate matrix
operations. This matrix method is a very simple and general method for the AFM
user to extract force curves from experimental frequency-shift curves without the
restrictions of the large-amplitude approximation.
In this context it is worthwhile to point out a slightly different dynamic AFM
method. While in the typical FM-AFM set-up the oscillation amplitude is controlled
to stay constant by a dedicated feedback circuit, one could simply keep the excita-
tion amplitude constant (this has been termed the constant-excitation (CE) mode as
opposed to the constant-amplitude (CA) mode. It is expected that this mode is more
gentle to the surface, because any dissipative interaction will reduce the amplitude
and therefore prevent a further reduction of the effective tip–sample distance. This
mode has been employed to image soft biological molecules like DNA or thiols in
UHV [44].
At first glance, quantitative interpretation of the obtained frequency spectra
seems more complicated, since the amplitude as well as the tip–sample distance is
altered during the measurement. However, it was found by Hölscher et al. [45] that
for the CE mode in the large-amplitude approximation the distance and the ampli-
tude channel can be decoupledby calculating the effective tip–sampledistance from
the piezo-controlled tip–sample distance z and the change in the amplitude with dis-
tance A(z):z
eff
(z) = z−A(z). As a result, (6.21) can then be directly used to calculate
the normalized frequency shift γ(z
eff
) and consequently the force curve can be ob-
tained from (6.25). This concept has been verified in experiments by Schirmeisen
et al. [46] through a direct comparison of spectroscopy curves acquired in the CE
and CA modes.
Until now, we have always associated the self-excitation scheme with vacuum
applications. Although it is difficult to operate FM-AFM in constant-amplitude
mode in air, since large dissipative effects make it difficult to ensure a constant
amplitude, it is indeed possible to use constant-excitation FM-AFM in air or even
in liquids. However, only a few applications of FM-AFM under ambient or liquid