Bhushan B. Nanotribology and Nanomechanics: An Introduction
Подождите немного. Документ загружается.


4 Noncontact Atomic Force Microscopy and Related Topics 141
instability occurs in the quasistatic mode if [36,37]
k < max
−
∂
2
V
ts
∂z
2
= k
max
ts
. (4.7)
Jump-to-contact can be avoided even for soft cantilevers by oscillating at a large
enough amplitude A [38]:
kA > max
(
−F
ts
)
. (4.8)
If hysteresis occurs in the F
ts
(z)-relation, energy ΔE
ts
needs to be supplied to
the cantilever for each oscillation cycle. If this energy loss is large compared to the
intrinsic energy loss of the cantilever, amplitude control can become difficult. An
additional approximate criterion for k and A is then
kA
2
2
≥
ΔE
ts
Q
2π
. (4.9)
Contribution of Long-RangeForces
The force between the tip and sample is composed of many contributions: electro-
static, magnetic, van-der-Waals and chemical forces in vacuum. All of these force
types exceptfor the chemical forces have stronglong-range componentswhich con-
ceal the atomic force components. For imaging by AFM with atomic resolution, it
is desirable to filter out the long-range force contributions and only measure the
force components which vary on the atomic scale. While there is no way to discrim-
inate between long- and short-range forces in static AFM, it is possible to enhance
the short-range contributions in dynamic AFM by proper choice of the oscillation
amplitude A of the cantilever.
Noise in the Imaging Signal
Measuring the cantilever deflection is subject to noise, especially at low frequencies
(1/ f noise). In static AFM, this noise is particularly problematic because of the
approximate 1/ f dependence. In dynamic AFM, the low-frequency noise is easily
discriminated when using a bandpass filter with a center frequency around f
0
.
Non-monotonic Imaging Signal
The tip–sample force is not monotonic. In general, the force is attractive for large
distances and, upon decreasing the distance between tip and sample, the force turns
repulsive (see Fig. 4.4). Stable feedback is only possible on a monotonic subbranch
of the force curve.
Frequency-modulationAFM helps to overcome challenges. The non-monotonic
imaging signal in AFM is a remaining complication for FM-AFM.
142 Franz J. Giessibl et al.
Deflection
measuring
scheme
Bandpass
filter
Phase
shifter
Automatic
gain control
(AGC)
Actuator
Mount
Cantilever
Sample
Damping Frequency
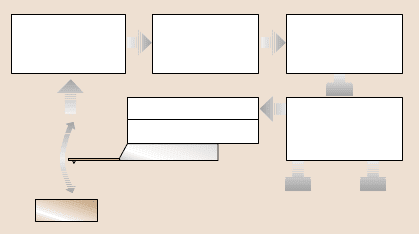
Fig. 4.5. Block diagram of
a frequency-modulation force
sensor
4.2.6 Frequency-Modulation AFM (FM-AFM)
In FM-AFM, a cantilever with eigenfrequency f
0
and spring constant k is subject to
controlled positive feedback such that it oscillates with a constant amplitude A [32],
as shown in Fig. 4.5.
Experimental Set-Up
The deflection signal is phase-shifted, routed through an automatic gain control cir-
cuit and fed back to the actuator. The frequency f is a function of f
0
, its quality
factor Q, and the phase shift φ between the mechanical excitation generated at the
actuator and the deflection of the cantilever. If φ = π/2, the loop oscillates at f = f
0
.
Threephysical observablescan be recorded:(1) a changein the resonancefrequency
Δ f, (2) the control signal of the automatic gain control unit as a measure of the
tip–sample energy dissipation, and (3) an average tunneling current (for conducting
cantilevers and tips).
Applications
FM-AFM was introduced by Albrecht and coworkers in magnetic force micro-
scopy[32]. The noiseleveland imaging speedwas enhancedsignificantlycompared
to amplitude-modulation techniques. Achieving atomic resolution on the Si(111)-
(7×7) surface has been an important step in the development of the STM [39] and,
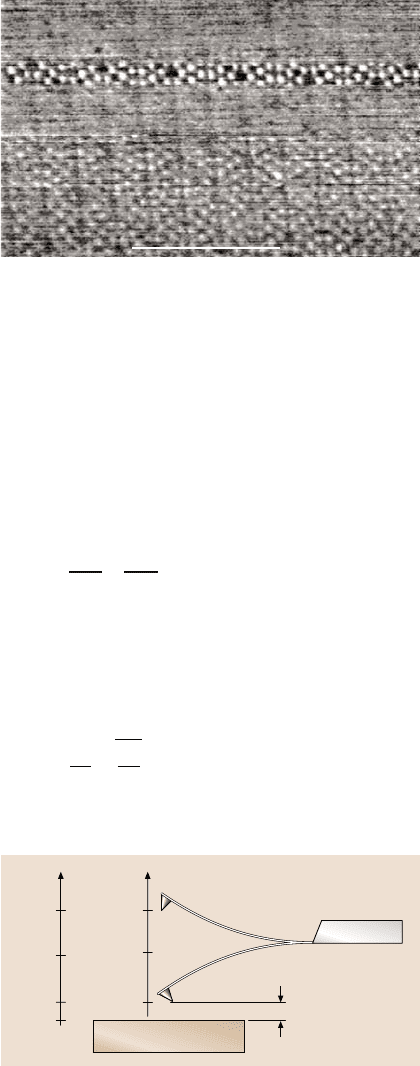
in 1994, this surface was imaged by AFM with true atomic resolution for the first
time [33] (see Fig. 4.6).
The initial parameters which provided true atomic resolution (see caption of
Fig. 4.6) were found empirically. Surprisingly, the amplitude necessary to obtain
good results was very large compared to atomic dimensions. It turned out later that
the amplitudes had to be so large to fulfill the stability criteria listed in Sect. 4.2.5.
Cantilevers with k ≈2000N/m can be operated with amplitudes in the Å range [24].
4 Noncontact Atomic Force Microscopy and Related Topics 143
10 nm
Fig. 4.6. First AFM image of
the Si(111)-(7×7) surface.
Parameters: k = 17 Nm, f
0
=
114 kHz, Q = 28,000, A =
34 nm, Δf = −70 Hz, V
t
= 0V
4.2.7 Relation Between Frequency Shift and Forces
The cantilever (spring constant k,effective mass m
∗
) is a macroscopic object and
its motion can be described by classical mechanics. Figure 4.7 shows the deflection
q
(t) of the tip of the cantilever: it oscillates with an amplitude A at a distance q(t)
from a sample.
Generic Calculation
The Hamiltonian of the cantilever is:
H =
p
2
2m
∗
+
kq
2
2
+ V
ts
(q) (4.10)
where p = m
∗
dq
/ dt. The unperturbed motion is given by:
q
(t) = Acos(2π f
0
t) (4.11)
and the frequency is:
f
0
=
1
2π
k
m
∗
. (4.12)
Sample
d+2A
d+A
d
0
q(t) q'(t)
A
0
–A
d
Cantilever
Fig. 4.7. Schematic view of
an oscillating cantilever and
definition of geometric terms

144 Franz J. Giessibl et al.
If the force gradientk
ts
= −∂F
ts
/∂z = ∂
2
V
ts
/∂z
2
is constant during the oscillation
cycle, the calculation of the frequency shift is trivial:
Δ f =
f
0
2k
k
ts
. (4.13)
However, in classic FM-AFM k
ts
varies over orders of magnitude during one
oscillation cycle and a perturbation approach, as shown below, has to be employed
for the calculation of the frequency shift.
Hamilton–Jacobi Method
The first derivation of the frequency shift in FM-AFM was achieved in 1997 [38]
using canonical perturbation theory [40]. The result of this calculation is:
Δ f = −
f
0
kA
2
F
ts
q
= −
f
0
kA
2
1/ f
0
0
F
ts
(d+ A+ q
(t))q
(t)dt . (4.14)
The applicability of first-order perturbation theory is justified because, in FM-
AFM, E is typically in the range of several keV, while V
ts
is of the order of a few
eV. Dürig [41] found a generalized algorithm that even allows one to reconstruct the
tip–sample potential if not only the frequency shift, but the higher harmonics of the
cantilever oscillation are known.
A Descriptive Expression for Frequency Shifts as a Function
of the Tip–Sample Forces
With integration by parts, the complicated expression (4.14) is transformed into
a very simple expression that resembles (4.13) [42].
Δ f =
f
0
2k
A
−A
k
ts
(z−q
)
A
2
−q
2
π
2
kA
2
dq
. (4.15)
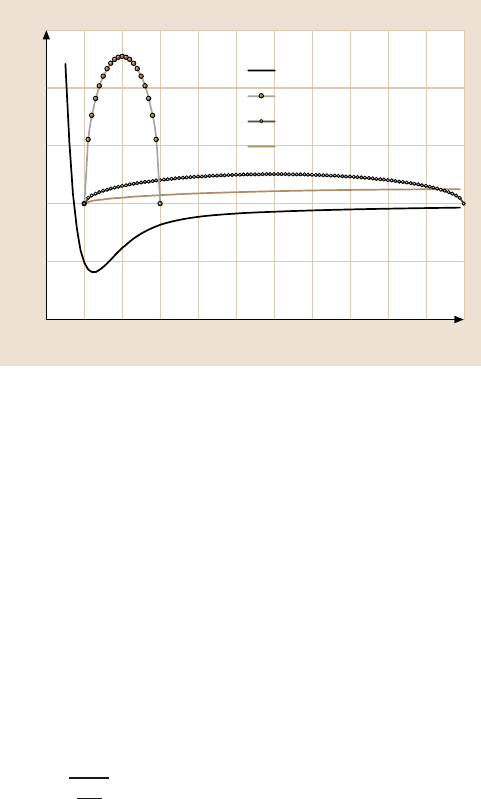
This expressionis closely relatedto (4.13):the constant k
ts
is replaced by a weighted
average, where the weight function w(q
, A) is a semicircle with radius A divided
bytheareaofthesemicircleπA
2
/2(seeFig.4.8).ForA → 0, w(q
, A)isarepre-
sentation of Dirac’s delta function and the trivial zero-amplitude result of (4.13) is
immediately recovered. The frequency shift results from a convolution between the
tip–sample force gradient and weight function. This convolution can easily be re-
versed with a linear transformation and the tip–sample force can be recovered from
the curve of frequency shift versus distance [42].
The dependence of the frequency shift on amplitude confirms an empirical con-
jecture:small amplitudesincreasethe sensitivity to short-rangeforces.Adjustingthe
4 Noncontact Atomic Force Microscopy and Related Topics 145
z (Å)
k
ts
(N/m), weight function w(z,A) (0.1/nm)
75
50
25
0
–25
–50
2345678910111213
Tip- sample force gradient
w (z, A = 1 Å)
w (z, A = 5 Å)
w (z, A = 10 Å)
Fig. 4.8. The tip–sample force gradient k
ts
and weight function for the calculation of the
frequency shift
amplitude in FM-AFM is comparable to tuning an optical spectrometer to a passing
wavelength. When short-range interactions are to be probed, the amplitude should
be in the range of the short-range forces. While using amplitudes in the Å range
has been elusive with conventional cantilevers because of the instability problems
described in Sect. 4.2.5, cantilevers with a stiffness of the order of 1000N/m like
those introduced in [23] are well suited for small-amplitude operation.
4.2.8 Noise in Frequency Modulation AFM: Generic Calculation
The vertical noise in FM-AFM is givenby the ratio between the noise in the imaging
signal and the slope of the imaging signal with respect to z:
δz =
δΔ f
∂Δ f
∂z
. (4.16)
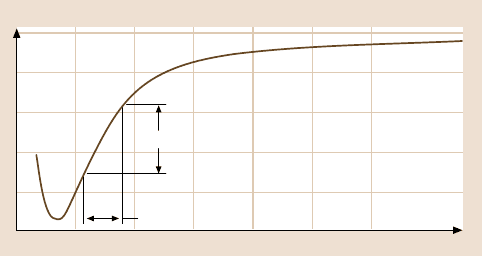
Figure 4.9 shows a typical curve of frequencyshift versus distance. Because the
distance between the tip and sample is measured indirectly through the frequency
shift, it is clearly evident from Fig. 4.9 that the noise in the frequency measurement
δΔ f translates into vertical noise δz and is given by the ratio between δΔ f and the
slope of the frequency shift curve Δ f(z)) (4.16). Low vertical noise is obtained for
a low-noise frequency measurement and a steep slope of the frequency-shift curve.
The frequency noise δΔ f is typically inversely proportional to the cantilever
amplitude A [32,43]. The derivative of the frequency shift with distance is constant
for A λ where λ is the range of the tip–sample interaction and proportional to
146 Franz J. Giessibl et al.
z (arb. units)
Δf (arb. units)
δΔf
δz
Fig. 4.9. Plot of the frequency shift Δf as a function of the tip–sample distance z. The noise in
the tip–sample distance measurement is given by the noise of the frequency measurement δΔf
divided by the slope of the frequency shift curve
A
−1.5
for A λ [38]. Thus, minimal noise occurs if [44]:
A
optimal
≈ λ (4.17)
for chemical forces, λ ≈ 1 Å. However, for stability reasons, (Sect. 4.2.5) extremely
stiff cantilevers are needed for small-amplitude operation. The excellent noise per-
formance of the stiff cantilever and the small-amplitude technique has been verified
experimentally [24].
4.2.9 Conclusion
Dynamic force microscopy, and in particular frequency-modulation atomic force
microscopy has matured into a viable technique that allows true atomic resolution
ofconducting andinsulatingsurfacesand spectroscopicmeasurementson individual
atoms [10,45]. Even true atomic resolution in lateral force microscopyis now possi-
ble [46]. Challenges remain in the chemical composition and structural arrangement
of the AFM tip.
4.3 Applications to Semiconductors
For the first time, corner holes and adatoms on the Si(111)-(7×7) surface have been
observed in very local areas by Giessible using pure noncontact AFM in ultrahigh
vacuum (UHV) [33]. This was the breakthrough of true atomic-resolution imaging
on a well-defined clean surface using the noncontact AFM. Since then, Si(111)-
(7 ×7) [34, 35, 45, 47], InP(110) [48] and Si(100)-2×1 [34] surfaces have been
successively resolved with true atomic resolution. Furthermore, thermally induced
motion of atoms or atomic-scale point defects on a InP(110) surface have been ob-
served at room temperature [48]. In this section we will describe typical results of
atomically resolved noncontact AFM imaging of semiconductor surfaces.
4 Noncontact Atomic Force Microscopy and Related Topics 147
4.3.1 Si(111)-(7×7) Surface
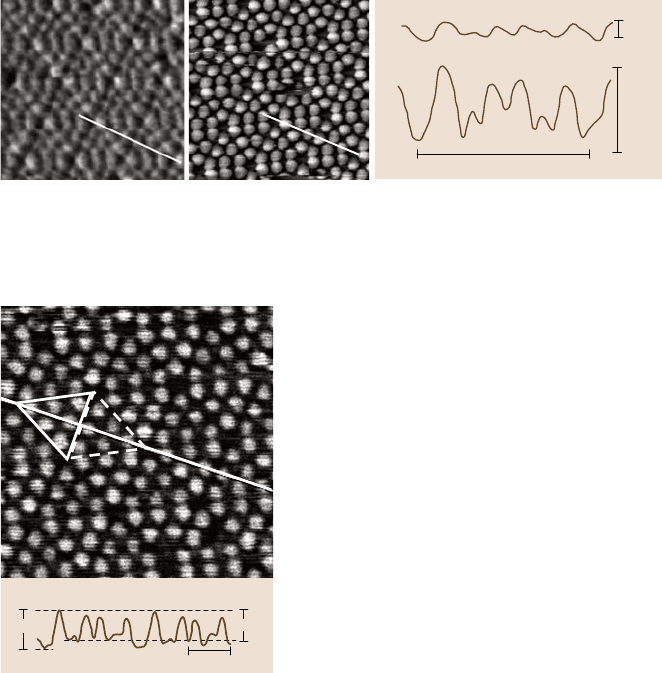
Figure 4.10 shows the atomic-resolution images of the Si(111)-(7×7) surface [49].
Here, Fig. 4.10a (type I) was obtained using the Si tip without dangling, which is
covered with an inert oxide layer. Figure 4.10b (type II) was obtained using the Si
tip with a dangling bond, on which the Si atoms were deposited due the mechanical
soft contact between the tip and the Si surface. The variable frequency shift mode
was used. We can see not only adatoms and corner holes but also missing adatoms
described by the dimer–adatom–stacking (DAS) fault model. We can see that the
image contrast in Fig. 4.10b is clearly stronger than that in Fig. 4.10a.
Interestingly, by using the Si tip with a dangling bond, we observed contrast
between inequivalent halves and between inequivalent adatoms of the 7 ×7 unit
cell. Namely, as shown in Fig. 4.11a, the faulted halves (surrounded with a solid
line) are brighter than the unfaulted halves (surrounded with a broken line). Here,
the positions of the faulted and unfaulted halves were determined from the step
c)
a)
b)
15 Hz
46.6 Å
b
3Hz
a
Fig. 4.10. Noncontact-mode AFM images of a Si(111)-(7×7) reconstructed surface obtained
using the Si tips (a) without and (b) with a dangling bond. The scan area is 99 Å×99 Å.
(c) The cross-sectional profiles along the long diagonal of the 7×7 unit cell indicated by the
white lines in (a)and(b)
b)
a)
1.4 Å
23.3 Å
1.7 Å
Fig. 4.11. (a) Noncontact mode AFM image with
contrast of inequivalent adatoms and (b) a cross-
sectional profile indicated by the white line.The
halves of the 7 × 7 unit cell surrounded by the
solid line and broken line correspond to the faulted
and unfaulted halves, respectively. The scan area is
89 Å×89 Å
148 Franz J. Giessibl et al.
direction. From the cross-sectional profile along the long diagonal of the 7×7 unit
cell in Fig. 4.11b, the heights of the corner adatoms are slightly higher than those
of the adjacent center adatoms in the faulted and unfaulted halves of the unit cell.
The measured corrugation are in the following decreasing order: Co−F > Ce−F >
Co−U > Ce−U, where Co−FandCe−F indicate the corner and center adatoms
in faulted halves, and Co−UandCe−U indicate the corner and center adatoms in
unfaulted halves, respectively. Averaging over several units, the corrugation height
differences are estimated to be 0.25Å, 0.15Å and 0.05Å for Co−F, Ce−Fand
Co−U, respectively, with respect to to Ce−U. This tendency, that the heights of the
corner adatoms are higher than those of the center adatoms, is consistent with the
experimental results using a silicon tip [47], although they could not determine the
faulted and unfaulted halvesof the unit cell in the measured AFM images. However,
this tendency is completely contrary to the experimental results using a tungsten
tip [35]. This differencemay originatefrom the difference between the tip materials,
whichseemstoaffect the interactionbetween the tip and thereactivesamplesurface.
Another possibility is that the tip is in contact with the surface during the small
fraction of the oscillating cycle in their experiments [35].
We consider that the contrast between inequivalent adatoms is not caused by
tip artifacts for the following reasons: (1) each adatom, corner hole and defect was
clearly observed, (2) the apparent heights of the adatoms are the same whether they
are located adjacent to defects or not, and (3) the same contrast in several images
for the different tips has been observed.
Itshould benoted thatthe corrugationamplitudeof adatoms≈1.4Å in Fig.4.11b
is higher than that of 0.8–1.0 Å obtained with the STM, although the depth of the
corner holes obtained with noncontact AFM is almost the same as that observed
with STM. Moreover, in noncontact-mode AFM images, the corrugation amplitude
of adatoms was frequently larger than the depth of the corner holes. The origin of
such large corrugation of adatoms may be due to the effect of the chemical interac-
tion, but is not yet clear.
The atom positions, surface energies, dynamic properties and chemical reactiv-
ities on the Si(111)-(7×7) reconstructed surface have been extensively investigated
theoretically and experimentally. From these investigations, the possible origins of
the contrast between inequivalent adatoms in AFM images are the followings: the
trueatomic heightsthat correspondto theadatom corepositions, thestiff
ness (spring
constant)of interatomic bonding with the adatoms correspondingto the frequencies
of the surface mode, the charge on the adatom, and the chemical reactivity of the
adatoms. Table 4.1 summarizes the decreasing orders of the inequivalent adatoms
for individual property. From Table 4.1, we can see that the calculated adatom
heights and the stiffness of interatomic bondingcannot explain the AFM data, while
the amount of charge of adatom and the chemical reactivity of adatoms can explain
the our data. The contrast due to the amount of charge of adatom means that the
AFM image is originated from the difference of the vdW or electrostatic physical
interactions between the tip and the valence electrons at the adatoms. The contrast
due to the chemical reactivity of adatoms means that the AFM image is originated

4 Noncontact Atomic Force Microscopy and Related Topics 149
Table 4.1. Comparison between the adatom heights observed in an AFM image and the vari-
ety of properties for inequivalent adatoms
Decreasing order Agreement
AFM image Co
−
F > Ce
−
F > Co
−
U > Ce
−
U–
Calculated height Co
−
F > Co
−
U > Ce
−
F > Ce
−
U ×
Stiffness of inter-atomic bonding Ce
−
U > Co
−
U > Ce
−
F > Co
−
F ×
Amount of charge of adatom Co
−
F > Ce
−
F > Co
−
U > Ce
−
U
Calculated chemical reactivity Faulted > Unfaulted
Experimental chemical reactivity Co
−
F > Ce
−
F > Co
−
U > Ce
−
U
from the difference of covalent bonding chemical interaction between the atoms at
the tip apex and dangling bond of adatoms. Thus, we can see there are two possible
interactionswhich explainthe strong contrastbetween inequivalentadatoms of 7×7
unit cell observed using the Si tip with dangling bond.
The weak-contrast image in Fig. 4.10a is due to vdW and/or electrostatic force
interactions. On the other hand, the strong-contrast images in Figs. 4.10b and 4.11a
are due to a covalent bonding formation between the AFM tip with Si atoms and
Si adatoms. These results indicate the capability of the noncontact-mode AFM to
image the variationin chemical reactivityof Si adatoms. In the future, by controlling
an atomic species at the tip apex, the study of chemical reactivity on an atomic scale
will be possible using noncontact AFM.
4.3.2 Si(100)-(2×1) and Si(100)-(2×1):H Monohydride Surfaces
In order to investigate the imaging mechanism of the noncontact AFM, a compar-
ative study between a reactive surface and an insensitive surface using the same
tip is very useful. Si(100)-(2×1):H monohydride surface is a Si(100)-(2×1) re-
constructed surface that is terminated by a hydrogen atom. It does not reconstruct
as metal is deposited on the semiconductor surface. The surface structure hardly
changes. Thus, the Si(100)-(2×1):H monohydridesurface is one of most useful sur-
face for a model system to investigate the imaging mechanism, experimentally and
theoretically. Furthermore, whether the interaction between a very small atom such
as hydrogen and a tip apex is observable with noncontact AFM is interested. Here,
we show noncontact AFM images measured on a Si(100)-(2×1) reconstructed sur-
face with a dangling bondand on a Si(100)-(2×1):Hmonohydridesurface on which
the dangling bond is terminated by a hydrogen atom [50].
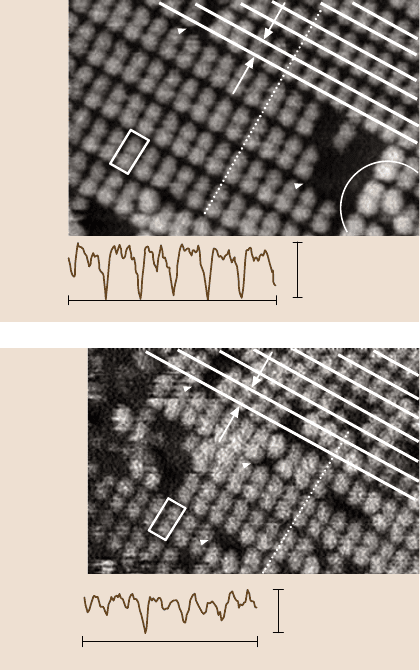
Figure 4.12a shows the atomic-resolution image of the Si(100)-(2×1) recon-
structed surface. Pairs of bright spots arranged in rows with a 2×1 symmetry were
observed with clear contrast. Missing pairs of bright spots were also observed, as
indicated by arrows. Furthermore, the pairs of bright spots are shown by the white
dashed arc and appear to be the stabilize-buckled asymmetric dimer structure. Fur-
thermore, the distance between the pairs of bright spots is 3.2±0.1Å.
150 Franz J. Giessibl et al.
b)
a)
46 Å
9Hz
A
3.2 r 0.1 Å
B
Fig. 4.12. (a) Noncontact
AFM image of a Si(001)-
(2×1) reconstructed surface.
The scan area was 69×46 Å.
One 2×1 unit cell is outlined
with a box. White rows are
superimposed to show the
bright spots arrangement.
The distance between the
bright spots on the dimer row
is 3.2±0.1Å.Onthewhite
arc, the alternative bright
spots are shown. (b) Cross-
sectional profile indicated by
the white dotted line
34 Å
6Hz
b)
a)
3.5 r 0.1 Å
Fig. 4.13. (a) Noncontact
AFM image of Si(001)-
(2×1):H surface. The scan
area was 69 ×46 Å. One
2× 1 unit cell is outlined
with a box. White rows are
superimposed to show the
bright spots arrangement.
The distance between the
bright spots on the dimer
row is 3.5±0.1Å.(b) Cross-
sectional profile indicated by
the white dotted line
Figure 4.13a shows the atomic-resolution image of the Si(100)-(2×1):H mono-
hydride surface. Pairs of bright spots arranged in rows were observed. Missing
paired bright spots as well as those paired in rows and single bright spots were
observed, as indicated by arrows. Furthermore, the distance between paired bright
spotsis3.5 ± 0.1 Å. This distance of 3.5 ± 0.1Å is 0.2 Å larger than that of the
Si(100)-(2×1) reconstructed surface. Namely, it is found that the distance between
bright spots increases in size due to the hydrogen termination.
The bright spots in Fig. 4.12 do not merely image the silicon-atom site, because
the distance between the bright spots forming the dimer structure of Fig. 4.12a,
3.2±0.1Å, is lager than the distance between silicon atoms of every dimer structure
model. (The maximum is the distance between the upper silicones in an asymmetric
dimer structure 2.9Å.) This seems to be due to the contribution to the imaging
of the chemical bonding interaction between the dangling bond from the apex of
the silicon tip and the dangling bond on the Si(100)-(2×1) reconstructed surface.
Namely, the chemical bonding interaction operates strongly, with strong direction