Bhushan B. Nanotribology and Nanomechanics: An Introduction
Подождите немного. Документ загружается.

1356 B. Bhushan, C. LaTorre
Micro/NanotribologicalCharacterization Using an AFM
Specimen Mounting
Hair specimens were mounted onto AFM sample pucks using Liquid Paper
cor-
rection fluid. A thin layer of the fluid was brushed onto the puck, and when the
fluid hardened into a tacky state, the hair sample was carefully placed. The Liquid
Paper
dries quickly to keep the hair firmly in place. An optical microscope was
used to preliminarily image the specimen to ensure none of the Liquid Paper
was
deposited on the hair surface.
Synthetic materials were attached to AFM sample pucks using double-sided ad-
hesive tape.
Surface Roughness, Friction Force, and Adhesive Force Measurements
Surface roughness and friction force measurements were performed using a com-
mercial AFM system (MultiMode Nanoscope IIIa, Digital Instruments, Santa Bar-
bara, CA) in ambient conditions (22 ±1
◦
C, 50 ±5% relative humidity) [27, 45–
48,53]. For nanoscale measurements, square pyramidal Si
3
N
4
tips of nominal 30–
50nm radius attached to the end of a soft Si
3
N
4
cantilever beam (spring constant of
0.06N/m) were used in the contact mode for surface roughness and friction force
measurements simultaneously. A softer cantilever was used to minimize damage to
the hair. After engagement of the tip with the cuticle surface, the tip was scanned
perpendicular to the longitudinal axis of the fiber. The tip was centered over the
cross section in order to be at the very top of the fiber, so as to negate effects caused
by the AFM tip hitting the sides of the hair and adding error to the measurements. In
order to minimize scanning artifacts, a scan rate of 1 Hz was used for all measure-
ments. Topographical images to characterize the shape and structure of the various
hair were taken at 5×5, 10×10, and 20×20µm
2
scans at a normal load of 5 nN.
These scan sizes were suitable for capturing the surface features of multiple scales
and scale edges of the cuticle. To characterize roughness, 2 ×2µm
2
scans of the
cuticle surface without edges were used. Friction force mapping of the scan area
was collected simultaneously with roughness mapping [45–48]. Figure 24.12 (bot-
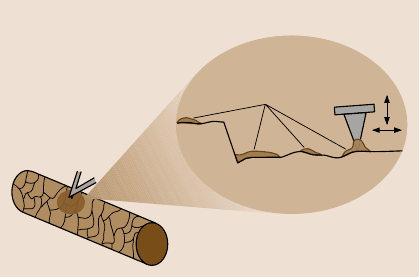
tom cartoon) and Fig. 24.18 show the AFM tip scanning over the hair surface for
untreated and conditioner treated hair, respectively. The effects of the conditioner
can be examined by comparing the friction information. A quantitative measure of
friction force was calculated by first calibrating the force based on a method by
Bhushan [7, 9,10]. The normal load was varied from 5 to 45 nN in roughly 5 nN
increments, and a friction force measurement was taken at each increment. By plot-
tingthe frictionforce asa functionof normalforce,the averagecoefficientof friction
was determined from the slope of the least squares fit line of the data.
Surfaceroughness images shown in this study were processedusing a first-order
“planefit” command available in the AFM software, which eliminates tilt in the
image. Roughness data as well as friction force data were taken after the “planefit”
command was employed. A first-order “flatten” command was also used on friction
force mappings to eliminate scanning artifacts and present a cleaner image.
24 Structural, Nanomechanical, and Nanotribological Characterization 1357
For completeness, it should be noted that Lodgeand Bhushan[53] have reported
some hair damage to occur during imaging in the contact mode. For high resolution
surface height imaging, they used the tapping mode AFM. In this method, a Si tip
lightly taps the sample surface at a constant amplitude to gather information on the
height of the sample surface. They found that the tapping mode is able to capture
more high frequency information than the contact mode due to nondestructive na-
ture.
Adhesive force measurements were made with square pyramidal Si
3
N
4
tips at-
tached to the end of a Si
3
N
4
cantilever beam (spring constant of 0.58 N/m), using
the “force calibration plot technique” [27,45,46,48,53].In this technique, the AFM
tip is brought into contact with the sample by extending the piezo vertically, then
retracting the piezo and calculating the force required to separate the tip from the
sample. The method is described in detail by Bhushan [7–10]. The cantilever de-
flection is plotted on the vertical axis against the Z-position of the piezo scanner
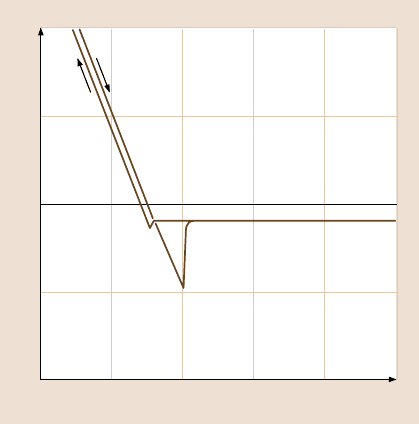
in a force calibration plot, Fig. 24.19. As the piezo extends (from right to left in
the graph), it approaches the tip and does not show any deflection while in free air.
The tip then approaches within a few nanometers (point A) and becomes attached
to the sample via attractive forces at very close range (point B). After initial contact,
any extension of the piezo results in a further deflection of the tip. Once the piezo
reaches the end of its designated ramp size, it retracts to its starting position (from
left to right). The tip goes beyond zero deflection and enters the adhesive regime.
At point C, the elastic force of the cantilever becomes equivalent to the adhesive
force, causing the cantilever to snap back to point D. The horizontal distance be-
tween A and D multiplied by the stiffness of the cantilever results in a quantitative
measure of adhesive force [7–10].
The force calibration plot allows for the calculation of an adhesive force at a dis-
tinct point on the sample surface. Consequently, by taking a force calibration plot at
discrete sampling intervals over an entire scan area, a resulting adhesive force map-
ping (also known as force-volume mapping) can be created to display the variation
in adhesive force over the surface [14].In this work, plots were taken at 64×64 dis-
tinct points over a scan area of 2×2µm
2
for all hair types and ethnicities. A custom
Treated
hair fiber
AFM
tip
Conditioner on cuticle of treated hair and interaction
with AFM tip
AFM
cantilever
Conditioner
Cuticle surface
Cuticle
edge
Fig. 24.18. Interactions be-
tween the AFM tip and con-
ditioner on the cuticle surface
for treated hair [46]
1358 B. Bhushan, C. LaTorre
program coded in Matlab was used to display the force-volumemaps. The adhesive
force for each force calibration plot was obtained by multiplying the spring con-
stant with the horizontal distance (in the retract mode) traveled by the piezo from
the point of zero applied load to the point where the tip snaps off.
For microscale adhesion and friction measurements, a 4 µm radius silica ball
was mounted on a Si
3
N
4
cantilever (spring constant of 0.58N/m) [47].
Relative Humidity, Temperature, and Soaking, and Durability Measurements
A Plexiglas test chamber enclosing the AFM system was used to contain the envi-
ronment to be humidity controlled.The humidity inside the chamber was controlled
by using desiccant to reduce humidity or by adding humid air to increase the hu-
midity. Measurements were taken at nominal relative humidities of 5, 50, and 80%.
Hair fibers were placed at each humidity for approximately 2 hours prior to meas-
urements.
A homemade thermal stage was used to conduct temperature effect measure-
ments at 20, 37, 50, and 80°C. Hair fibers were exposed to each temperature condi-
tion for approximately 30 minutes prior to testing.
Soak tests were performed as follows: A dry hair fiber was taken from a switch,
and a sample was cut from the fiber (approximately 7mm long) for coefficient of
friction measurements. An adjacent sample was also taken from the fiber and placed
in a small beaker filled with de-ionized water. The sample was subjected to the
aqueous environment for 5 minutes, which is representative of a typical exposure
time when showering/bathing, then immediately analyzed with AFM. It should be
noted that hair becomes saturated whenwet in about 1 minute and remains saturated
Piezo deflection ( )nm
250
–100
100
Cantilever deflection (nm)
0
A
–50
0
50
50 100 200150
D
B
C
Fig. 24.19. Typical force
calibration plot for Caucasian
virgin hair. Contact between
the tip and hair occurs at
point B. At point C, the
elastic force of the cantilever
becomes equivalent to the
adhesive force, causing the
cantilever to snap back to
point D
24 Structural, Nanomechanical, and Nanotribological Characterization 1359
Tip
Cross sectional view of the AFM tip and hair surface
Conditioner
Hair
F
E
θ
R
F
vdw
F
m
γ
h
Δz
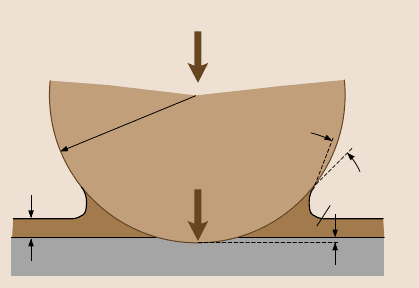
Fig. 24.20. Schematic of an enlarged cross-sectional view of the region around the AFM tip,
conditioner and hair surface. The parameters used in the text are defined. Here, R is the tip
radius, h is the conditioner film thickness, γ is the surface tension of the conditioner, θ is the
contact angle between the tip and conditioner, F is the load applied, F
a
is the adhesive force
acting on the tip which is the sum of van der Waals force F
vdw
and the meniscus force F
m
,
Δz is the indention on the hair surface under the applied load F and the adhesive force F
a
,
and E is the Young’s modulus of the sample
if kept in a humid environment. It was determined from unpublished results that if
the wethair was exposedto theambientenvironmentfor morethan 20minuteswhile
in the AFM, the hair became dry and coefficient of friction became similar to that of
dry hair. Thus, coefficient of friction measurements were made within a 20 minute
time frame for each sample.
In order to simulate scratching that can occur on the surface of the hair and its
effect on the friction force on the cuticle surface, a durability test was conducted
using a stiff silicon tip (spring constant of 40 N/m). A load of 10µN was used on
a2µm section of the cuticle. A total of 1000 cycles were performed at 2 Hz. Meas-
urements were conducted using an AFM. Friction force signal was recorded with
respect to cycling time.
Conditioner Thickness
The measurements were made using the AFM with FESP (force modulation etched
Si probe) tips (100nm radius, spring constant of 5 N/m), and using the force cali-
bration plot technique (“force-volume mode” of the nanoscope software). Typical
FESP tip radius is 5–20nm, but blunt tips were preferred in the study so that when
the tip compresses on the surface, the surface tends to deform elastically instead
of being indented (plastically deformed). Then the Hertz analysis can be applied to
calculate the effective Young’s modulus. Figure 24.11 shows a schematic diagram
of the AFM, and an enlarged cross-sectional view of the AFM tip, conditioner and
hair surface is shown in Fig. 24.20.
The force calibration plot provides the deflection of the cantilever as a function
of the piezo position at a distinct point on the sample surface. Figure 24.21 shows

1360 B. Bhushan, C. LaTorre
a typical force calibration plot curve for commercial conditioner treated hair. From
this plot, the conditioner thickness and adhesive force can be extracted. The snap-in
distance is proportionalto the real film thickness (see further details in Sect. 24.7.1),
and the adhesive force F
a
(on retract curve), which is the force needed to pull the
sample away from the tip and is the sum of van der Waals force F
vdw
mediated by
adsorbed water or conditioner layer and the meniscus force F
m
due to Laplace pres-
sure (F
a
= F
vdw
+ F
m
), can be calculated from the force calibration plot by multi-
plying the spring constant with the horizontaldistance between point A and point D
in Fig. 24.19. The meniscus force F
m
is given by
F
m
= 2πRγ(1+ cosθ) , (24.1)
where R is the tip radius, γ is the surface tension of the conditioner, and θ is the
contact angle between the tip and conditioner.
One limitation with the Young’s modulus measurements using nanoindenter is
that it requires loads greater than 1 µN to make accurate measurements. Force cali-
bration plot has been applied to obtain a quantitative measure of the elasticity of
compliant samples with an effective Young’s modulus as high as a few GPa [13,27].
A knowledge of the adhesive forces is necessary for accurate quantitative measure-
ment of the effective Young’s modulus. In these measurements, the applied load is
much greater than the measured adhesive force so that uncertainties in the adhe-
sive force do not significantly affect the measurements. The Young’smodulus of the
sample can be determined using Hertz analysis
F + F
a
=
4
3
√
REΔz
3/2
, (24.2)
where R is the tip radius, F + F
a
is the total force acting on the surface on approach
curve which is calculated by multiplying the spring constant with the vertical dis-
tance between point C and a point on the line during loading in Fig. 24.19, Δz is the
indention on the hair surface and E is the Young’s modulus of the sample. The total
force acting on the surfaceand the resulting deformation (indentation)of the sample
Δz can be extracted from the force calibration plot. Additional details are provided
in Sect. 24.7.2.
Consequently, by taking a force calibration plot at discrete sampling intervals
over an entire scan area, conditionerthickness, adhesive force and effective Young’s
modulus mapping can be created to display the distribution and variation over the
surface. In this work, the force curves were collected at the same maximum can-
tilever deflection (relative trigger mode), at each point at 64×64 array (total 4096
measurement points) with each force curve sampled at 64 points over a scan area
of 2×2 µm
2
for all hair samples. A custom program coded in Matlab was used to
calculate and display conditioner thickness, adhesive force and Young’s modulus
maps.

24 Structural, Nanomechanical, and Nanotribological Characterization 1361
Separation between sample and tip ( )nm
60
–100
200
Force (nN)
Expanded scale
H
0
–50
0
50
100
150
10 20 30 40 50
Virgin hair Snap in
Treated hair
Separation between sample and tip ( )nm
160
–100
200
Force (nN)
H
0
–50
0
50
100
150
20 40 60 80 100
Virgin hair
Tip
Treated hair
Forces between the tip and hair surface
140120
H
Conditioner
Hair surface
h
Fig. 24.21. A typical force
calibration plot for commer-
cial conditioner treated hair
and schematic diagram of the
AFM tip, conditioner and hair
surface
24.3.2 Hair and Skin Samples
For the research reported in this chapter, all hair samples were prepared per Ap-
pendix A. Samples arrived as hair swatches approximately 0.3 m long. Although
the exact location from the root is unknown, it is estimated that hair samples used
for testing were between 0.1 to 0.2m from the scalp. Table 24.10 presents a list
of all samples used. The main hair categories of interest are: virgin (untreated), vir-

1362 B. Bhushan, C. LaTorre
Table 24.10. Hair and skin samples
Hair and Skin Samples
Sample Type
Caucasian hair – Virgin
– Virgin, treated (1 cycle commercial conditioner)
– Chemo-mechanically damaged
– Chemically damaged
– Chemically damaged, treated (1 cycle commercial
conditioner)
– Chemically damaged, treated (3 cycles commercial
conditioner)
– Chemically damaged, treated (PDMS blend silicone
or amino silicone)
– Mechanically damaged
Asian hair – Virgin
– Virgin, treated (1 cycle commercial conditioner)
– Chemo-mechanically damaged
African hair – Virgin
– Virgin, treated (1 cycle commercial conditioner)
– Chemo-mechanically damaged
Synthetic materials – Artificial collagen film (hair)
– Polyurethane film (skin)
– Human skin (putty replica)
gin (treated with 1 cycle of commercial conditioner), chemo-mechanicallydamaged
(untreated), chemically damaged (untreated), mechanically damaged (untreated),
and chemo-mechanicallyor chemically damaged (treated with 1 or 3 cycles of com-
mercial conditioner or experimental conditioners). Virgin samples are considered
to be baseline specimens and are defined as having an intact cuticle and absence of
chemical damage.Chemo-mechanicallydamaged hair fibers were exposed to one or
morecycles of coloringand permanentwavetreatment,washing,and drying,as well
as combing (to contribute mechanical damage) which are representative of common
hair management and alteration. Chemically damaged hair fibers were not exposed
to the combing sequence in their preparation. In the case of African damaged hair
samples, chemical damage occurred only by chemical straightening. Mechanically
damagedhairfibers wereexposedto combingsequenceto cause mechanicaldamage
and were observed under an optical microscope at 100× to have mechanical dam-
age. All treated hair samples were treated with either one or three rinse/wash cycles
of a conditioner similar to a Procter & Gamble commercial product (with PDMS
blend silicone), or were treated with two combinations of silicone types (PDMS,
blend of low and high molecular weight silicone, or an amino silicone).
Collagen film is typically used as a synthetic hair material for testing purposes.
Polyurethane films represent synthetic human skin. They are cast from human skin
24 Structural, Nanomechanical, and Nanotribological Characterization 1363
and have a similar surface energy, which also makes them suitable test specimens
when real skin cannot be used. To characterize surface roughness of human skin,
it was also replicated using a two-part silicone elastomer putty (DMR-503 Repli-
cation Putty, Dynamold, Inc., Fort Worth, Texas). The thickness of the film was
approximately 3mm.
In order to simulate hair conditioner-skin contact in AFM experiments, it is im-
portant to have contact angle and surface energy of an AFM tip close to that of
skin. Table 24.11 shows the contact angles and surface energies of materials impor-
tant to the nanocharacterizationof the hair samples: Untreated, damaged and treated
human hair; PDMS, which is used in conditioners; skin, which comes into contact
with hair; and Si
3
N
4
and Si AFM tips used for nanotribologicalmeasurements. The
dynamic contact angle of various human hair reports in Table 24.11 were measured
by Lodge and Bhushan [53] using the Wilhelmy balance method. This method uses
a microbalance to measure the force exerted on a single fiber when it is immersed
into the wetting liquid of interest (deionized water). This measured force is related
to the wetting force of the liquid on the fiber, and the dynamic contact angle can
be calculated. They reported a significant directionality dependence. The values re-
ported here compare well with other values reported in the literature [48, 61]. The
data reported for PDMS (bulk) and live skin in-situ were obtained using the stan-
dard sessile-drops method using a contact angle goniometer [12,35,49,71]. In the
measurementtechnique developedby Ta o and Bhushan[85,86]for dynamiccontact
angle of the AFM, by tips advancingand receding the AFM tip across the water sur-
face, the meniscusforce between the tip and the liquid was measuredat the tip-water
separation. The water contact angle was determined from the meniscus force.
24.4 Structural Characterization Using an AFM
A schematicdiagram in Fig. 24.2aprovidesan overallviewof variouscellular struc-
ture of humanhair. Human hair is a complextissue consistingof severalmorpholog-
ical components,and each componentconsists of severaldifferent chemical species.
Table 24.2 presented earlier summarizes the main chemical species present in hu-
man hair.
Traditionally, most cellular structure characterizations of human hair or wool
fiber were done usingSEM and TEM. Morerecently,the cellular structure of human
hair has been characterized using AFM and TR mode II (described earlier) [13,26].
In Sect. 24.4.1, structure of hair cross-section and longitudinal section is presented;
and in Sect. 24.4.2, structure of various cuticle layers of human hair is presented.
24.4.1 Structure of Hair Cross-section & Longitudinal Section
Cross-section of Hair
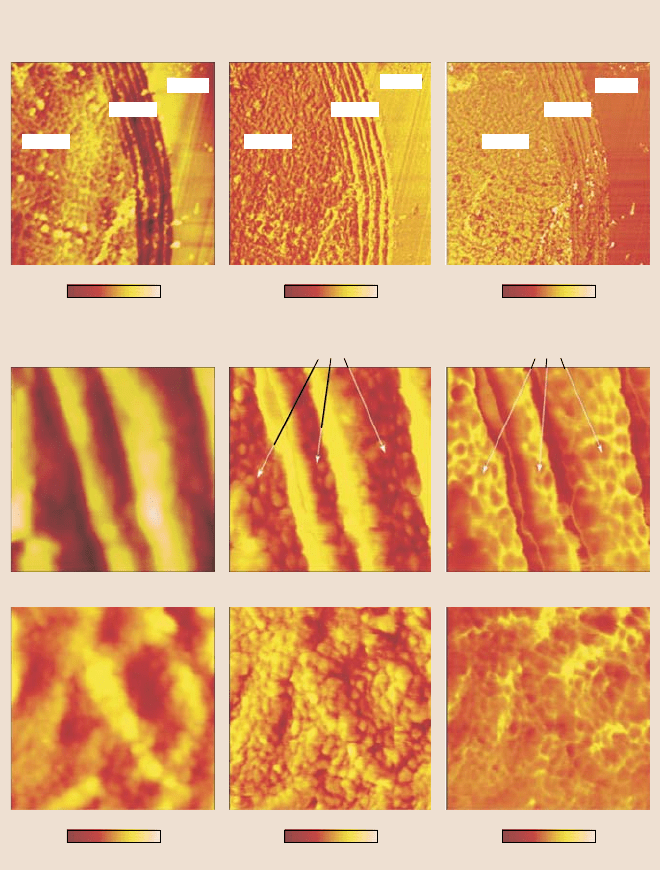
Figure 24.22a shows the AFM images of Caucasian hair cross-section. The hair
fiber embedding in epoxy resin can be easily seen. From TR amplitude image and

1364 B. Bhushan, C. LaTorre
Table 24.11. Contact angle and surface energy of hair and relevant materials associated with
nanotribological characterization of hair
Contact angle (°) Surface energy
(N/m)
Dry Soaked
Virgin Caucasian hair
Virgin treated
Chemically damaged
Chemically damaged, treated
Mechanically Damaged
Asian
African
103
a
88
a
70
a
79
a
95
a
92
a
80
a
98
a
92
a
70
a
84
a
0.028
b
PDMS (bulk) 105
c
0.020
d
Humanskin–forehead
– forearm
– finger
55
e
88
e
84
f
74
f
104
g
(after soap-
washing)
58
g
(before shop
washing)
0.043
e
0.038
e
0.029
f
0.024
f
0.027
g
Si
3
N
4
tip 48
h
0.047
i
Si tip 51
j
a
[54];
b
[48];
c
[12];
d
[42];
e
[49];
f
[71];
g
[35];
h
[85];
i
[94];
j
[86]
TR phase image, the cortex region, the cuticle region and epoxy resin region are
easily identified. In the cuticle region, 5 layers of cuticle cells are seen, and the total
thickness of the cuticle region is about 2µm for this sample. In the detailed images
of the cuticle region, 3 layers of cuticle cells are shown, and various sublamellar
structure of the cuticle can be seen. The thickness of the cuticle cell varies from
200 to 500nm. Cortex region shows very fine circular structure of size about 50 nm,
which represents the transverse face of the macrofibril and matrix. At this scale, no
intermediate filament structure can be revealed.
Longitudinal Section of Hair
Figure 24.22b shows the AFM images of longitudinal section of virgin Caucasian
hair. Different regions(cortex region,the cuticleregion and embeddingepoxy resin)
are easily seen. As shown in the detailed image of the cuticle region, various sub-
lamellar structure of the cuticle, the A-layer, the exocuticle, the endocuticle and the
cell membrane complex, which cannot be easily revealed in TR surface height im-
age, are easily resolved in TR amplitude image and TR phase image because of
different contrast. Most sublamellar structure features of the cuticle shown in the
24 Structural, Nanomechanical, and Nanotribological Characterization 1365
Cuticle
TR surface height
10 mμ
Cross-section of virgin Caucasian hair
(TR amplitude in air = 1 V, deflection = 25 nm)
TR amplitude TR phase angle
Cuticle
Cortex
Cuticle
Epoxy
Cortex
Cuticle
Epoxy
Cortex
Cuticle
Epoxy
010mμ010mμ0
0 100 nm
0 60°0 0.3 V
Culticle region
Cortex region
1mμ01mμ01mμ0
0 40 nm 0 60°0 0.3 V
Fig. 24.22. (a) Cross-section images of virgin Caucasian hair and fine detailed images of the
cuticle region and cortex region
