Bhushan B. Nanotribology and Nanomechanics: An Introduction
Подождите немного. Документ загружается.


1346 B. Bhushan, C. LaTorre
Table 24.8. Comparison of methods used to characterize hair on micro/nanoscale
Method Type of
information
Quantitative data Normal load Resolution
(nm)
Limitations
Scanning
electron
microscopy
(SEM)
Structural Gross dimensions None 0.2–1 (spatial) – Requires thin conductive
coating on sample
– Requires vacuum
environment
– Expensive instrumentation
a
– Tedious
a
Transmission
electron
microscopy
(TEM)
Structural Gross dimensions None 0.2–1 (spatial) – Requires thin sections
(< 100nm) and heavy metal
compound staining treatment
– Requires vacuum
environment
– Expensive instrumentation
a
– Tedious
a
Atomic
force/friction
force
microscopy
(AFM/FFM)
Structural
Mechanical
Tribological
– Surface roughness
– Elastic modulus
– Viscoelasticity
– Friction
– Adhesion
– Conditioner
thickness
< 0.1nN–500nN
a
0.2–1 (spatial)
a
0.02 (vertical)
a
None
Nanoindenter Mechanical – Hardness
– Elastic modulus
– Creep
– Scratch resistance
< 0.1mN–350mN 400 (spatial)
b
0.1 (vertical)
b
None
a
[9];
b
[18]
24 Structural, Nanomechanical, and Nanotribological Characterization 1347
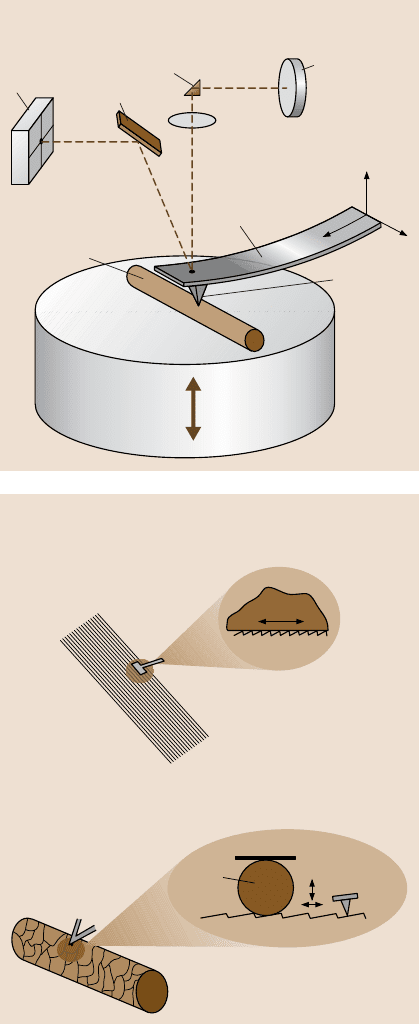
Photo diode
Mirror
Prism
Focusing lens
Laser diode
Cantilever
Hair
Tip
Schematic diagram of AFM
y
Piezo
z
x
y
Fig. 24.11. Schematic dia-
gram of AFM operation with
human hair sample
Hair fiber
AFM (Micro/nanoscale)
SiO ball
2
(R=4 m)μ
Macroscale test apparatus
Friction test apparatuses at macro- and micro/nanoscales
AFM
cantilever
Microscale
Nanoscale
Si N tip
( = 30 nm)
34
R
Hair cuticle
Hair
Cantilever
and block
Hair
swatch
Block
Fig. 24.12. Friction test ap-
paratuses at macro-and mi-
cro/nanoscales
1348 B. Bhushan, C. LaTorre
of ultrathin coatings [8,10,18]. More recently, nanoindentation technique has been
used to investigate nanomechanical properties (such as hardness, Young’s modu-
lus, creep, and scratch resistance) of various cellular layers of glass fibers, keratin
fibers, and hair surface/ cross-section [50,65,89,90]. In-situ tensile loading exper-
iments in the AFM have been carried out to study the progress of deformation and
morphological changes in the hair fiber [74].
24.3.1 Experimental Procedure
Structural Characterization Using an AFM
An AFM (Multimode Nanoscope IIIa, DI-Veeco, Santa Barbara, CA) with modifi-
cations for the TR mode and a nanoscope extender electronic circuit for the meas-
urement of the phase angle were used in the study reported in the chapter [13,26].
All measurements are conducted in ambient conditions (22±1
◦
C, 50±5% relative
humidity).The probes used in this study were single beam etched Si probes (Mikro-
Masch) with a fundamental flexural mode frequency of 75kHz and a fundamental
torsional resonance frequencyof 835kHz with a quality factoraround 1000. The di-
mension of the cantilever is typically 230µm×40µm×3 µm with a flexural spring
constant of 1–5N/m and a torsional spring constant estimated to be 30–150N/m.
The radius of curvature of the tip is about 10nm. Surface height images shown in
this study were processed using first order planefit command available in the AFM
software, which eliminates tilt in the image. Amplitude and phase angle images
were processed using zero-orderflatten command, which only modifies the offset of
the image.
The schematic diagram of a tip-cantilever assembly in an AFM is shown in
Fig. 24.13. The cantilever can scan a sample with its tip in constant contact, inter-
mittent contact, or without contact with the sample surface [7–10]. The scanning
is implemented by the motion of a cylindrical piezoelectric tube, which can act as
the holder of either the cantilever or the sample. The deflection of the cantilever is
generally measured using an optical lever method. A laser beam is projected on and
reflected from a location on the upper surface of the cantilever close to the tip and
led by a mirror into a four-segment photodiode. The normal and lateral deflections
of the cantilever at that location can then be obtained by calibrating the voltage
output of the photo diode. AFM measurements can be performed with one of the
several modes: tapping mode I, torsional resonance mode (TR mode) [44], and con-
tact mode, as shown in Fig. 24.13. The phase angle is also defined in Fig. 24.13
as a phase delay between input/output strain and/or stress profiles. Table 24.9 sum-
marizes the characteristics of tapping mode, torsional resonance modes and contact
mode [26]. The contact mode is static mode and uses a nonvibrating tip, therefore
a phase analysis is not available.
The TR mode measures surface height and phase angle (and amplitude) images
as follows.The tipis vibratedin the torsionalmodeat the resonancefrequencyof the
cantileverbeam in air driven by a specially designed cantilever holder. The torsional
vibration amplitude of the tip (TR amplitude) is detected by the lateral segments of
24 Structural, Nanomechanical, and Nanotribological Characterization 1349
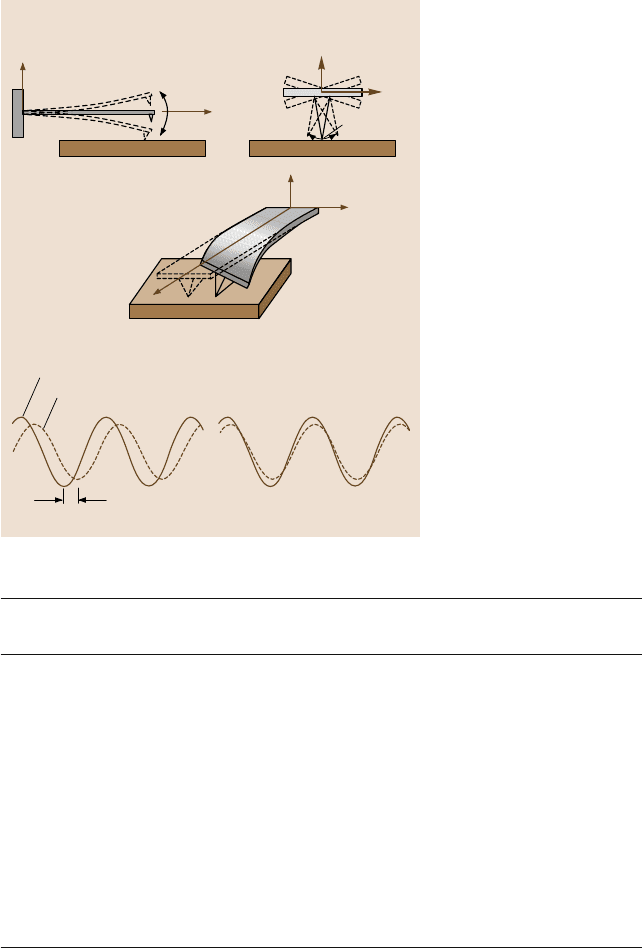
Tapping mode
Three different AFM operating modes
~10-100 nm
Torsional resonance mode
~0.3-2.0 nm
z
x
z
y
z
y
x
Contact mode
Phase angle definition
Cantilever response in free air
Viscoelastic material
Phase angle
Cantilever response during engagement
Nearly elastic material
Fig. 24.13. Three different
AFM settings are compared
at the top: tapping mode
(TM), torsional resonance
(TR) mode and contact mode.
The TR mode is a dynamic
approach with a laterally
vibrating cantilever tip that
can interact with the surface
more intensively than tap-
ping mode; therefore, more
detailed near surface informa-
tion is available. Phase angle
is defined and two examples
of the phase angle response
are shown at the bottom: one
is for materials exhibiting vis-
coelastic properties (left)and
the other nearly elastic (right)
Table 24.9. Summary of various operating modes of AFM for surface imaging
Operating
modes
Direction of
cantilever vibration
Parameter
controlled
Data obtained
Tapping Vertical Setpoint
(Constant amplitude)
Surface height,
phase angle
(normal viscoelasticity)
TR mode I Torsional (lateral) Setpoint
(Constant amplitude)
Surface height,
phase angle
(lateral viscoelasticity)
TR mode II Torsional (lateral) Constant load Surface height,
amplitude
and phase angle
(lateral stiffness
and viscoelasticity)
Contact n/a Constant load Surface height, friction
1350 B. Bhushan, C. LaTorre
the photodiode. A feedback loop system coupled to a piezo-electric scanning stage
is used to control the vertical z position of the sample, which changes the degree of
in-plane(lateral) tip-sampleinteraction of interest.The z displacement of the sample
gives a surface height image of the sample. There are two possible operating modes
depending on which parameter is controlled (see Table 24.9):
1. TR mode I: constant TR amplitude;
2. TR mode II: constant normal cantilever deflection (constant load).
Both modes are operated at the resonance frequency of cantilever in air, which is
different from the TR friction mode used in previous study [17] in which the tip is
vibrated at the resonance frequency of the cantilever after engagement. During the
measurement, the cantilever/tip assembly is first vibrated at its resonance at some
amplitude before the tip engages the sample. Then, for TR mode I, the tip engages
the sample at some setpoint which is reported as a ratio of the vibration amplitude
after engagement to the vibration amplitude in free air before the engagement [19,
44, 73]. For TR mode II, instead of keeping constant setpoint, a constant normal
load measured using vertical segments of the photodiode is applied. Under in-plane
tip-sample interaction, torsional resonance frequency, amplitude and phase of the
cantilever all change from those when it is far away from the sample surface and
could be used for contrasting and imaging of in-plane lateral surface properties.
Compared to TM and TR mode I, the AFM tip interacts with the surface more
intensively in TR mode II, therefore, more detailed in-plane surface information can
be obtained [26]. By using TR mode II, TR amplitude and TR phase angle images
show even larger contrast. Previous studies [19,44,73] indicated that the phase shift
can be related to the energydissipationthrough the viscoelastic deformationprocess
between the tip and the sample. Recent theoretical analysis [76] has established
a quantitative correlation between the lateral surface properties (lateral stiffness and
viscoelasticity) of materials and amplitude/phase angle shift in TR measurements.
The contrast in the TR amplitude and phase angle images is due to the in-plane
(lateral) heterogeneity of the surface. Based on the TR amplitude and phase angle
images, the lateral surface properties (lateral stiffness and viscoelasticity) mapping
of materials can be obtained. In the work presented in the chapter, TR mode II
amplitude and phase images were obtained to characterize the cellular structure of
human hair. For convenience,TR amplitude is recorded in volt, and 1V corresponds
to about 0.5 nm TR amplitude.
Surface Potential Studies Using AFM Based Kelvin Probe Microscopy
All measurements were taken with a MultiMode atomic force microscope equipped
with ExtenderElectronics modules. The Extenderallowsfor surfacepotential meas-
urements to be taken. Surface potential measurement is conducted using a two pass
method [15, 16,31, 55,56]. In the first pass, surface topography is measured using
the standard AFM tapping mode, Fig. 24.14a. In the second pass, the tip is scanned
over the previously measured topography at a specified distance above the surface
(for example, 30nm), Fig. 24.14b. The piezo normally oscillating the tip in tapping
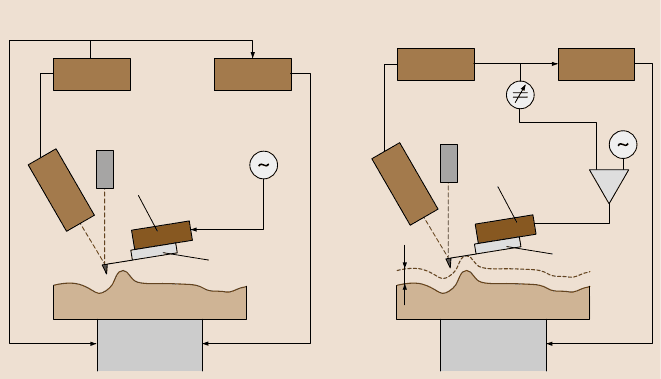
24 Structural, Nanomechanical, and Nanotribological Characterization 1351
mode is turned off. Instead an oscillating voltage is applied directly to the conduct-
ing tip which generates an oscillating electrostatic force. To measure the surface
potential, a dc voltage is applied to the tip until the voltage difference between the
tip and sample is equalto zero, giving zero oscillating force amplitude. The conduc-
tive tip, a silicon tip coated with platinum/iridium, is used.
Hairsamplesweremounted intwo differentways.When mountedin silverpaint,
there exists a direct path from the sample to ground. When mounted in liquid paper,
the sample is electrically isolated from ground.
Nanomechanical Characterization Using Nanoindentation
Nanoindentation
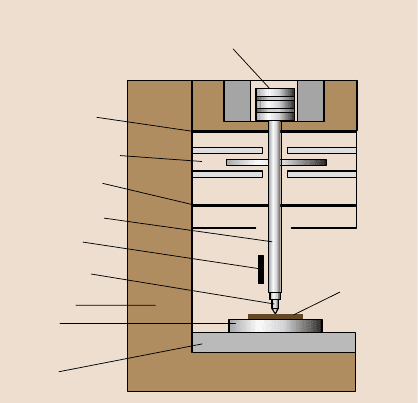
Figure 24.15 shows the schematic of performing nanoindentation and nanoscratch
test on human hair surface with a Nano Indenter II
(MTS Systems Corp.). This
instrument monitors and records the dynamic load and displacement of the indenter
during indentation with a force resolution of about 75nN and displacement resolu-
tion of about 0.1nm [8,10,18].
For hardness, Young’s modulus and creep measurement, a three-sided (triangu-
lar-based) pyramidal diamond Berkovich indenter tip (radius 100 to 200nm) was
used [89,90]. For nanoindentationon all the virgin hair surface except African hair,
a wide load range (0.1–300mN) was used,in order to study the mechanicalproperty
variation of hair surface depending on the indentation depth. In the case of virgin
African hair, the load of 300mN was not used because the hair was too soft to get
reasonable data at 300 mN. For the damaged, treated hair and the hair near scalp,
Feedback
Computer
Photo-
detector
Laser
Cantilever
piezo
Cantilever
substrate
Sample
Z-control X-Y-control
X-Y-Z-piezo
Kelvin probe microscopy schematic
a) b)
Feedback Computer
Laser
Cantilever
piezo
Cantilever
substrate
Sample
X-Y-control
X-Y-Z-piezo
Sum
Lift scan
height
Photo-
detector
Fig. 24.14. (a) Schematic of first pass of Kelvin probe technique measuring surface height;
(b) schematic of second pass of Kelvin probe technique measuring surface potential [15,16]
1352 B. Bhushan, C. LaTorre
Indenter
support springs
Load application coil/magnet
Hair sample
Capacitive
displacement gauge
Indenter support
springs
Indenter column
Indentation or
scratch tip
Lateral
motion stage
Lateral force
probe
Load frame
Schematic of nanoindentation and nanoscratch test on hair
Si wafer
Fig. 24.15. Schematic of
nanoindentation and nano-
scratchtestonhairusing
nanoindenter
in the middle and near tip, 0.1, 1.0, 10, 100 mN normal loads were used. At each
load, five indents were made, and the hardness and elastic modulus values were av-
eraged from them and the standard deviations were calculated. For nanoindentation
on virgin hair cross section samples, only one normal load, 1.0 mN, was used to
make indents at cuticle, cortex and medulla. To do the creep test, a normal load was
applied, and then the tip was held for 600s. The displacements change during the
holding time were recorded. The loads used were 0.1, 1.0 and 10mN.
Nanoscratch
For coefficient of friction and scratch resistance measurement, a conical diamond
tip, having a tip radius of about 1µm and an included angle of 60°, was used. Be-
fore scratching, the hair sample holder was manually rotated so that the hair axis is
parallel to the scratch direction.
The scratch tests were performed on both the single cuticle cell and multiple
cuticle cells of each hair sample, by controlling the scratch lengths to be 5 µmat
a maximum load of 1 mN and 50 µm at a maximum load of 10mN, respectively.
Each scratch test was repeated at least five times on the same hair to verify the
data reproducibility. For the 50µm long scratch test, two scratch directions were
used to study the directionality effect of the cuticle. One scratch direction was along
cuticle and the other was against cuticle. The coefficient of friction was monitored
during scratching. In order to obtain scratch depths during scratching, the surface
profile of the human hair was first obtained by translating the sample at low load
of about 0.01mN, which is insufficient to damage the hair surface. The 5 µmand
50µm long scratches were then made by translating the hair sample at a constant tip
velocity of 0.5µm/s while ramping the loads from 0.01 to 1mN, and from 0.01 to
10mN, respectively. The actualdepth during scratchingwas obtained by subtracting
24 Structural, Nanomechanical, and Nanotribological Characterization 1353
the initial profile from the scratch depth measured during scratching. In order to
measure the residual depth after scratch, the scratched surface was profiled at a low
load of 0.01mN and was subtractedfrom the surface profilebefore scratching. After
nanoscratch tests, the scratch wear tracks of the hair samples were measured using
a Philips XL-30 ESEM.
In order to study the effect of soaking on hair nanotribologicaland nanomechan-
ical properties, the hair samples were soaked in de-ionized water for 5 min, which
is representative of a typical exposure time when showering/bathing. Then the hair
was mounted on Si wafer immediately, and 5 µm and 50µm long scratch tests were
performed on them.
In-situ Tensile Deformation CharacterizationUsing AFM
In-situ tensile testing of human hair fibers in AFM was conducted using a custom-
built stage used in place of the regular sample holder [22, 23, 74,84]. It consists
of a linear stepper motor which loads a single hair fiber in tension, see Fig. 24.16.
The base plate of this stage attaches to the stepper motor of the AFM base, to en-
able positioning of the stage in X and Y directions with respect to the AFM tip.
During scanning, the sample is held stationery while the cantilever tip mounted on
a X-Y-Z piezo, moves back and forth. The hair sample is firmly clamped in be-
tween two sliders to prevent slipping on load application. Stage motion is achieved
by a left-right combination lead screw that keeps the sample at approximately the
same position with respect to the scanning tip. This helps in locating approximately
the same control area after each loading increment is applied. With every load in-
crement, there is an increase in the hair length and hence a shift in the location of
the control area for the previous position. To locate the same control area in hair,
a mark was made on the hair fiber with a nail polish. Because of its reflectivenature,
it shows up clearly in the AFM optical microscope. A 40 TPI pitch lead screw in
combination with 400 steps per revolution stepper motor (model PX245-01AA, us-
ing the controller NF-90, both from Velmex Inc) gives a minimum displacement of
1.6 µm. For a sample length of 38 mm (1.5in),this correspondsto a minimum strain
increment of 8.33×10
−3
%. The strain applied was obtained from the total number
of steps through which the stepper motor was rotated. The maximum travel was 10
mm. A beam-type strain gauge force sensor (model LCL-010, Omega Engineering,
Stamford, CT), with a resolution of 10 mN, was used for measuring stress in the hair
samples. The stiffness of the force sensor (18 kN/m) is very high compared to the
sample stiffness.
To minimize airborne vibrations during AFM imaging, the hair sample was
supported with a smooth aluminum block support having a radius of curvature of
25.4mm, as shown in Fig. 24.16.
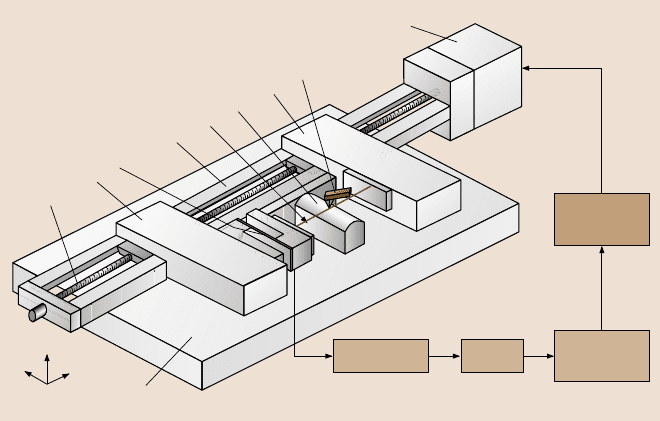
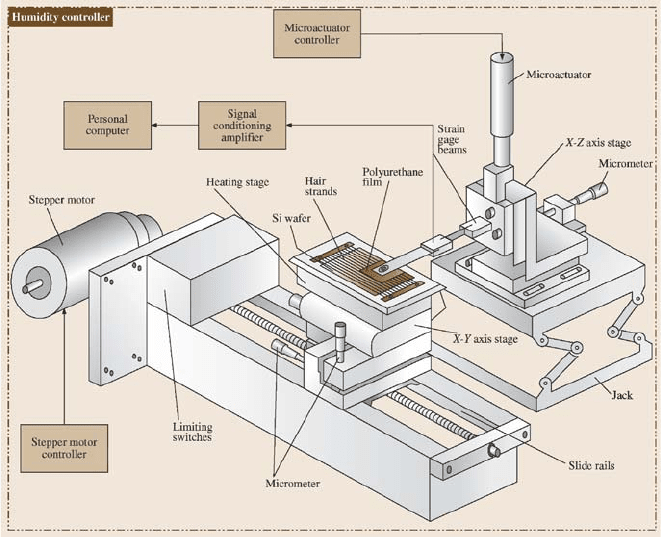
Macroscale Tribological Characterization Using a Friction Test Apparatus
The macroscale tribological (friction and wear) characterization of human hair
were conducted using a flat-on-flat tribometer under reciprocating motion [7,9,10]
1354 B. Bhushan, C. LaTorre
Left-right
lead srew
Signal
conditioner
Slider
Stepper
motor
controller
A/D
Board
Base
plate
z
y
x
Force sensor
Stage
Sample
Support
Slider
Stepper motor
PC
AFM tip
Fig. 24.16. Schematic diagram of the setup used to conduct in-situ tensile testing of human
hair in AFM [74]
(Fig. 24.17). A piece of square polyurethane film (film area 25–400mm
2
) was fixed
at the end of a cantilever beam. The hair strands were mounted on Si wafer in such
a way that all strands of hair were separated and parallel to each other. For high
temperature studies, the Si wafer was placed on a heating stage, which can increase
the temperature of the hair sample up to 100°C [10]. The heat-generating elements
of the heating stage were Ohmic resistors encapsulated in a steel holder and kept
in good thermal contact by using thermal paste. J-type thermocouples were used to
measure the sample temperature. A thermal controller and a solid-state relay were
used to control the temperature by adjusting on/off time. A glass plate was attached
at the bottom of the heating stage to isolate it thermally from the X-Y axis stage,
where the heating stage was mounted. The X-Y axis stage is a motor-driven lead-
screw-type stage driven by a stepper motor. The load on the polyurethane film was
appliedby lowering the beam against the hair sample using a microactuator.Normal
and frictional forceswere measured with semiconductorstrain gage beams mounted
on a crossed-I-beam structure as part of the cantilever beam mentioned earlier and
data were digitized and collected on a personal computer. The effect of relative hu-
midity on the hair friction was studied in an environmentally controlled chamber,in
which humidity was controlled by introducing the combination of dry air and moist
air.
In orderto select relevantload, velocity,and film area, one needs to be guided by
the application. For a feel with a finger with the hair, the normal load applied by the
finger was estimated as 50–100mN, measured by pressing the finger on a microbal-
ance. The estimated apparent contact size and stroke length were 10–100mm
2
,and
24 Structural, Nanomechanical, and Nanotribological Characterization 1355
Fig. 24.17. Schematic of the reciprocating tribometer. Normal load is applied by lowering
the X-Z stage mounted on a laboratory jack. Normal and friction forces are measured by
semiconductor strain gages mounted on a crossed-I-beam structure [10]
5–20mm, respectively. The sliding velocity was estimated as 5–20mm/s. To per-
form a parametric study, tests were performed at a range of operating conditions in
the range of interest for the application at a temperature of 22±1
◦
C and 50 ±5%
RH. The following test conditions were used: stroke length, 3 mm; sliding velocity,
0.4–4.5mm/s; normal load, 50–100mN; film size, 25–400mm
2
. For the friction
studies of polyurethane film vs. various hair, hair vs. hair, and polyurethane film
vs. virgin and treated hair at dry and wet conditions, the following nominal test
conditions were chosen: sliding velocity, 1.4mm/s; normal load, 50 mN; and film
area, 100mm
2
. To simulate the wet conditions, plumber’s putty was placed around
the stage and the hair region was filled with water. For the wear measurements, the
polyurethane film rubbed against the virgin and treated Caucasian hair for 24 hours
at the above nominal conditions and the coefficient of friction was measured. The
hair surfacewas studied by opticalmicroscopeprior to and after wear tests. To study
the effect of temperature and humidity on hair friction, the tests were conducted at
the nominal test conditions and the followings parameters were used: temperature,
22–80°C; and relative humidity, 35–85%.