ASM Metals HandBook Vol. 17 - Nondestructive Evaluation and Quality Control
Подождите немного. Документ загружается.


151
13.
K.K. Liang, G.S. Kino, and B.T. Khuri-Yakub, Material Characterization by the Inversion of V(z),
Trans.
IEEE, Vol SU-32, 1985, p 213-224
14.
R.D. Weglein, Acoustic Micro-Metrology, Trans. IEEE, Vol SU-32, 1985, p 225-234
15.
J. Kushibiki and N. Chubachi, Material Characterization by Line-Focus-Beam Acoustic Microscope,
Trans.
IEEE, Vol SU-32, 1985, p 189-212
Acoustic Microscopy
Lawrence W. Kessler, Sonoscan, Inc.
Acoustic Microscopy Applications
*
It is difficult to document concisely the very broad range of applications for acoustic microscopy, but a few
generalizations can be made that follow the examples of conventional ultrasonic nondestructive testing (see the articles
"Ultrasonic Inspection" and "Adhesive-Bonded Joints" in this Volume). Acoustic microscopy is compatible with most
metals, ceramics, glasses, polymers, and composites (made from combinations of the above materials). The compatibility
of a material is ultimately limited by ultrasound attenuation caused by scattering, absorption, or internal reflection. In
metals, the grain structure causes scattering losses; and in ceramics, the porosity may cause losses. The magnitude of
these effects generally increases with ultrasound frequency, and the dependence is monotonic.
Figure 9 shows a general guide to acoustic microscopy applications with respect to imaging. The quantitative aspects
have not yet found widespread industrial acceptance, although they are extremely important and form the basis for
materials characterization. The techniques of SLAM, C-SAM, and SAM all produce quantitative data in addition to
images. Acoustic microscopy methods are compared below with a typical C-scan ultrasound method in terms of
frequency employed:
Method
Frequency range, MHz
C-scan ultrasound
1-10
Acoustic microscopy
C-SAM
10-100
SLAM
10-500
SAM
100-2000
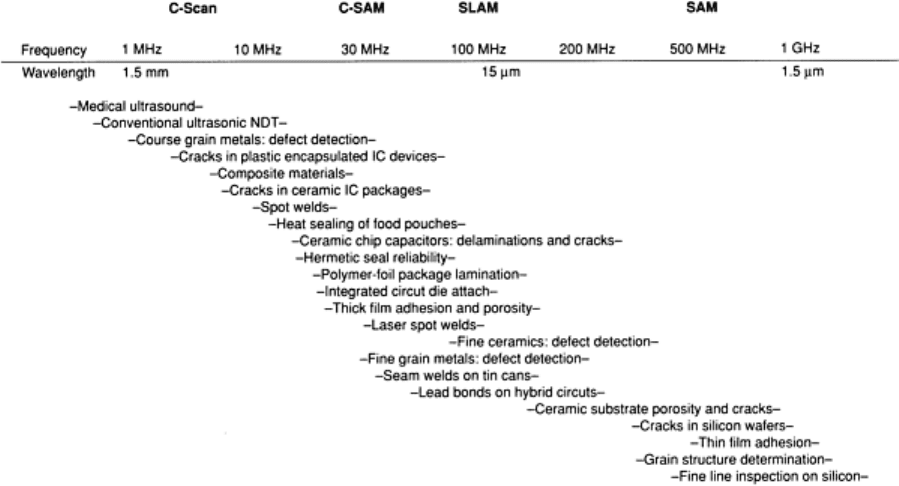
Fig. 9 Comparison of acoustic microscopy applications with C-
scan applications, based on transducer frequency
and wavelength.
The most popular application of SLAM and C-SAM is the nondestructive evaluation of bonding, delamination, and
cracks in materials. These instruments are often used for process and quality control, although a significant percentage of
the devices are placed in analytical and failure analysis laboratories. The most popular application of SAM utilizes its
very high magnification mode and is employed as a counterpart to conventional optical and electron microscopy, that is,
to see fine detail at and near surfaces. The scanning acoustic microscope, like the other acoustic microscopy methods,
produces image contrast, which is a function of the elastic properties of a material, where other nonacoustic techniques
may not.
Composite Materials
Composite materials represent an exciting challenge for the materials scientist and for nondestructive testing. With the
combination of materials having different properties and with manufactured anisotropy, acoustic microscopy can clearly
define the relevant property distribution of materials at the microscopic level. The examples shown in this section are
polymer materials reinforced with fibers. Metal-matrix composites and ceramic-matrix composites can be similarly
studied.
In general, the combinations of materials having different mechanical properties result in interfaces that cause scattering
of ultrasound and differential attenuation within the field-of-view. This can be important in determining the population
density shifts of fibers within a sample.
SLAM Images. Acoustic microscopy can be used to differentiate fibers that are bonded well to the matrix from fibers
that are separated from the matrix. Excessive stress, for example, would cause such a separation. As an example of this,
Fig. 10 shows two nominally identical tensile-test bars made of carbon fiber reinforced plastic (CFRP). One of the bars
has been stressed to a level that produced a 1.5% strain. The other sample has not been stressed. Figures 11(a) and 11(b)
compare SLAM images of these samples at 100 MHz. The lighter image, Fig. 11(a), shows texturing that follows the fiber
direction. Figure 11(b) shows the much darker, attenuating characteristics of the stressed sample. The excess attenuation
is due to the separation of the fiber from the matrix.
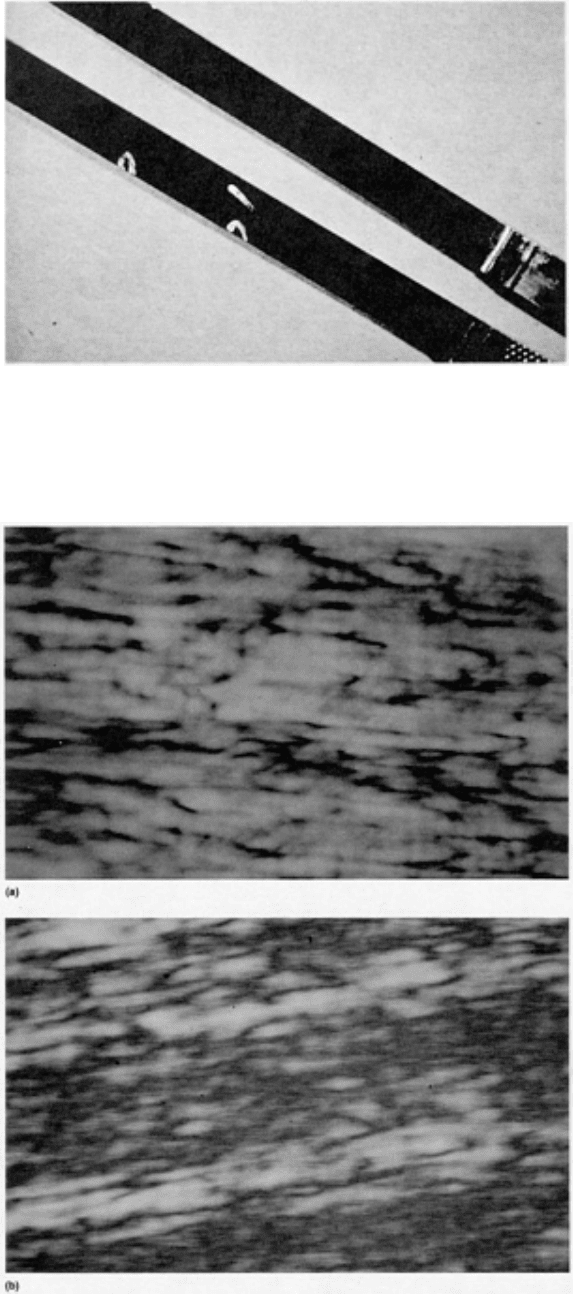
Fig. 10 Photograph of two CFRP tensile-test bars--
one unstressed and one stressed. The stressed bar was
subjected to a force that yielded a 1.5% strain.
Fig. 11 100-MHz SLAM acoustic micrographs of the tensile bar samples shown in Fig. 10
. (a) In the unstressed
bar, the texture corresponds to fiber population shifts and small areas of disbond. (b) In the stressed bar that
was pulled to a 1.5% strain level, there is no visible evidence of fracture. Field of view: both 3 × 2.25 mm.
However, the increased acoustic a
ttenuation (dark zones) present in (b) indicates stress damage to the
material.
Figure 11 in the article "Use of Color for NDE" in this Volume shows a 30-MHz transmission SLAM image of a Kevlar
fiber-reinforced plastic that has been cut perpendicular to the fibers, thus producing extensive delamination (red) and
cracks along the axis of the sample. Defects anywhere throughout the thickness will block the ultrasound transmission.
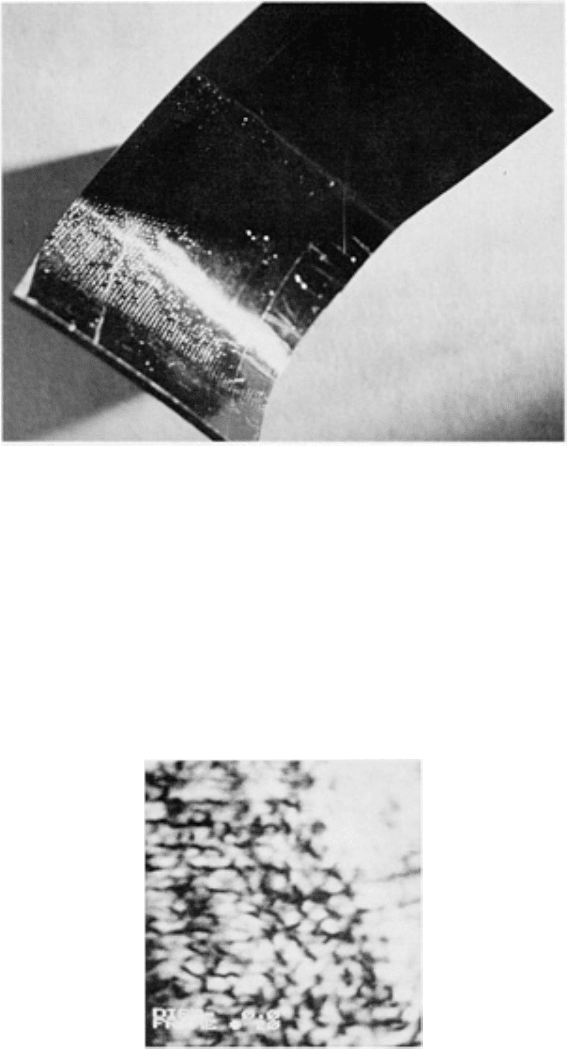
Figure 12 in this article shows a curved CFRP component. This sample is more difficult to image than the tensile-test bars
because it has a complex shape; in addition, it has fibers oriented in a variety of different directions for directional
strength.
Fig. 12 Complex-
shaped CFRP component. The fibers are arranged to impart directional strength to certain
critical areas of the sample.
In Fig. 13, a 30-MHz SLAM transmission image, a transition is seen between different fiber orientations in the sample;
Fig. 14 in the article "Use of Color for NDE" in this Volume shows a large anomaly that is located in the middle of the
curved portion. Scanning laser acoustic microscopy can be used to image complex-shape samples even though the
curvature may cause some restriction of the field-of-view due to critical angle effects and lenslike action by the sample.
Fig. 13 30-MHz SLAM acoustic micrograph of the sample shown in Fig. 12
. The left portion of the micrograph
shows a more complex fiber network than the area on the right. A color image of the curved CFRP component is

shown in Fig. 14 in the article "Use of Color for NDE" in this Volume. Field of view: 14 × 10.5 mm
C-SAM Image. Figure 14 shows a 50-MHz reflection image in the C-SAM image of a CFRP tensile-test bar similar to
that shown in Fig. 10. The acoustic lens is focused near the surface of the sample, and the electronic gate was set to
receive a portion of the backscattered signal. Because the sample is constructed with fibers distributed throughout the
volume, acoustic energy is scattered from all depths, and distinct, time-separated echoes were not generated. When the
transducer was focused deep into the sample, there was less definition of the fibers in the acoustic image, similar to what
is seen in the SLAM image.
Fig. 14 50-MHz C-
SAM reflection mode micrograph of a CFRP test sample. The ultrasound was focused near the
top surface of the sample. Field of view: 19 × 14 mm
Ceramic Materials
Ceramic materials are used in a variety of applications. Some are used in the electronics industry as substrates for delicate
hybrid circuits. In structural applications, ceramics are used where high temperature and light weight are important.
Silicon nitride, silicon carbide, and zirconia are receiving much attention for future engine applications. However,
because of the inherent brittleness of ceramic materials, small defects are very critical to the structural integrity of the
materials. The successful use of these materials necessitates careful nondestructive screening of the samples.
Aluminum Oxide. Figure 15 shows an optical picture of an aluminum oxide panel with laser-machined holes. This
sample is an electronics-grade material that is 99.5% pure and has very low porosity. When the ceramic powder is first
compressed in the green state, opportunities arise for segregated low-density areas to occur. After the sintering operation,
these areas are usually found to be very porous. If one of these areas happens to coincide with the site of laser machining,
the stresses that occur can cause the material to crack. Upon visual examination, it may be very difficult to detect fine
cracks, even if they come to the surface. Dye penetrants can be used to increase the visual contrast. Unfortunately, in
many applications, dyes are considered to be contaminants and therefore cannot be used for nondestructive testing.
Because of the discontinuity in material property, a crack will reflect acoustic waves and produce high-contrast images.
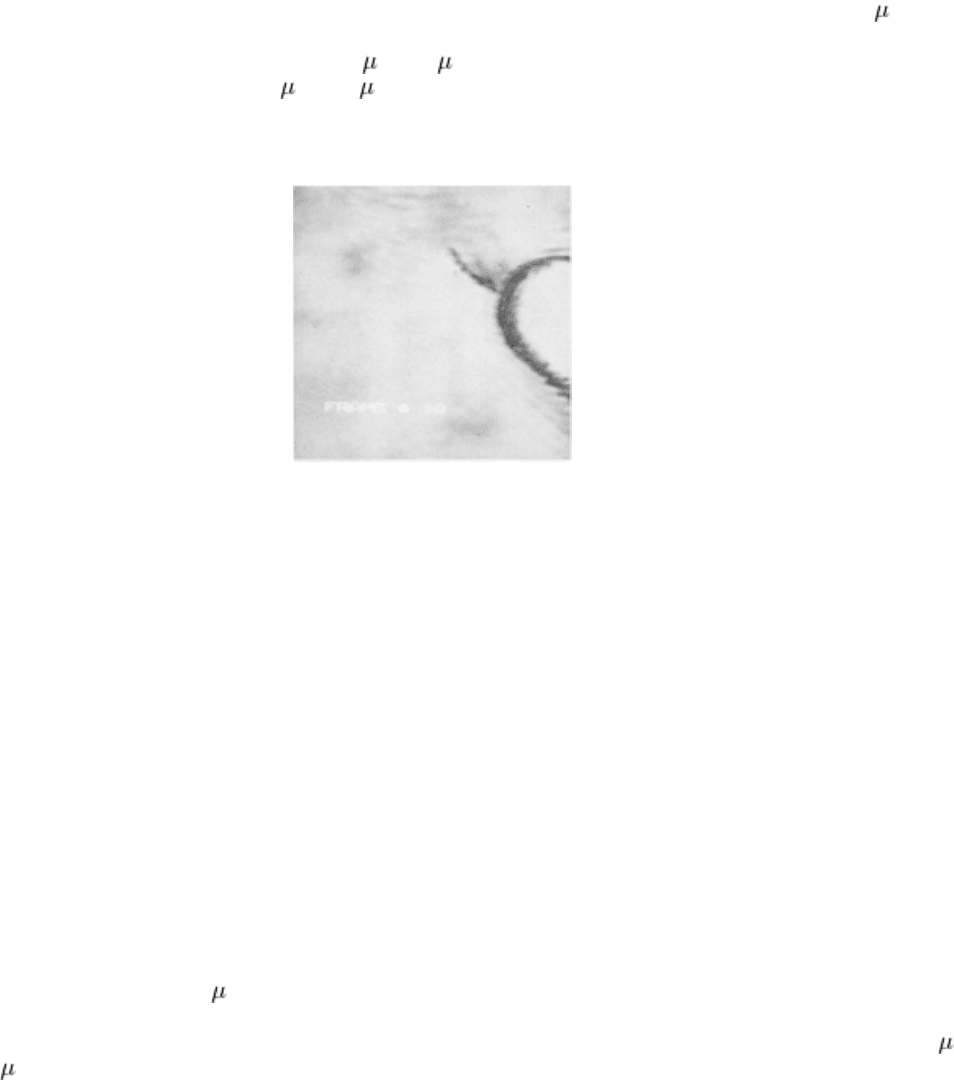
Fig. 15 Aluminum oxide panel having laser-
machined holes and slots with fine cracks around the perimeter and
the circumference of the openings
Figure 16 shows a 100-MHz SLAM acoustic micrograph of a ceramic sample with a crack that can be seen as a dark line
originating from one of the holes. Surrounding the area of the crack are several small, dark patches, which arise from
localized increases in porosity. In the acoustic image, the pores may not be visible individually if they are smaller than the
wavelength of sound. In this case, the pores are only a few microns in size, and the wavelength is about 25 m (0.001
in.). The porous areas are detectable by virtue of excess ultrasound scattering, which causes the differential attenuation.
Correlative analyses have shown that pores in the 1 m (40 in.) size range cause detectable attenuation increases (Fig.
16). However, the presence of a single 1 m (40 in.) pore would be difficult to detect unless the frequency of the
ultrasound was increased to 1 GHz or more.
Fig. 16 100-
MHz SLAM acoustic micrograph of an alumina panel section that contains a hole showing a crack
with very high contrast. A digitally enhanced image of
this alumina panel is also shown in Fig. 15 in the article
"Use of Color for NDE" in this Volume. Field of view: 3 × 2.25 mm
It is significant to note that attenuation changes in ceramics correlate well with variations in strength (Ref 16). Fig. 15 in
the article "Use of Color for NDE" in this Volume shows a digitally enhanced pseudocolor image of a ceramic sample
that is useful for quantitative analysis of the gray scale and for identifying precisely the acoustic signal levels without
relying on operator interpretation of the gray scale on the CRT screen.
Example 1: Use of C-SAM to Detect Internal Porosity Defects in an Alumina Ceramic
Disk.
Acoustic microscopy is a powerful tool for nondestructively evaluating ceramic materials and displaying internal defects
and density gradients such as porosity. An acoustic microscope scanning at 50 MHz with an f/1 lens on the transducer
was used to evaluate a 6.4 mm (0.25 in.) thick aluminum oxide ceramic disk. No surface preparation of the sample was
required prior to scanning.
The acoustic microscope, with a 25 m (0.001 in.) acoustic resolution, scanned a 12.7 × 12.7 mm (0.50 × 0.50 in.) area of
the ceramic disk. A pulse-echo technique (C-SAM) displayed internal reflections. The black areas (arrows, Fig. 17),
which were detected as having the highest-amplitude reflection, indicate areas of porosity of the order of 10 to 20 m
(400 to 800 in.) in diameter.
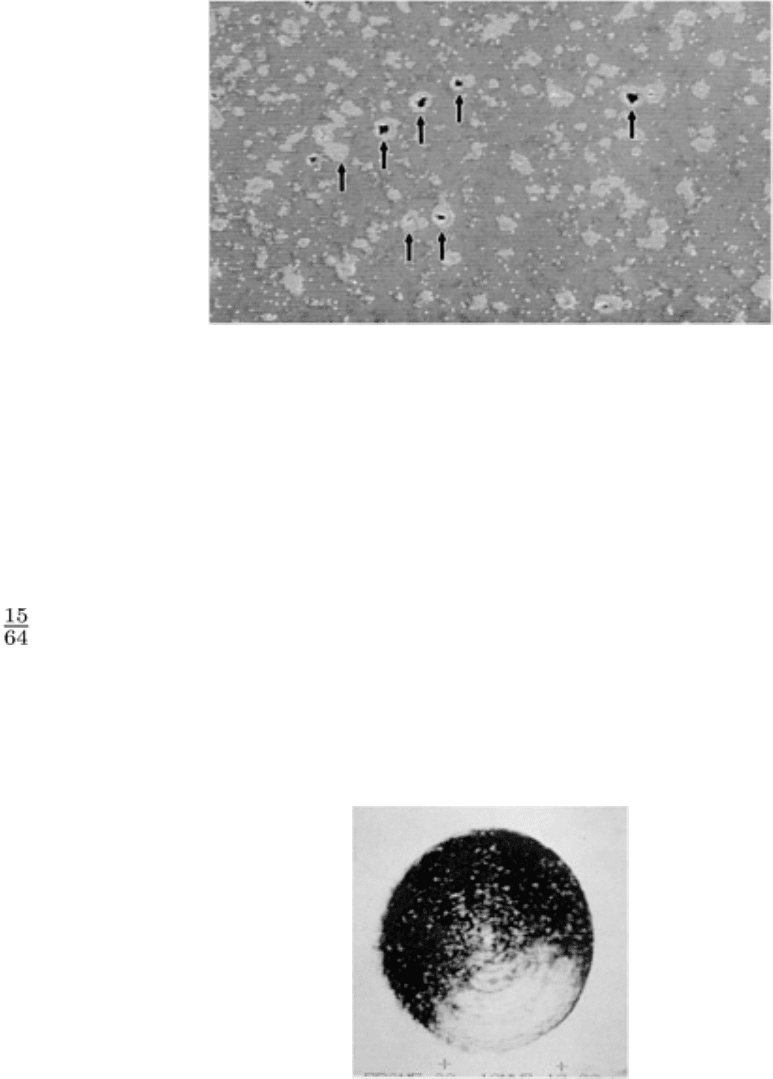
Fig. 17 A portion of the 160 mm
2
(0.25 in.
2
) area of an alumina ceramic disk scanne
d by an acoustic
microscope showing the presence of porosity in the disk (arrows).
Courtesy of G.H. Thomas, Sandia National
Laboratories
Example 2: Analysis of Alumina Ceramic Disks Supplied by a Variety of Manufacturers
and Subjected to SLAM, C-SAM, and SAM Evaluation.
Disks of alumina were obtained from various manufacturers as part of a study on the effects of sintering temperature
changes on mechanical strength and ultrasonic properties. The disks were approximately 25 mm (1 in.) diameter and 6
mm ( in.) thick. Figure 18 shows a through-transmission 10-MHz SLAM image of an alumina disk. Higher SLAM
frequencies could not be used, because of excessive attenuation. This is unusual for ceramic materials unless they are very
porous or otherwise defective. Most of the area of this sample is nontransmissive (dark), which indicates a large internal
defect. A subsequent cross section of this part, shown in Fig. 19, reveals a large crack that correlated to the indication in
the SLAM image. The crack is not parallel to the surface; this was not known prior to cross sectioning.
Fig. 18 Low-frequency 10-
MHz SLAM image of a 25 mm (1 in.) diam alumina test disk. The disk is very
attenuating to ultrasound because of internal defects that cover about 75% of the area (dark zones).
Field of
view: 35 × 26 mm
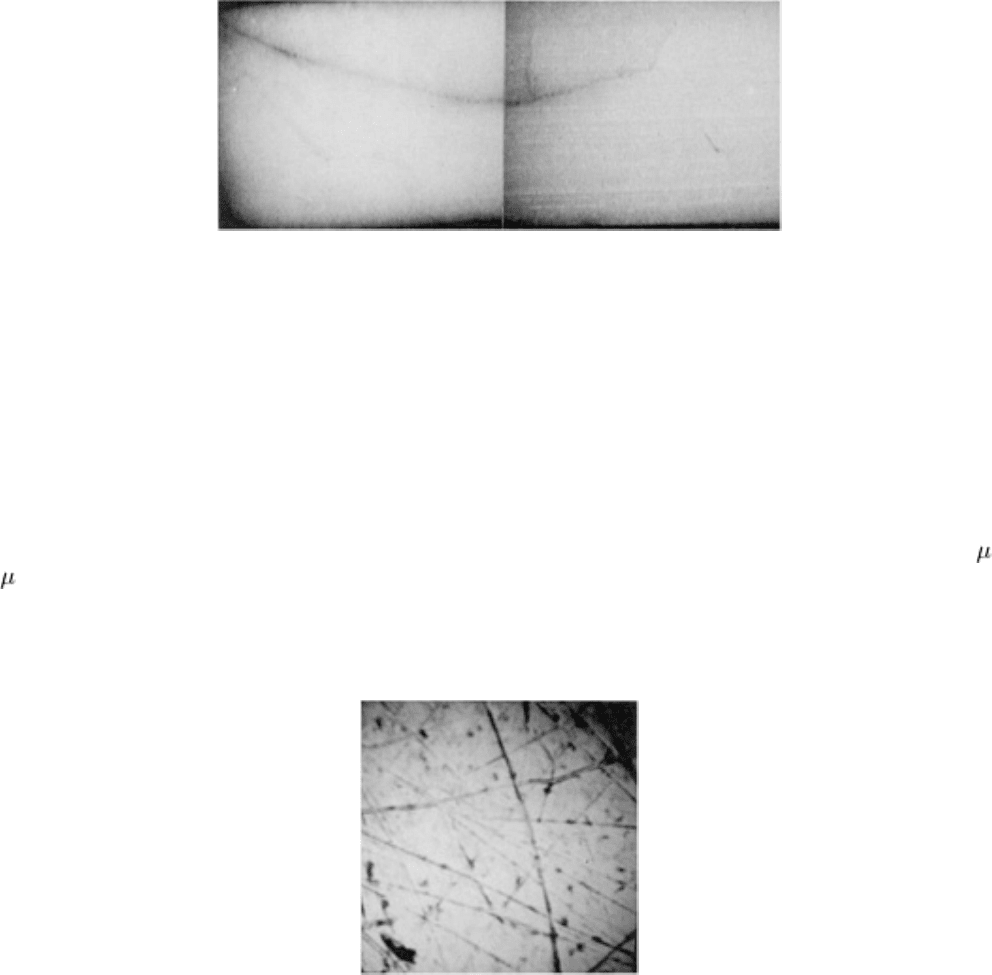
Fig. 19 Cross sectioning of the alumina test disk shown in Fig. 18
reveals a large crack that correlates with the
area of low acoustic transmission. This confirms the presence of an internal defect.
Figures 16(a) and 16(b) in the article "Use of Color for NDE" in this Volume are 15-MHz reflection C-SAM images of
the same part focused to different depths. The radical changes in echo pattern at different depth locations in the disk result
in widely different images. This is due to the nonparallel nature of the crack. In these figures, the darkest features
correspond to the greatest echo amplitude. The C-mode scanning acoustic microscope clearly shows anomalies in this
part, and by sequential scanning at a variety of depths, an overall diagnosis of the part can be assembled.
Figure 20 shows a SAM image produced at 180 MHz in which the lens was focused slightly below the surface (20 m, or
800 in., in water) to highlight subsurface information. The predominant features in Fig. 20 are surface scratches, which
may also be associated with near-surface cracks. The grain structure and porosity of this sample are finer than can be
visualized at 180 MHz.
Fig. 20 SAM image at 180 MHz of the sample shown in Fig. 18 and 19
revealing features of the ceramic at and
near the surface. Color images of this disk are shown in Figures 16(a) and 16(b) in the article
"Use of Color for
NDE" in this Volume. Field of view: 1 × 1 mm
Another alumina sample produced under different conditions was found to be much more transparent acoustically. Figure
21 shows a 30-MHz SLAM image of a typical area of this disk. The higher frequencies are associated with higher
magnifications and therefore smaller fields-of-view. The ceramic appears fairly homogeneous at this level of
magnification. Figure 22, a 100-MHz SLAM image of the sample in Fig. 21, shows that some textural inhomogeneities
are beginning to appear. The texture may be due to nonuniform segregation of porosity in the sample and throughout its
thickness. Figure 23, a 50-MHz C-SAM image of the disk, shows large pores (white) about 1 mm (0.04 in.) below the
surface. Figure 24 shows a 180-MHz SAM image made under conditions identical to Fig. 20. The fine texture at the
surface of this sample is due to porosity. The differences between the two samples are clearly evident acoustically.
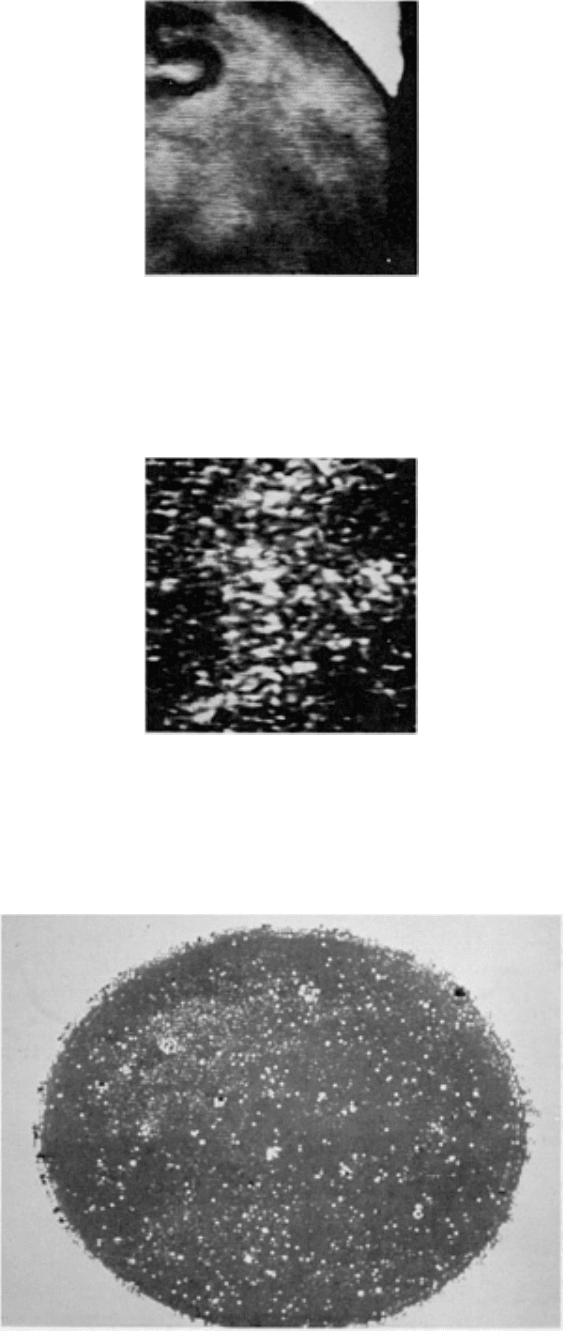
Fig. 21 SLAM images at 30 MHz of an alumina test disk similar in size to that shown in Fig. 18
. This sample
was quite transparent to the ultrasound, as evidenced
by the bright, relatively uniform appearance of the
acoustic image. Field of view: 14 × 10.5 mm
Fig. 22 SLAM 100-MHz transmission acoustic image of the sample shown in Fig. 21
. At this higher frequency,
textured variations in the sample are ev
ident that may be due to micro (subresolution) porosity segregations,
which cause differential absorption. Field of view: 3.5 × 2.6 mm
Fig. 23 C-
SAM reflection mode image at 50 MHz made by setting the gate and focus to about 1 mm (0.04 in.)
below the surface. The white circular spots correspond to individual pores located at this depth.
Field of view:
30 × 30 mm
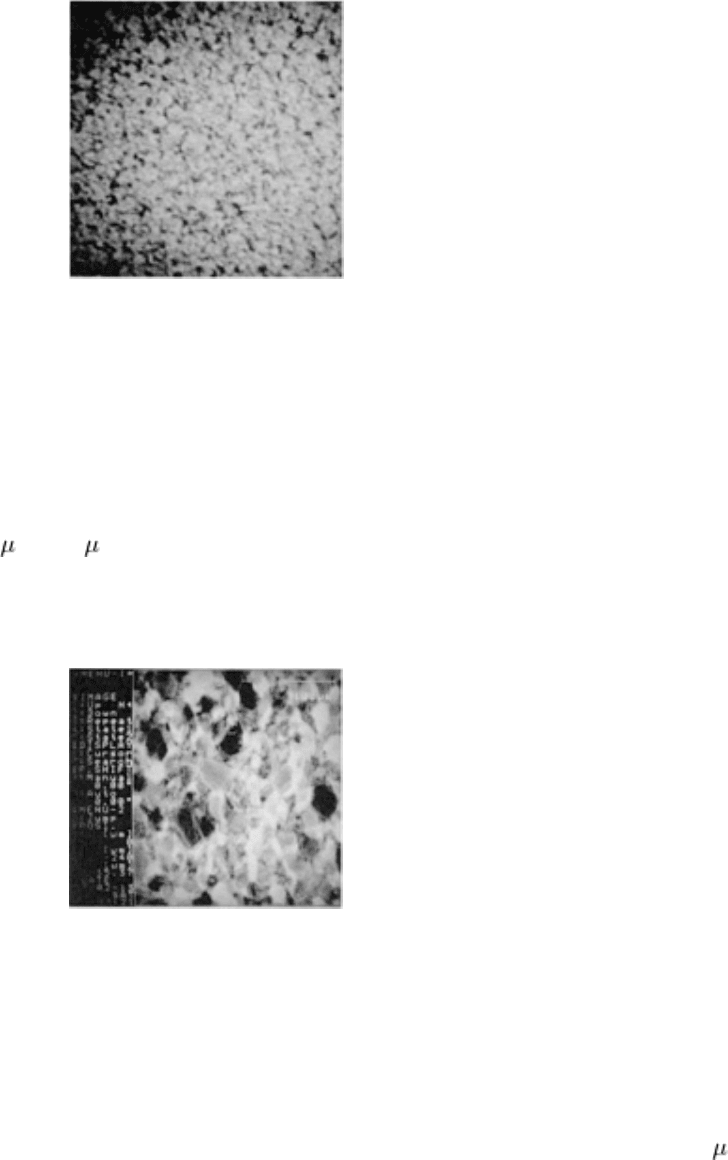
Fig. 24 SAM surface mode image at 180 MHz made under conditions identical to Fig. 20
. In this image, the fine
texture corresponds to porosity of the sample. Note the sharp contrast between the microstructure of this
sample and that of Fig. 20. Field of view: 1 × 1 mm
Metals
In typical optical microscopy and metallography, it is necessary to polish and etch a sample to reveal the microstructural
pattern. With SAM, this may not be necessary, as evidenced by the above. As one further illustration of SAM, Fig. 25
shows a 400-MHz image, focused 23 m (920 in.) below the surface, of a manganese-zinc ferrite material. The different
phases of this important material can be visualized without the use of etchants. For certain metallic samples, that is, those
with smooth, polished surfaces, SAM can be used for nondestructive testing as well as for metallographic analysis.
Fig. 25 SAM surface mode image at 400 MHz of a manganese-
zinc ferrite sample that was polished
metallurgically but not chemically etched. The elastic property differences between the various phases of this
material are responsible for the contrast shown in this image. Courtesy of Honda Electronics Company, Ltd.
Figure 26 shows the metallographic structure of low-carbon steel; the specimen was polished but not etched. Although the
images are similar to optical displays, the acoustic microscope is sensitive to acoustic properties and will generate images
of surface and subsurface structure. The low-carbon steel was scanned at 1.3 GHz over an area measuring 100 × 100 m
(0.004 × 0.004 in.). A high-resolution scanning acoustic microscope was used to generate this image from variations in
the acoustic properties of the steel sample. Details of the grain structure, grain boundaries, and impurities in the specimen
are visible in Fig. 26. The darker areas indicate contaminants trapped in the metal.
