Askeland D.R., Fulay P.P. Essentials of Materials Science & Engineering
Подождите немного. Документ загружается.

gage length of 5 cm. The specimen is placed in the testing machine and a force F, called
the load, is applied. A strain gage or extensometer is used to measure the amount that
the specimen stretches between the gage marks when the force is applied. Thus, what is
measured is the change in length of the specimen (Dl ) over a particular original length
(l
0
). Information concerning the strength, Young’s modulus, and ductility of a material
can be obtained from such a tensile test. Typically, a tensile test is conducted on metals,
alloys, and plastics. Tensile tests can be used for ceramics, however, the test is not very
useful for ceramics because the sample often easily fractures while it is being aligned.
Civil engineers use a compression test to test materials such as concretes. The following
discussion mainly applies to the tensile testing of metals and alloys. We will briefly dis-
cuss the stress-strain behavior of polymers as well.
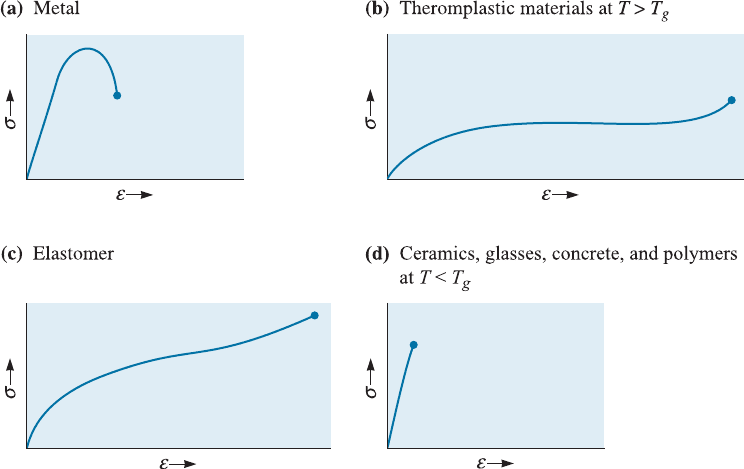
Figure 6-5 shows qualitatively the stress-strain curves for a typical (a) metal, (b)
thermoplastic material, (c) elastomer, and (d) ceramic (or glass), all under relatively
small strain rates. The scales in this figure are qualitative and di¤erent for each material.
In practice, the actual magnitude of stresses and strains will be very di¤erent. The thermo-
plastic material is assumed to be above its glass temperature (T
g
). Metallic materials are
assumed to be at room temperature. Metallic and thermoplastic materials show an ini-
tial elastic region followed by a non-linear plastic region. A separate curve for elas-
tomers (e.g., rubber or silicones) is also included since the behavior of these materials is
di¤erent from other polymeric materials. For elastomers, a large portion of the de-
formation is elastic and non-linear. On the other hand, ceramics, glasses, and polymers
at T < T
g
show only a linear elastic region and almost no plastic deformation at room
temperature.
When a tensile test is conducted, the data recorded includes load or force as a
function of change in length (Dl ). The change in length is typically measured using
a strain gage. Table 6-1 shows the e¤ect of the load on the changes in length of an
aluminum alloy test bar. These data are then subsequently converted into stress and
strain. The stress-strain curve is analyzed further to the extract properties of materials
(e.g., Young’s modulus, yield strength, etc.).
Figure 6-5 Tensile stress-strain curves for different materials. Note that these graphs are
qualitative.
C HA P T E R 6 Mechanical Properties: Fundamentals and Testing160
Engineering Stress and Strain The results of a single test apply to all sizes and cross-
sections of specimens for a given material if we convert the force to stress and the
distance between gage marks to strain. Engineering stress and engineering strain are
defined by the following equations,
Engineering stress ¼ s ¼
F
A
0
ð6-4Þ
Engineering strain ¼ e ¼
Dl
l
0
ð6-5Þ
where A
0
is the original cross-sectional area of the specimen before the test begins, l
0
is the original distance between the gage marks, and Dl is the change in length after
force F is applied. The conversions from load and sample length to stress and strain are
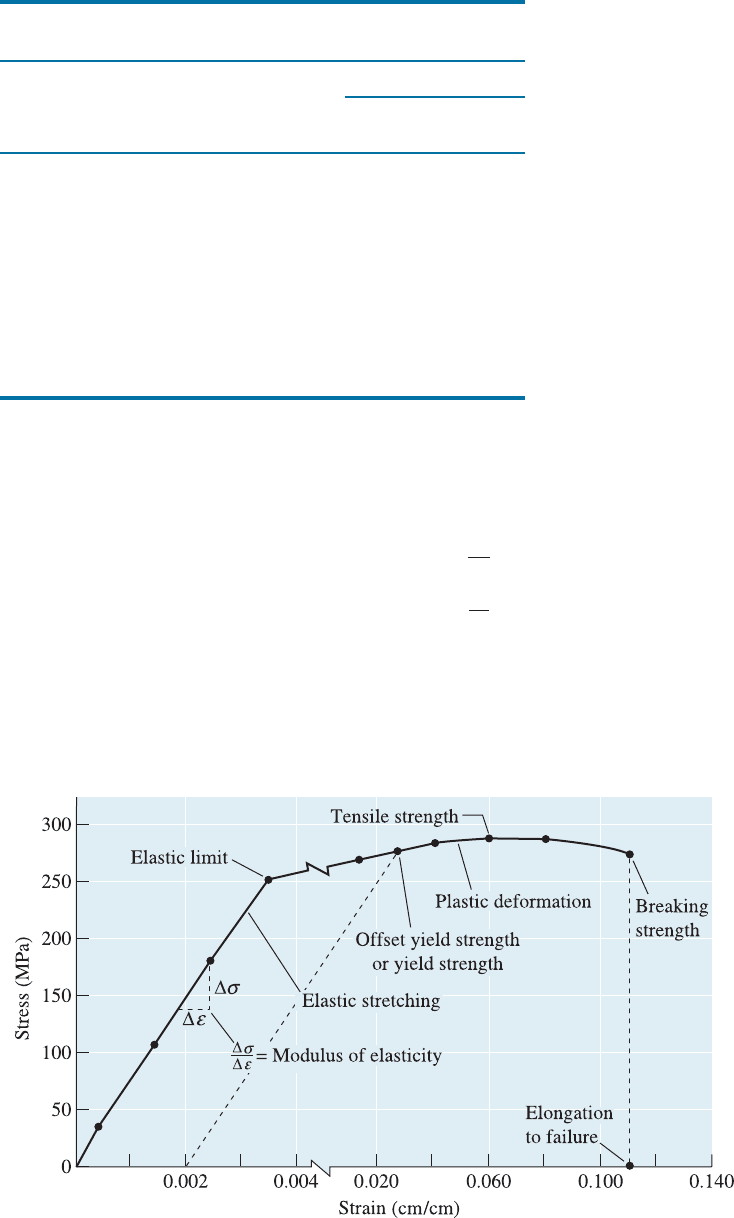
included in Table 6-1. The stress-strain curve (Figure 6-6) is used to record the results of
a tensile test.
Figure 6-6 The stress-strain curve for an aluminum alloy from Table 6-1.
TABLE 6-1 9 The results of a tensile test of a 1.263 cm diameter
aluminum alloy test bar, initial length ( l
0
) = 5cm
Calculated
Load (N)
Dl
(cm)
Stress
(MPa)
Strain
(cm/cm)
0 0.000 0 0
4450 0.0025 35.5 0.0005
13350 0.0075 106.5 0.0015
22240 0.0125 177.5 0.0025
31150 0.0175 248.6 0.0035
33360 0.075 266.2 0.0150
35140 0.2 280.4 0.0400
35580 (maximum load) 0.3 284 0.0600
35360 0.4 282.2 0.0800
33800 (fracture) 0.5125 269.8 0.1025
6-3 The Tensile Test: Use of the Stress-Strain Diagram 161

EXAMPLE 6-1 Tensile Testing of Aluminum Alloy
Convert the change in length data in Table 6-1 to engineering stress and strain
and plot a stress-strain curve.
SOLUTION
For the 4450 N load:
s ¼
F
A
0
¼
4450 N
ðp=4Þð1:263 cmÞ
2
¼
4450
1:253 cm
2
¼ 35:5 MPa
e ¼
Dl
l
0
¼
0:0025 cm
5cm
¼ 0:0005 cm=cm
The results of similar calculations for each of the remaining loads are given in
Table 6-1 and are plotted in Figure 6-6.
Units Many di¤erent units are used to report the results of the tensile test. The most
common units for stress are pounds per square inch (psi) and MegaPascals (MPa). The
units for strain include inch/inch, centimeter/centimeter, and meter/meter. The con-
version factors for stress are summarized in Table 6-2.
TABLE 6-2 9 Units and conversion factors
1 pound (lb) ¼ 4.448 Newtons (N)
1 psi ¼ pounds per square inch
1 MPa ¼ MegaPascal ¼ MegaNewtons per square meter (MN/m
2
)
¼ Newtons per square millimeter (N/mm
2
) ¼ 1,000,000 Pa
1 GPa ¼ 1000 MPa ¼ GigaPascal
1 ksi ¼ 1000 psi ¼ 6.895 MPa
1 psi ¼ 0.006895 MPa
1 MPa ¼ 0.145 ksi ¼ 145 psi
EXAMPLE 6-2
Design of a Suspension Rod
An aluminum rod is to withstand an applied force of 200,200 N. To assure
su‰cient safety, the maximum allowable stress on the rod is limited to 172
MPa. The rod must be at least 375 cm long but must deform elastically no
more than 0.625 cm when the force is applied. Design an appropriate rod.
SOLUTION
We can use the definition of engineering stress to calculate the required cross-
sectional area of the rod:
A
0
¼
F
s
¼
200;200 N
172 MPa
¼ 11:64 cm
2
The rod could be produced in various shapes, provided that the cross-sectional
area is 11.64 cm2. For a round cross-section, the minimum diameter to assure that
C HA P T E R 6 Mechanical Properties: Fundamentals and Testing162

the stress is not too high is:
A
0
¼
pd
2
4
¼ 11:64 cm
2
or d ¼ 3:85 cm
The maximum allowable elastic deformation is 0.625 cm. From the definition
of engineering strain:
e ¼
Dl
l
0
¼
0:625 cm
l
0
From Figure 6-6, the strain expected for a stress of 172 MPa is 0.0024 cm/cm.
If we use the cross-sectional area determined previously, the maximum length
of the rod is:
0:0024 ¼
Dl
l
0
¼
0:625 cm
l
0
or l
0
¼ 260:42 cm
However, the minimum length of the rod is specified as 375 cm. To produce a
longer rod, we might make the cross-sectional area of the rod larger. The mini-
mum strain allowed for the 375 cm rod is :
e ¼
Dl
l
0
¼
0:625 cm
375 cm
¼ 0:001667 cm=cm
The stress, from Figure 6-6, is about 114.9 MPa, which is less than the max-
imum of 172 MPa. The minimum cross-sectional area then is:
A
0
¼
F
s
¼
200;200 N
114:9 MPa
¼ 17:42 cm
2
In order to satisfy both the maximum stress and the minimum elongation
requirements, the cross-sectional area of the rod must be at least 17.42 cm2,or
a minimum diameter of 4.71 cm.
6-4 Properties Obtained from the Tensile Test
Yield Strength As we apply a low level of stress to a material, the material initially
exhibits elastic deformation. In this region the strain that develops is completely and
quickly recovered when the applied stress is removed. However, as we continue to in-
crease the applied stress the material begins to exhibit both elastic and plastic de-
formation. The material eventually ‘‘yields’’ to the applied stress. The critical stress
value needed to initiate plastic deformation is defined as the elastic limit of the material.
In metallic materials, this is usually the stress required for dislocation motion, or slip to
be initiated. In polymeric materials, this stress will correspond to disentanglement of poly-
mer molecule chains or sliding of chains past each other. The proportional limit is de-
fined as the level of stress above which the relationship between stress and strain is not
linear.
In most materials the elastic limit and proportional limit are quite close. However,
neither the elastic limit nor the proportional limit values can be determined precisely.
Measured values depend on the sensitivity of the equipment used. We, therefore, define
them at an o¤set strain value (typically, but not always, 0.002 or 0.2%). We then draw a
6-4 Properties Obtained from the Tensile Test 163
line starting with this o¤set value of strain and draw a line parallel to the linear portion
of the engineering stress-strain curve. The stress value corresponding to the intersection
of this line and the engineering stress-strain curve is defined as the o¤set yield strength,
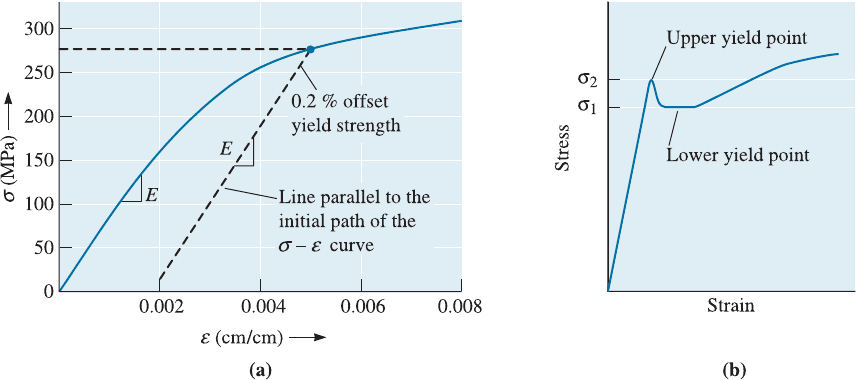
also often stated as the yield strength. The 0.2% o¤set yield strength for gray cast iron is
276 MPa as shown in Figure 6-7(a). Engineers normally prefer to use the o¤set yield
strength for design purposes.
For some materials the transition from elastic deformation to plastic flow is rather
abrupt. This transition is known as the yield point phenomenon. In these materials, as
the plastic deformation begins the stress value drops first from the upper yield point (s
2
)
[Figure 6-7(b)]. The stress value then decreases and oscillates around an average value
defined as the lower yield point (s
1
). For these materials, the yield strength is usually
defined from the 0.2% strain o¤set as shown in Figure 6-7(a).
The stress-strain curve for certain low-carbon steels displays a double yield point
[Figure 6-7(b)]. The material is expected to plastically deform at stress s
1
. However,
small interstitial atoms clustered around the dislocations interfere with slip and raise the
yield point to s
2
. Only after we apply the higher stress s
2
do the dislocations slip. After
slip begins at s
2
, the dislocations move away from the clusters of small atoms and
continue to move very rapidly at the lower stress s
1
.
When we design parts for load-be aring applications we prefer little or no plastic
deformation. As a result we must select a material such that the design stress is consid-
erably lower than the yield strength at the temperature at which the material will be
used. We can also make the component cross-section larger so that the applied force
produces a stress that is well below the yield strength. On the other hand, when we want
to shape materials into components (e.g., take a sheet of steel and form a car chassis),
we need to apply stresses that are well above the yield strength.
Tensile Strength The stress obtained at the highest applied force is the tensile strength
(s
TS
), which is the maximum stress on the engineering stress-strain curve (Figure 6-6).
In many ductile materials, deformation does not remain uniform. At some point, one
region deforms more than others and a large, local decrease in the cross-sectional area
occurs (Figure 6-8). This locally deformed region is called a ‘‘neck.’’ This phenomenon
Figure 6-7 (a) Determining the 0.2% offset yield strength in gray cast iron, and (b) upper and
lower yield point behavior in a low-carbon steel.
C HA P T E R 6 Mechanical Properties: Fundamentals and Testing164
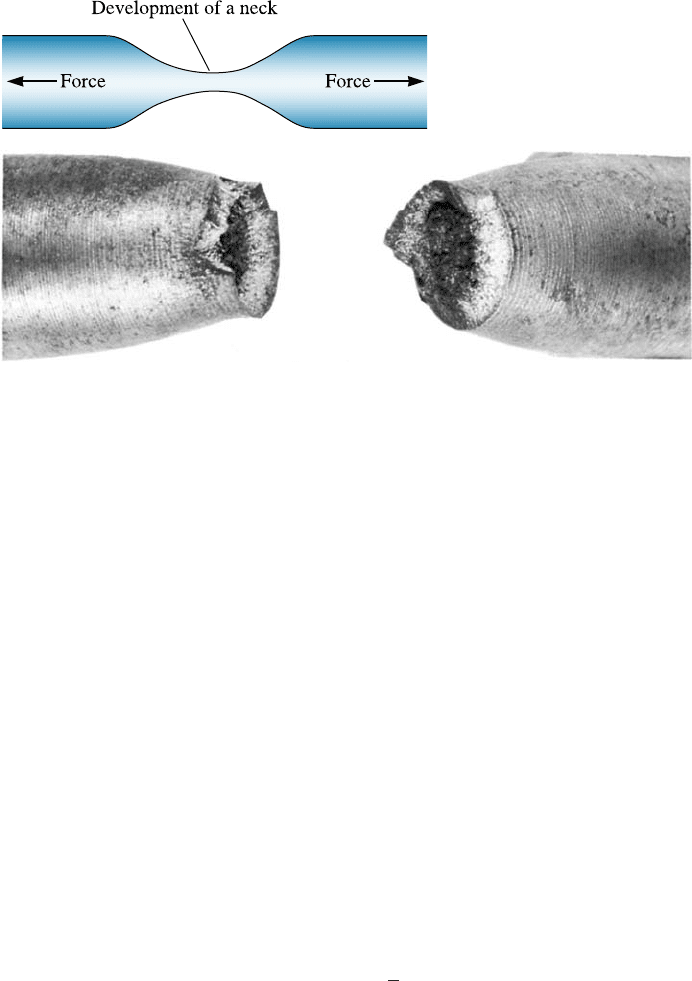
is known as necking. Because the cross-sectional area becomes smaller at this point, a
lower force is required to continue its deformation, and the engineering stress, calcu-
lated from the original area A
0
, decreases. The tensile strength is the stress at which
necking begins in ductile materials (Figure 6-6). With the reduced area, now less force is
necessary for additional deformation. However, since engineering stress is based on A
0
,
the overall stress decreases after necking. Many ductile metals and polymers show the
phenomenon of necking. In compression testing, the materials will bulge, thus necking
is seen only in a tensile test.
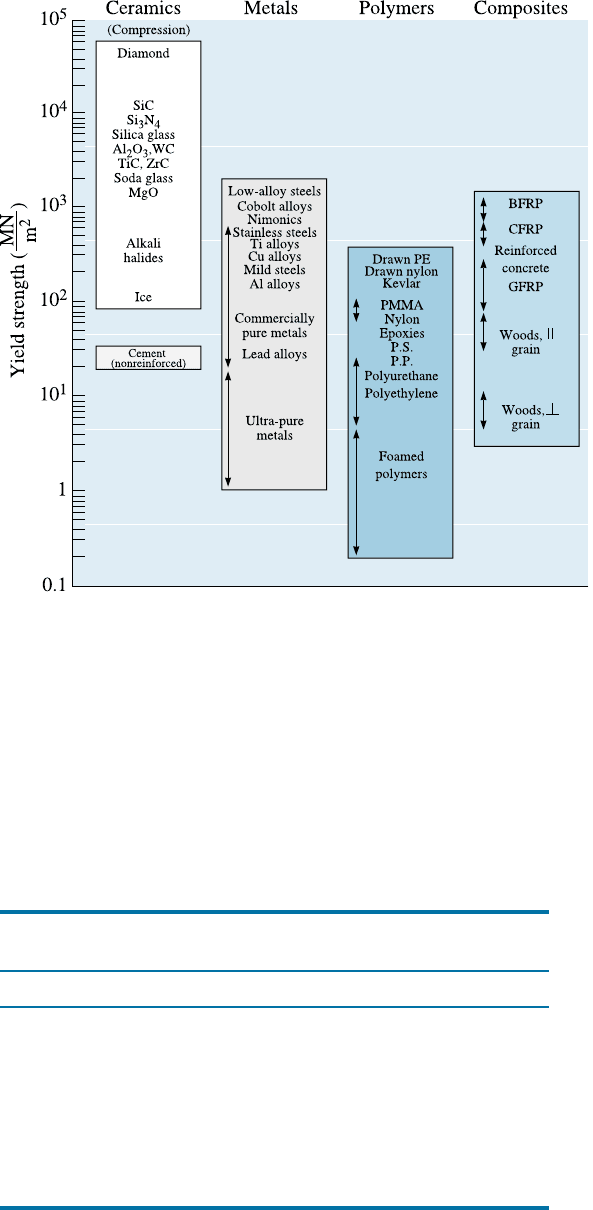
Figure 6-9 shows typical yield strength values for di¤erent engineered materials.
The yield strength of pure metals is smaller. For example, ultra-pure metals have a yield
strength of @(1–10 MPa). On the other hand, the yield strength of alloys is higher.
Strengthening in alloys is achieved using di¤erent mechanisms described before (e.g.,
grain size, solid solution formation, strain hardening, etc.). The yield strength of plastics
and elastomers is generally lower than metals and alloys, ranging up to about (10–
100 MPa). The values for ceramics are for compressive strength (obtained using a
hardness test). Tensile strength of most ceramics is much lower (@100–200 MPa). The
tensile strength of glasses is about @70 MPa and depends strongly on surface flaws.
Elastic Properties The modulus of elasticity, or Young’s modulus (E ), is the slope of
the stress-strain curve in the elastic region. This relationship is Hooke’s Law:
E ¼
s
e
ð6-6Þ
The modulus is closely related to the binding energies (Figure 2-21). A steep slope in the
force-distance graph at the equilibrium spacing indicates that high forces are required
to separate the atoms and cause the material to stretch elastically. Thus, the material
has a high modulus of elasticity. Binding forces, and thus the modulus of elasticity, are typi-
cally higher for high melting-point materials (Table 6-3). In metallic materials, modulus
of elasticity is considered a relative microstructure insensitive property since the value is
dominated strongly by the strength of atomic bonds. Grain size or other microstructural
features do not have a very large e¤ect on the Young’s modulus.
Figure 6-8 Localized deformation of a ductile material during a tensile test produces a necked
region. The micrograph at the bottom shows necked region in a fractured sample.
6-4 Properties Obtained from the Tensile Test 165
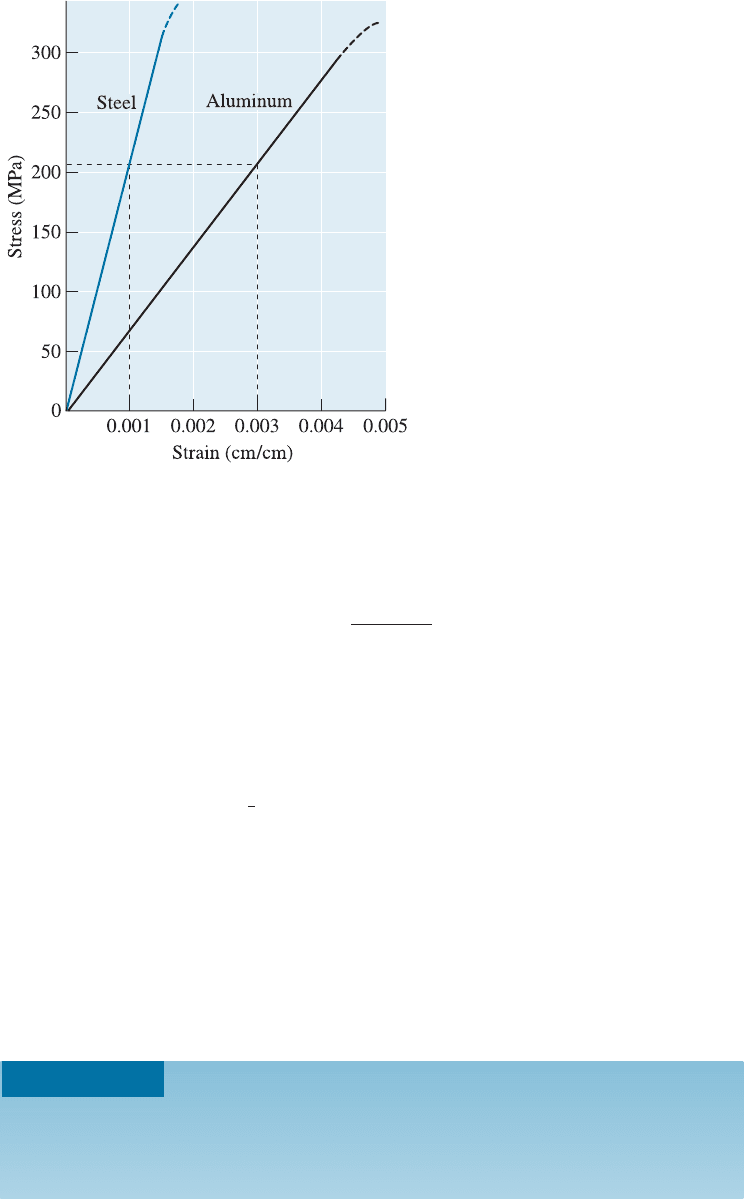
Young’s modulus is a measure of the sti¤ness of a component. A sti¤ component,
with a high modulus of elasticity, will show much smaller changes in dimensions if
the applied stress is relatively small and, therefore, causes only elastic deformation.
Figure 6-10 compares the elastic behav ior of steel and aluminum. If a stress of 207 MPa
is applied to each material, the steel deforms elastically 0.001 cm/cm; at the same stress,
aluminum deforms 0.003 cm/cm. In general, most engineers view sti¤ness as a function
of both the Young’s modulus and the geometry of a component.
Figure 6-9 Typical yield strength values for different engineered materials. ( This article was
published in Engineering Materials I, Second Edition, M.F. Ashby and D.R.H. Jones,
Figure 8-12, p. 85. Copyright > Butterworth-Heinemann (1996). )
TABLE 6-3 9 Elastic properties and melting temperature (T
m
) of selected
materials
Material T
m
(
˚
C) E (MPa) Poisson’s ratio (m)
Pb 327 13.8 10
3
0.45
Mg 650 44.8 10
3
0.29
Al 660 69.0 10
3
0.33
Cu 1085 124.8 10
3
0.36
Fe 1538 206.9 10
3
0.27
W 3410 408.2 10
3
0.28
Al
2
O
3
2020 379.2 10
3
0.26
Si
3
N
4
303.4 10
3
0.24
C HA P T E R 6 Mechanical Properties: Fundamentals and Testing166
Poisson’s ratio, m, relates the longitudinal elastic deformation produced by a simple
tensile or compressive stress to the lateral deformation that occurs simultaneously:
m ¼
e
lateral
e
longitudinal
ð6-7Þ
For many metals in the elastic region the Poisson’s ratio is typically about 0.3 (Table
6-3).
The modulus of resilience (E
r
), the area contained under the elastic portion of a
stress-strain curve, is the elastic energy that a material absorbs during loading and sub-
sequently releases when the load is removed. For linear elastic behavior:
E
r
¼
1
2
ðyield strengthÞðstrain at yieldingÞð6-8Þ
The ability of a spring or a golf ball to perform satisfactorily depends on a high
modulus of resilience.
Tensile Toughness The energy absorbed by a material prior to fracturing is known as
tensile toughness and is sometimes measured as the area under the true stress-strain
curve (also known as work of fracture). We will define true stress and true strain in
Section 6-5. Since it is easier to measure engineering stress-strain, engineers often equate
tensile toughness to the area under the engineering stress-strain curve.
Figure 6-10
Comparison of the elastic behavior
of steel and aluminum. For a given
stress, aluminum deforms elastically
three times as much as does steel.
EXAMPLE 6-3
Young’s Modulus of Aluminum Alloy
From the data in Example 6-1, calculate the modulus of elasticity of the alumi-
num al loy. Use the modulus to determine the length after deformation of a bar
of initial length of 125 cm. Assume that a level of stress of 207 MPa is applied.
6-4 Properties Obtained from the Tensile Test 167

SOLUTION
When a stress of 248.6 MPa is applied, a strain of 0.0035 is produced (Table
6-1). Thus:
Modulus of elasticity ¼ E ¼
s
e
¼
248:6 MPa
0:0035
¼ 71028:6 MPa
From Hooke’s law:
e ¼
s
E
¼
207 MPa
71028:6 MPa
¼ 0:003 ¼ cm=cm ¼
l l
0
l
0
l ¼ l
0
þ el
0
¼ 125 þð0:003Þð125Þ¼125:375 cm
Ductility Ductil ity measures the amount of deformation that a material can withstand
without breaking. We can measure the distance between the gage marks on our speci-
men before and after the test. The percent elongation describes the permanent plastic
deformation before failure (i.e., the elastic deformation recovered after fracture is not
included). Note that the strain after failure is smaller than the strain at the breaking
point.
% Elongation ¼
l
f
l
0
l
0
100 ð6-9Þ
where l
f
is the distance between gage marks after the specimen breaks.
A second approach is to measure the percent change in the cross-sectional area at
the point of fracture before and after the test. The percent reduction in area describes the
amount of thinning undergone by the specimen during the test:
% Reduction in area ¼
A
0
A
f
A
0
100 ð6-10Þ
where A
f
is the final cross-sectional area at the fracture surface.
Ductility is important to both designers of load-bearing components and manu-
facturers of components (bars, rods, wires, plates, I-beams, fibers, etc.) utilizing mate-
rials processing.
EXAMPLE 6-4
Ductility of an Aluminum Alloy
The aluminum alloy in Example 6-1 has a final length after failure of 5.488 cm
and a final diameter of 0.995 cm at the fractured surface. Calculate the ductility
of this alloy.
SOLUTION
% Elongation ¼
l
f
l
0
l
0
100 ¼
5:488 5:000
5:000
100 ¼ 9: 76%
% Reduction in area ¼
A
0
A
f
A
0
100
¼
ðp=4Þð1:263Þ
2
ðp=4Þð0:995Þ
2
ðp=4Þð1:263Þ
2
100
¼ 37:9%
The final length is less than 5.5125 cm (see Table 6-1) because, after fracture,
the elastic strain is recovered.
C HA P T E R 6 Mechanical Properties: Fundamentals and Testing168
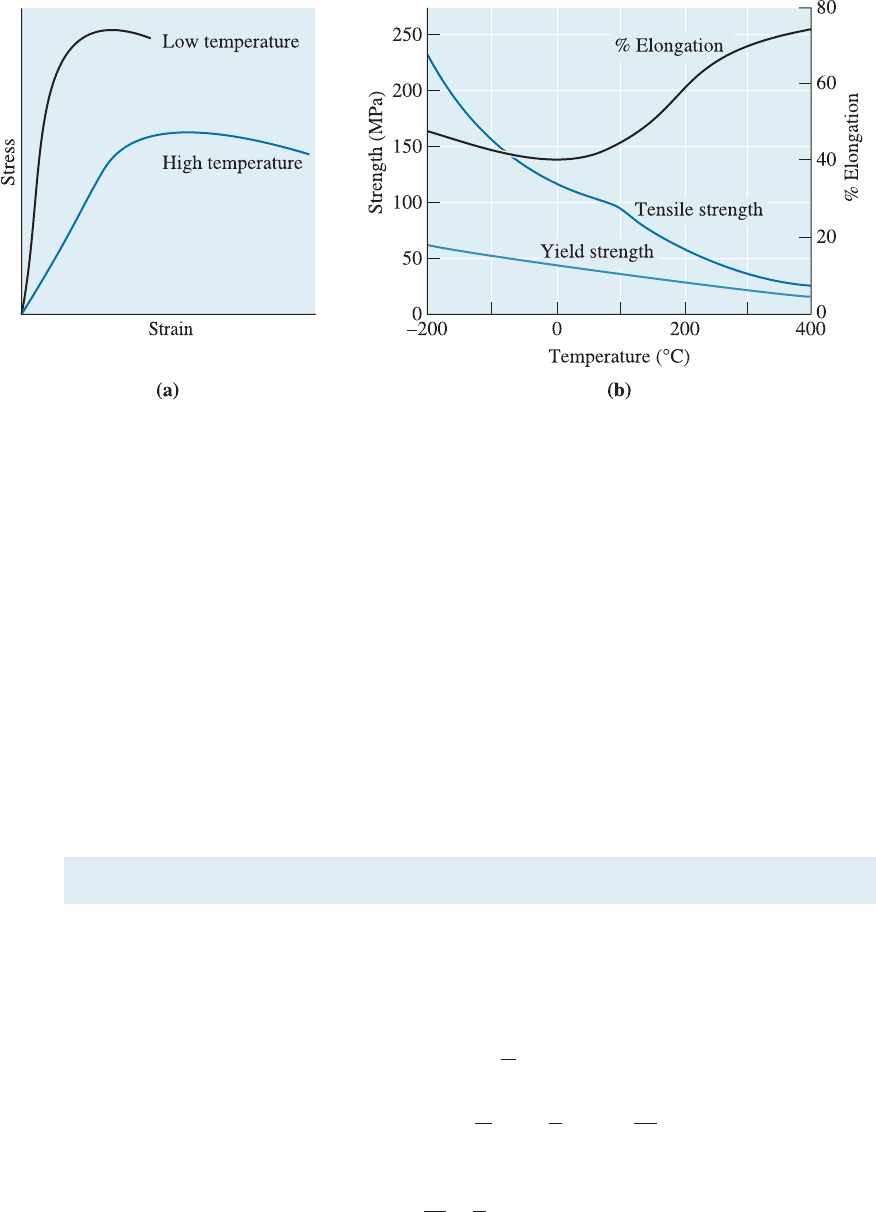
Effect of Temperature Mechanical properties of materials depend on temperature
(Figure 6-11). Yield stren gth, tensile strength, and modulus of elasticity decrease at
higher temperatures, whereas ductility commonly increases. A materials fabricator
may wish to deform a material at a high temperature (known as hot working) to take
advantage of the higher ductility and lower required stress. When temperatures are re-
duced, many, but not all, metals and alloys and polymers become brittle.
Increased temperatures also play an important role in forming polymeric materials
and inorganic glasses. In many polymer-processing operations, such as extrusion, the
increased ductility of polymers at higher temperatures is advantageous. Also, many
polymeric materials will become harder and more brittle as they are exposed to tem-
peratures that are below their glass temperatures (Figure 6-5). The loss of ductility
played a role in failures of the Titanic in 1912 and the Challenger in 1986.
6-5 True Stress and True Strain
The decrease in engineering stress beyond the tensile strength point on an engineering
stress-strain curve is related to the definition of engineering stress. We used the original
area A
0
in our calculations, but this is not precise because the area continually changes.
We define true stress and true strain by the following equations:
True stress ¼ s
t
¼
F
A
ð6-11Þ
True strain ¼
ð
dl
l
¼ ln
l
l
0
¼ ln
A
0
A
ð6-12Þ
where A is the actual area at which the force F is applied. In plastic deformation we
assume a constant volume
i.e.,
A
0
A
¼
l
l
0
. The expression lnðA
0
=AÞ should be used
Figure 6-11 The effect of temperature (a) on the stress-strain curve and (b) on the tensile
properties of an aluminum alloy.
6-5 True Stress and True Strain 169