Askeland D.R., Fulay P.P. Essentials of Materials Science & Engineering
Подождите немного. Документ загружается.


5-12 A 0.2-mm thick wafer of silicon is treated so that
a uniform concentration gradient of antimony
is produced. One surface contains 1 Sb atom
per 10
8
Si atoms and the other surface contains
500 Sb atoms per 10
8
Si atoms. The lattice pa-
rameter for Si is 5.407 A
(Appendix A). Calculate
the concentration gradient in
(a) atomic percent Sb per cm; and
(b) Sb
atoms
cm
3
cm
5-13 When a Cu-Zn alloy solidifies, one portion of the
structure contains 25 atomic percent zinc and
another portion 0.025 mm away contains 20
atomic percent zinc. The lattice parameter for the
FCC alloy is about 3:63 10
8
cm. Determine
the concentration gradient in
(a) atomic percent Zn per cm;
(b) weight percent Zn per cm; and
(c) Zn
atoms
cm
3
cm
5-14 A 0.0025-cm BCC iron foil is used to separate a
high hydrogen gas from a low hydrogen gas at
650
C. 5 10
8
H atoms/cm
3
are in equilibrium
on one side of the foil, and 2 10
3
H atoms/cm
3
are in equilibrium with the other side. Determine
(a) the concentration gradient of hydrogen; and
(b) the flux of hydrogen through the foil.
5-15 A 1-mm sheet of FCC iron is used to contain
nitrogen in a heat exchanger at 1200
C. The
concentration of N at one surface is 0.04 atomic
percent and the concentration at the second sur-
face is 0.005 atomic percent. Determine the flux
of nitrogen through the foil in N atoms/cm
2
s.
5-16 A 4-cm-diameter, 0.5-mm-thick spherical con-
tainer made of BCC iron holds nitrogen at
700
C. The concentration at the inner surface is
0.05 atomic percent and at the outer surface is
0.002 atomic percent. Calculate the number of
grams of nitrogen that are lost from the container
per hour.
5-17 A BCC iron structure is to be manufactured that
will allow no more than 50 g of hydrogen to be
lost per year through each square centimeter of
the iron at 400
C. If the concentration of hydro-
gen at one surface is 0.05 H atom per unit cell
and is 0.001 H atom per unit cell at the second
surface, determine the minimum thickness of the
iron.
5-18 Determine the maximum allowable tempera-
ture that will produce a flux of less than
2000 H atoms/cm
2
s through a BCC iron
foil when the concentration gradient is 5
10
16
atoms
cm
3
cm
. (Note the negative sign for the flux.)
5-19 As mentioned before in Example 5-4, the di¤usion
of yttrium ions in chromium oxide (Cr
2
O
3
)has
been studied by Lesage and co-workers. In addition
to the measurement of di¤usion of yttrium ion in
bulk chromia scale grown on a Ni-Cr alloy, these
researchers also measured the di¤usion of yttrium
along the grain boundaries. These data are for
grain-boundary di¤usivities are shown here.
Temperature
(˚ C)
Grain-Boundary
Diffusion Coefficient
(D) (cm
2
/s)
800 1:2 10
13
850 5:4 10
13
900 6:7 10
13
950 1:8 10
12
1000 4:6 10
12
(Source: J. Li, M.K. Loudjani, B. Lesage, A.M.
Huntz, Philosophical Magazine A, 1997,
76[4], pp. 857–69).
(a) From these data, show that the activation
energy for grain-boundary di¤usion of yt-
trium in chromia oxide scale on nickel-
chromium alloy is 190 kJ/cal.
(b) What is the value of the pre-exponential term
D
0
in cm
2
/s?
(c) What is the relationship between D and
1=T for the grain-boundary di¤usivity in this
temperature range?
(d) At any given temperature, the di¤usivity of
chromium along grain boundaries is several
orders of magnitude higher than that for
within the bulk (See Example 5-4). Is this to
be expected? Explain.
5-20 Certain ceramic materials such as those based on
oxides of yttrium, barium, and copper have been
shown to be superconductors near liquid nitrogen
temperature (@77 to 110 K). Since ceramics are
brittle, it has been proposed to make long wires
of these materials by encasing them in a silver
tube. In this work, researchers investigated the
di¤usion of oxygen in a compound YBa
2
Cu
3
O
7
.
The data in the temperature range 500 to 650
C
are shown below for undoped (i.e., silver free)
samples.
Temperature
(˚ C)
Diffusion Coefficient
(D) (cm
2
/s)
500 2:77 10
6
600 5:2 10
6
650 9:24 10
6
(Source: D.K. Aswal, S.K. Gupta, P.K. Mishra,
V.C. Sahni, Superconductor Science and
Technology, 1998, 11[7], pp. 631–6).
C H A P T E R 5 Atom and Ion Movements i n Materials150

Assume that these data are su‰cient to make a
straight line fit for the relationship between lnðDÞ
and 1=T and calculate the values of the activation
energy for di¤usion of oxygen in YBa
2
Cu
3
O
7
containing no silver.
5-21 Di¤usion of oxygen in YBa
2
Cu
3
O
7
doped with
silver was measured. It was seen that the di¤usion
of oxygen was slowed down by silver doping, as
shown in the data here.
Temperature
(˚ C)
Diffusion Coefficient
(D) (cm
2
/s)
650 2:89 10
7
700 8:03 10
7
750 3:07 10
26
(Source: D.K. Aswal, S.K. Gupta, P.K. Mishra,
V.C. Sahni, Superconductor Science and
Technology, 1998, 11[7], pp. 631–6).
Ideally, more data points would be better. How-
ever, assume that these data are su‰cient
to make a straight line fit for the relationship be-
tween lnðDÞ and 1=T and calculate the values of
the activation energy for di¤usion of oxygen in
YBa
2
Cu
3
O
7
containing silver.
5-22 Zinc oxide (ZnO) ceramics are used in a variety
of applications, such as surge-protection devices.
The di¤usion of oxygen in single crystals of ZnO
was studied by Tomlins and co-workers. These
data are shown in the table here.
Temperature
(˚ C)
Diffusion Coefficient
(D) (cm
2
/s)
850 2 :73 10
17
925 8 :20 10
17
995 2 :62 10
15
1000 2:21 10
15
1040 5:48 10
15
1095 4:20 10
15
1100 6:16 10
15
1150 1:31 10
14
1175 1:97 10
14
1200 3:50 10
14
(Source: G.W. Tomlins, J.L. Routbort, and
T.O. Mason, Journal of the American Ceramic
Society, 1998, 81[4], pp. 869–76).
Using these data, calculate the activation energy
for the di¤usion of oxygen in ZnO. What is the
value of D
0
in cm
2
/s?
Section 5-7 Permeability of Polymers
5-23 Amorphous PET is more permeable to CO
2
than
PET that contains micro-crystallites. Explain why.
5-24 Explain why a rubber balloon filled with helium
gas deflates over time.
Section 5-8 Composition Profile (Fick’s Second
Law)
5-25 Consider a 2-mm-thick silicon (Si) wafer to be
doped using antimony (Sb). Assume that the dop-
ant source (gas mixture of antimony chloride and
other gases) provides a constant concentration of
10
22
atoms/m
3
. If we need a dopant profile such
that the concentration of Sb at a depth of 1 mi-
crometer is 5 10
21
atoms/m
3
. What will be the
time for the di¤usion heat treatment? Assume that
the silicon wafer to begin with contains no im-
purities or dopants. Assume the activation energy
for di¤usion of Sb in silicon is 380 kJ/mole and D
0
forSbdi¤usioninSiis1:3 10
3
m
2
/s.
5-26 Compare the di¤usion coe‰cients of carbon in
BCC and FCC iron at the allotropic transform-
ation temperature of 912
C and explain the di¤er-
ence.
5-27 What is carburizing? Explain why this process is
expected to cause an increase in the hardness of
the surface of plain carbon steels?
5-28 A carburizing process is carried out on a 0.10%
C steel by introducing 1.0% C at the surface at
980
C, where the iron is FCC. Calculate the car-
bon content at 0.01 cm, 0.05 cm, and 0.10 cm
beneath the surface after 1 h.
5-29 Iron containing 0.05% C is heated to 912
Cinan
atmosphere that produces 1.20% C at the surface
and is held for 24 h. Calculate the carbon content
at 0.05 cm beneath the surface if
(a) the iron is BCC; and
(b) the iron is FCC. Explain the di¤erence.
5-30 What temperature is required to obtain 0.50% C
at a distance of 0.5 mm beneath the surface of a
0.20% C steel in 2 h, when 1.10% C is present at
the surface? Assume that the iron is FCC.
5-31 A 0.15% C steel is to be carburized at 1100
C,
giving 0.35% C at a distance of 1 mm beneath the
surface. If the surface composition is maintained
at 0.90% C, what time is required?
5-32 A 0.02% C steel is to be carburized at 1200
Cin
4 h, with a point 0.6 mm beneath the surface
reaching 0.45% C. Calculate the carbon content
required at the surface of the steel.
5-33 A 1.2% C tool steel held at 1150
C is exposed to
oxygen for 48 h. The carbon content at the steel
surface is zero. To what depth will the steel be
decarburized to less than 0.20% C?
Problems 151

5-34 A 0.80% C steel must operate at 950
Cinan
oxidizing environment where the carbon content
at the steel surface is zero. Only the outermost
0.02 cm of the steel part can fall below 0.75% C.
What is the maximum time that the steel part can
operate?
5-35 A steel with BCC crystal structure containing
0.001% N is nitrided at 550
C for 5 h. If the nitro-
gen content at the steel surface is 0.08%, determine
the nitrogen content at 0.25 mm from the surface.
5-36 What time is required to nitride a 0.002 N steel to
obtain 0.12% N at a distance of 0.005 cm beneath
the surface at 625
C? The nitrogen content at the
surface is 0.15%.
5-37 We can successfully perform a carburizing heat
treatment at 1200
C in 1 h. In an e¤ort to reduce
the cost of replacing the brick lining in our fur-
nace, we propose to reduce the carburizing tem-
perature to 950
C. What time will be required to
give us a similar carburizing treatment?
Section 5-9 Diffusion and Materials Processing
5-38 Arrange the following materials in increasing
order of self-di¤usion coe‰cient: Ar gas, water,
single crystal aluminum, and liquid aluminum at
700
C.
5-39 During freezing of a Cu-Zn alloy, we find that
the composition is nonuniform. By heating the
alloy to 600
C for 3 hours, di¤usion of zinc helps
to make the composition more uniform. What
temperature would be required if we wished to
perform this homogenization treatment in 30
minutes?
5-40 A ceramic part made of MgO is sintered success-
fully at 1700
C in 90 minutes. To minimize ther-
mal stresses during the process, we plan to reduce
the temperature to 1500
C. Which will limit the
rate at which sintering can be done: di¤usion of
magnesium ions or di¤usion of oxygen ions? What
time will be required at the lower temperature?
5-41 A Cu-Zn alloy has an initial grain diameter of
0.01 mm. The alloy is then heated to various
temperatures, permitting grain growth to occur.
The times required for the grains to grow to a
diameter of 0.30 mm are
Temperature (
˚
C) Time (minutes)
500 80,000
600 3,000
700 120
800 10
850 3
Determine the activation energy for grain growth.
Does this correlate with the di¤usion of zinc in
copper? (Hint: Note that rate is the reciprocal of
time.)
5-42 A sheet of gold is di¤usion-bonded to a sheet of
silver in 1 h at 700
C. At 500
C, 440 h are re-
quired to obtain the same degree of bonding, and
at 300
C, bonding requires 1530 years. What is
the activation energy for the di¤usion bonding
process? Does it appear that di¤usion of gold
or di¤usion of silver controls the bonding rate?
(Hint: Note that rate is the reciprocal of time.)
Design Problems
g
5-43 Design a spherical tank, with a wall thickness of
2 cm that will assure that no more than 50 kg of
hydrogen will be lost per year. The tank, which
will operate at 500
C, can be made of nickel,
aluminum, copper, or iron. The di¤usion co-
e‰cient of hydrogen and the cost per kg for each
available material is listed here.
Diffusion Data
D
0
Q Cost
Material (cm
2
/s) cal/mol ($/kg)
Nickel 0.0055 8,900 9.0
Aluminum 0.16 10,340 1.32
Copper 0.011 9,380 2.43
Iron (BCC) 0.0012 3,600 0.33
5-44 A steel gear initially containing 0.10% C is to be
carburized so that the carbon content at a depth
of 0.13 cm is 0.50% C. We can generate a carbu-
rizing gas at the surface that contains anywhere
from 0.95% C to 1.15% C. Design an appropriate
carburizing heat treatment.
5-45 When a valve casting containing copper and
nickel solidifies under nonequilibrium conditions,
we find that the composition of the alloy varies
substantially over a distance of 0.005 cm. Usually
we are able to eliminate this concentration dif-
ference by heating the alloy for 8 h at 1200
C;
however, sometimes this treatment causes the
alloy to begin to melt, destroying the part. De-
sign a heat treatment that will permit elimination
of the nonuniformity without danger of melting.
Assume that the cost of operating the furnace per
hour doubles for each 100
C increase in temper-
ature.
C H A P T E R 5 Atom and Ion Movements i n Materials152

6
Mechanical Properties:
Fundamentals and Tensile,
Hardness, and Impact Testing
Have You Ever Wondered?
9 Why Silly Putty 9 can be stretched a considerable amount when pulled slowly, but snaps when
pulled fast?
9 Why we can load the weight of a fire truck on four ceramic coffee cups, however, ceramic cups
tend to break easily when we drop them on the floor?
9 What materials related factors played an important role in the sinking of the Titanic?
9 What factors played a major role in the 1986 Challenger and the 2003 Columbia space shuttle
accidents?
9 Why does Boeing’s new Dreamliner airplane contain almost 50% composites?
The mechanical properties of materials depend on
their composition and microstructure. In Chapters
2, 3, and 4, we learned that a material’s composi-
tion, nature of bonding, crystal structure, and de-
fects such as dislocations, grain size, etc., have a
profound influence on the strength and ductility of
metallic materials. In this chapter, we will begin to
evaluate other factors that affect the mechanical
properties of materials, such as how lower temper-
atures can cause many metals and plastics to be-
come brittle. Lower temperatures contributed to
the brittleness of the plastic used for the O-rings,
causing the 1986 Challenger accident. In 2003,
the space shuttle Columbia was lost because of an
153

impact of debris on the ceramic tiles and failure
of carbon-carbon composites. Similarly, the spe-
cial chemistry of the steel used on the Titanic and
the stresses associated in the fabrication and
embrittlement of this steel when subjected to
lower temperatures have been identified as fac-
tors contributing to the failure of the ship’s hull.
Some researchers have shown that weaker rivets
and design flaws also contributed to the failure.
The main goal of this chapter is to introduce
the basic concepts associated with mechanical
properties. We will learn basic terms such as
hardness, stress, strain, elastic and plastic de-
formation, viscoelasticity, strain rate, etc. We will
also review some of the basic testing procedures
that engineers use to evaluate many of these
properties. These concepts will be discussed us-
ing illustrations from real-world applications.
6-1 Technological Significance
With many of today’s emerging technologies, the primary emphasis is on the mechan-
ical properties of the materials used. For example, in aircraft manufacturing, aluminum
alloys or carbon-reinforced composites used for aircraft components must be light-
weight, strong, and able to withstand cyclic mechanical loading for a lon g and predict-
able period of time. The latest (2007) Dreamliner passenger aircraft designed by Boeing
uses 50% composites and is 20% more fuel e‰cient. Steels used in the construction of
structures such as buildings and bridges must have adequate strength so that these
structures can be built without compromising safety. The plastics used for manufactur-
ing pipes, valves, flooring, and the like also must have adequate mechanical strength.
Materials such as pyrolytic graphite or cobalt chromium tungsten alloys, used for
prosthetic heart valves, must not fail. Similarly, the performance of baseballs, cricket
bats, tennis rackets, golf clubs, skis, and other sport equipment depends not only on the
strength and weight of the materials used, but also on their ability to perform under an
‘‘impact’’ loading. The importance of mechanical properties is easy to appreciate in
many of these ‘‘load-bearing’’ applications.
In many other applications, the mechanical properties of the material also play an
important role. For example, an optical fiber must have a certain level of strength to
withstand the stresses encountered in its application. A biocompatible titanium alloy
used for a bone implant must have enough strength and toughness to survive in the
human body for many years without failure. Coating on optical lenses must resist
mechanical abrasion. An aluminum alloy or a glass-ceramic substrate used as a base
for building magnetic hard drives must have su‰cient mechanical strength so that it
will not break or crack during operation that requires rotation at high speeds. Simi-
larly, electronic packages used to house semiconductor chips and the thin-film struc-
tures created on the semiconductor chip must be able to withstand stresses encountered
in various applications, as well as those encountered during the heating and cooling of
electronic devices. The mechanical robustness of small devices prepared using micro-
electro mechanical systems (MEMS) and nano-technology is also important. Float glass
used in automotive and building applications must have su‰cient strength and shatter
resistance. Many components designed from plastics, metals, and ceramics must not only
have adequate toughness and strength at room temperature but also at relatively high
and low temperatures.
For load-bearing applications, engineered materials are selected by matching their
mechanical properties to the design specifications and service conditions required of the
C HA P T E R 6 Mechanical Properties: Fundamentals and Testing154

component. The first step in the selection process requires an analysis of the material’s
application to determine its most important characteristics. Should it be strong, sti¤, or
ductile? Will it be subjected to an application involving high stress or sudden intense
force, high stress at elevated temperature, cyclic stresses, corrosive or abrasive condi-
tions? Once we know the required properties, we can make a preliminary selection
of the appropriate material using various databases. We must, however, know how the
properties listed in the handbook are obtained, know what the properties mean, and
realize that the properties listed are obtained from idealized tests that may not apply
exactly to real-life engineering applications. Materials with the same nominal chemical
composition and other properties can show significantly di¤erent mechanical properties
as dictated by microstructure. Furthermore, changes in temperature; the cyclical nature
of stresses applied; the chemical changes due to oxidation, corrosion, or erosion;
microstructural changes due to temperature; the e¤ect of possible defects introduced
during machining operations (e.g., grinding, welding, cutting, etc.); or other factors can
also have a major e¤ect on the mechanical behavior of materials (Chapter 7).
The mechanical properties of materials must also be understood so that we can
process materials into useful shapes using materials processing techniques. Materials
processing, such as the use of steels and plastics to fabricate car bodies, requires a de-
tailed understanding of the mechanical properties of materials at di¤erent temperatures
and conditions of loading, for example, the mechanical behavior of steels and plastics
used to fabricate fuel-e‰cient cars and trucks.
In the sections that follow, we discuss mechanical properties of materials. We will
define and discuss di¤erent terms that are used to describe the mechanical properties of
engineered materials. Di¤erent tests used to determine mechanica l properties of mate-
rials are discussed.
6-2 Terminology for Mechanical Properties
There are di¤erent types of forces or ‘‘stresses’’ that are encountered in dealing with
mechanical properties of materials. In general, we define stress as force per unit area.
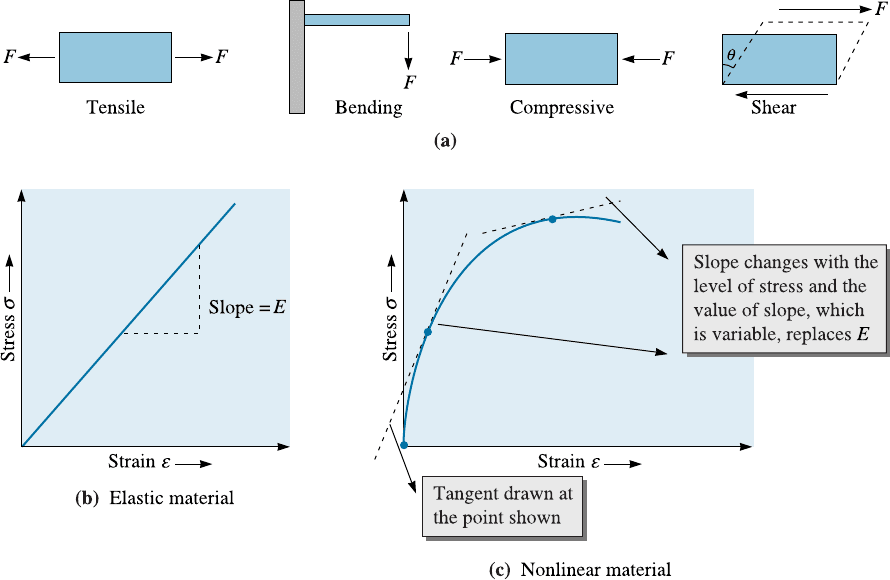
Tensile, compressive, shear, and bending stresses are illustrated in Figure 6-1(a). Strain
is defined as the change in length per unit length. Stress is typically expressed in Pa
(Pascals). Strain has no dimensions and is often expressed as cm/cm.
When discussing stress and strain, it may be useful to think about stress as the
cause and strain as the e¤ect. Typically, tensile and shear stresses are designated by the
symbols s and t, respectively. Tensile and shear strains are represented by the symbols e
and g, respectively. Many load-bearing applications involve tensile or compressive
stresses. Shear stresses are often encountered in the processing of materials using such
techniques as polymer extrusion. Shear stresses are also found in structural applica-
tions. Note that even a simple tensile stress applied along one direction will cause a shear
stress to components in other directions (similar to the situation discussed in Schmid’s
law, Chapter 4).
Elastic strain is defined as fully recoverable strain resulting from an applied stress.
The strain is ‘‘elastic’’ if it develops instantaneously (i.e., the strain occurs as soon as the
force is applied), remains as long as the stress is applied, and disappears as soon as the
force is withdrawn. A material subjected to an elastic strain does not show any perma-
nent deformation (i.e., it returns to its original shape after the force or stress is
removed). Consider stretching a sti¤ metal spring by a small amount and letting go. If
6-2 Terminology for Mechanical Properties 155
the spring goes back quickly (within a few milliseconds or less) to its original dimen-
sions, the strain developed in the spring was elastic.
In many materials, elastic stress and elastic strain are linearly related. The slope of
a tensile stress-strain curve in the linear regime defines the Young’s modulus or modulus
of elasticity (E ) of a material [Figure 6-1(b)]. The units of E are measured in Pascals
(Pa) (same as those of stress). Large elastic deformations are observed in elastomers
(e.g.,natural rubber, silicones), where the relationship between elastic strain and stress is
non-linear. In elastomers, the large elastic strain is related to the coiling and uncoiling
of spring-like molecules (Chapter 16). In dealing with such materials, we use the slope
of the tangent at any given value of stress or strain and consider that as a variable
quantity that replaces the Young’s modulus [Figure 6-1(b)]. The inverse of Young’s
modulus is known as the compliance of the material. Similarly, we define shear modulus
(G ) as the slope of the linear part of the shear stress-shear strain curve.
Permanent or plastic deformation in a material is known as the plastic strain. In this
case, when the stress is removed, the material does not go back to its original shape.
A dent in a car is plastic deformat ion! Note that the word ‘‘plastic’’ here does not refer
to strain in a plastic (polymeric) material, but rather to a type of strain in any material.
The rate at which strain develops in a material is defined as strain rate (
_
e or
_
g for
tensile and shear strain rates, respectively). Units of strain rate are s
1
. You will learn
later in this chapter that the rate at which a material is deformed is important from a
Figure 6-1 (a) Tensile, compressive, shear and bending stresses. (b) Illustration showing how
Young’s modulus is defined for an elastic material. (c) For nonlinear materials, we use the
slope of a tangent as a variable quantity that replaces the Young’s modulus constant.
C HA P T E R 6 Mechanical Properties: Fundamentals and Testing156

mechanical properties perspective. Many materials considered to be ductile behave as
brittle solids when the strain rates are high. Silly Putty
8
(a silicone polymer) is an ex-
ample of such a material. When stretched slowly (smaller rate of strain), we can stretch
this material by a large amount. However, when stretched rapidly (high strain rates), we
do not allow the untangling and extension of the large polymer molecules and, hence,
the material snaps. When the strain rates are low, Silly Putty
8
can show significant
ductility. When materials are subjected to high strain rates we refer to this type of
loading as impact loading.
A viscous material is one in which the strain develops over a period of time and the
material does not go to its original shape after the stress is removed. The development
of strain takes time and is not in phase with the applied stress. Also, the material will
remain deformed when the applied stress is removed (i.e., the strain will be plastic). A
viscoelastic (or anelastic) material can be thought of as a material whose response is
between that of a viscous material and an elastic material. The term ‘‘anelastic’’ is typ-
ically used for metals, while the term ‘‘viscoelastic’’ is usually associated with polymeric
materials. Many polymeric materials (solids and molten) are viscoelastic. A common
example of a viscoelastic material is Silly Putty
8
.
In a viscoelastic material, the development of a permanent strain is similar to that
in a viscous material. However, unlike a viscous material, when the applied stress is
removed, part of the strain will recover over a period of time. Recovery of strain refers
to a change in shape of a material after the stress causing deformation is removed. A
qualitative description of development of strain as a function of time in relation to an
applied force in elastic, viscous, and viscoelastic materials is shown in Figure 6-2. In
viscoelastic materials held under constant strain, if we wait, the level of stress decrease s
over a period of time. This is known as stress relaxation. Recovery of strain and stress
relaxation are di¤erent terms and should not be confused. A common example of stress
relaxation is the nylon strings in a tennis racket. We know that the level of stress, or the
‘‘tension’’, as the tennis players call it, decreases with time.
While dealing with molten materials, liquids, and dispersions, such as paints or
gels, a description of the resistance to flow under an applied stress is required. If the
relationship between the applied stress (t) and shear strain rate (
_
g) is linear, we refer to
that material as Newtonian. The slope of the shear stress versus the steady-state shear
strain rate curve is defined as the viscosity (h) of the material. Water is an example of a
Newtonian material. The following relationship defines viscosity:
t ¼ h
_
g ð6-1Þ
The units of h are Pa-s (in the SI system) or Poise (P) or
g
cm s
in the cgs system.
Sometimes the term centipoise (cP) is used, 1 cP ¼ 10
2
P.
Conversion between these units is given by 1 Pa-s ¼ 10 P ¼ 1000 cP.
The kinematic viscosity (n) is defined as:
n ¼ h=r ð6-2Þ
where viscosity (h) is in Poise and density (r) is in g/cm
3
. The kinematic viscosity unit
is in Stokes (St). In this, St is cm
2
/s. Sometimes the unit of centiStokes (cSt) is used,
1 cSt ¼ 10
2
St.
For many materials the relationship between shear stress and shear strain rate is
nonlinear. These materials are non-Newtonian. The stress versus steady state shear
strain rate relationship in these materials can be described as:
t ¼ h
_
g
m
ð6-3Þ
where the exponent m is not equal to 1.
6-2 Terminology for Mechanical Properties 157
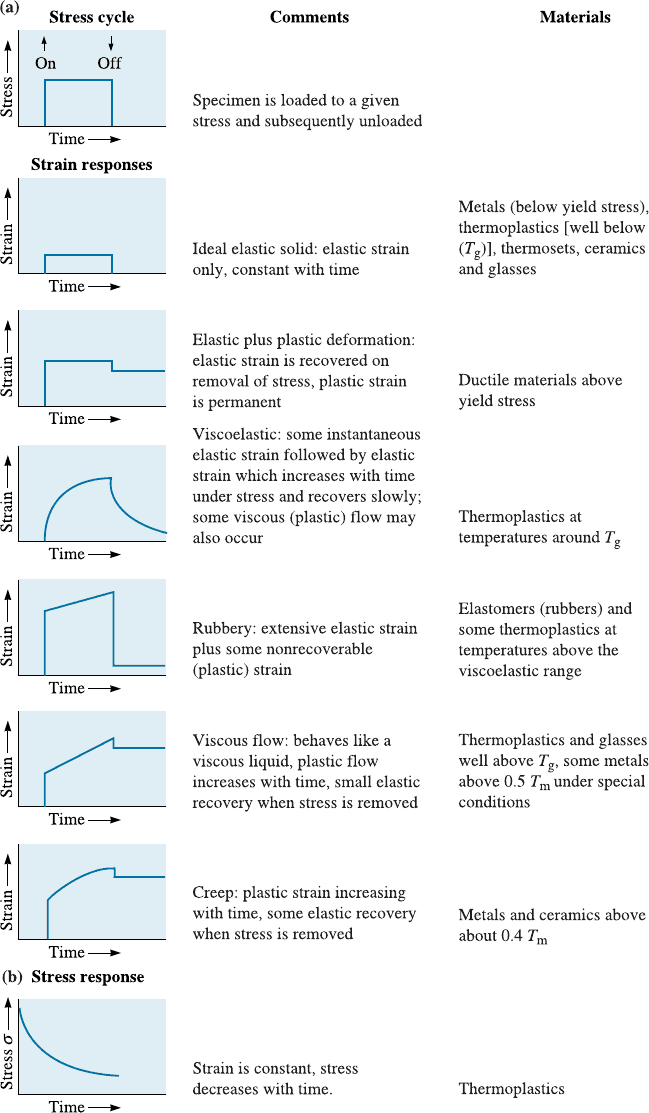
Figure 6-2 (a) Various types of strain response to an imposed stress. (This article was
published in Materials: Principles and Practice, C. Newey and G. Weaver (Eds.), Figure 6-9,
p. 300. Copyright > Butterworth-Heinemann (1991).) (b) Stress relaxation in a viscoelastic
material. Note the y -axis is stress. Strain is constant.
C HA P T E R 6 Mechanical Properties: Fundamentals and Testing158
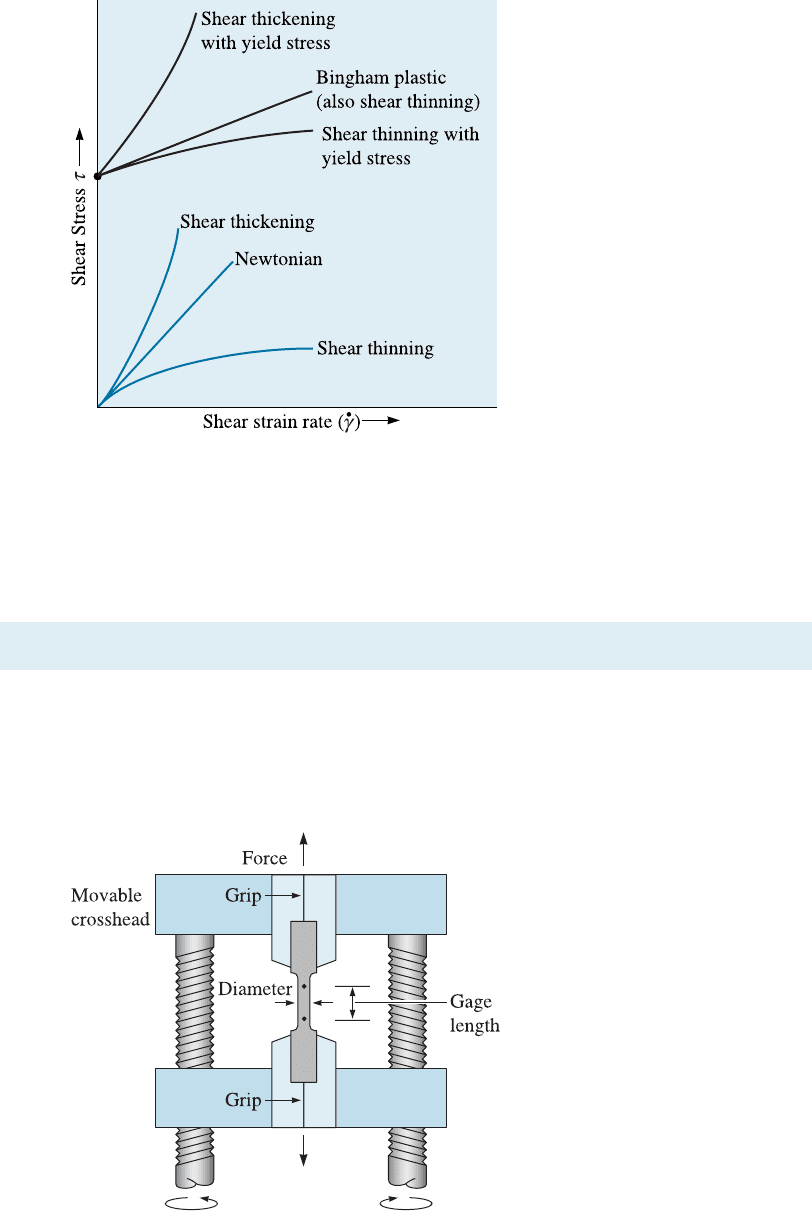
Non-Newtonian materials are classified as shear thinning (or pseudoplastic)orshear
thickening (or dilatant). The relationships between the shear stress and shear strain rate
for di¤erent types of materials are shown in Figure 6-3.
In the sections that follow, we will discuss di¤erent mechanical properties of solid
materials and some of their testing methods to evaluate these properties.
6-3 The Tensile Test: Use of the Stress-Strain Diagram
The tensile test is popular since the properties obtained could be applied to design di¤er-
ent components. The tensile test measures the resistance of a material to a static or
slowly applied force. The strain rates in a tensile test are very small (
_
e ¼ 10
4
to 10
2
s
1
).
A test setup is shown in Figure 6-4; a typical specimen has a diameter of 1.263 cm and a
Figure 6-3
Shear stress-shear strain rate
relationships for Newtonian and
non-Newtonian materials.
Figure 6-4
A unidirectional force is applied to a
specimen in the tensile test by
means of the moveable crosshead.
The cross-head movement can be
performed using screws or a
hydraulic mechanism.
6-3 The Tensile Test: Use of the Stress-Strain Diagram 159