Zuo-Guang. Ye Advanced Dielectric Piezoelectric and Ferroelectric Materials: Synthesis, Characterisation and Applications
Подождите немного. Документ загружается.

Handbook of dielectric, piezoelectric and ferroelectric materials910
this link. The ferroelectric transition (x < x
f–r
) follows a strong increase of
the interaction (or correlation length) at T
C
. In the following, this optimal
ferroelectric correlation length will be called ξ
∞
. In the real world, this
correlation length is not infinite as it should theoretically be. The possible
occurrence of limited correlation length for T>>T
C
, well in the paraelectric
state, is not discussed here. In the soft mode picture of BaTiO
3
, the infinite
correlation length at T
C
results from the condensation of a phonon mode
which mainly includes the Ti–O bond oscillations. An alternative model
takes into account the correlated Ti–O chains which are present at all
temperatures [65]. In both cases, the Ti–O bonds are the key origin to
ferroelectricity. These bonds are exactly what is disrupted on substituting
Zr
4+
for Ti
4+
, 2Nb
5+
for Ba
2+
+ 2Ti
4+
and Li
+
–3F
–
for Ti
4+
–3O
2–
. The perturbation
strength ∆P increases in the order of the substitutions. As x increases, the
ferroelectric line T
C
= f (x) for x < x
f–r
stems from a decrease of the maximal
correlation length ξ
max
(ξ
max
∝ ξ
∝
/x∆P). Formally, this equation means that
there are two ways to decrease the ferroelectric correlation length and thus
to decrease the ferroelectric transition temperature: increase of the number
of substituted defects x and increase of the strength of perturbation of each
defect ∆P. The former parameter leads to the negative slope of T
C
= f (x) and
the latter increases the slope of this line. This is qualitatively consistent with
the observations in the three studied families.
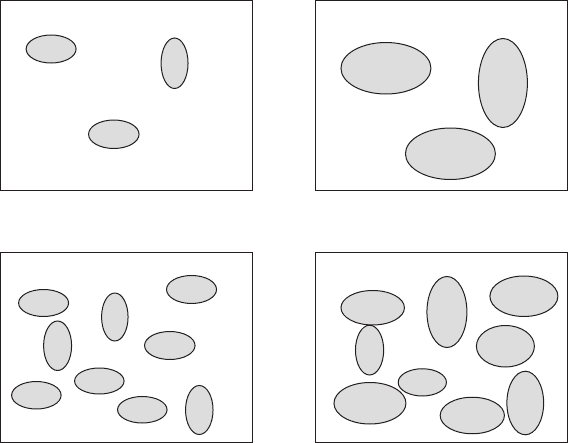
The next step is to consider that each substituted point defect perturbs a
part of its surrounding host BaTiO
3
lattice. Because of the anisotropic nature
of this lattice, such polarised clusters are expected to have an ellipsoid shape.
Using the Ornstein Zernicke formalism, it can be thought that this perturbation
is exponentially decreasing along the radii of these ellipsoids as ∝ ∆P exp
(– r/ξ) [66]. It is beyond the scope of the present section to exactly define
this exponential decrease. What can be said is that the maximum size of
these perturbed clusters is reached when ξ = ξ
max
, i.e. at T
C
. This is the key
point: not only the maximum correlation length ξ
max
drives the host matrix
properties but it also sets the size of the perturbed clusters around each
substituted defect. Since, in this assumption, ξ
max
decreases both with increasing
x and ∆P, the picture which arises is the following (Fig. 30.13):
• For x < x
f–r
, the density of impurity-induced clusters is very small and
the BaTiO
3
host matrix properties are kept only with a decrease of the
maximal correlation length ξ
max
. At the same time, each cluster can
reach its maximum size (Fig. 30.13, upper row).
• When x~x
f–r
, small clusters start to interact with each other. In this
model, x
f–r
is the right point where all the macroscopic sample is filled
by impurity-induced microscopic clusters. This interaction is the source
for the observed dielectric dispersion.
• When x > x
f–r
, the maximal correlation length cannot be reached and the
WPNL2204
Lead-free relaxors 911
Vogel–Fulcher temperature is the temperature where all clusters stop
relaxing. The clusters can no longer reach their maximum size and,
because of the interaction among clusters, a size distribution sets in (Fig.
30.13, lower row).
Without a quantitative evaluation of ∆P and ξ(x), it is not possible to go
further in the quantitative description of the ferroelectric–relaxor crossover.
It can, however, be explained why the ferroelectric and relaxor phase diagrams
are aligned: this is simply because the BaTiO
3
ultimate correlation length ξ
∞
appears in all the spatial parameters that were defined. In other words, the
BaTiO
3
correlation length imprints both the matrix and cluster properties;
the Ti–O bond oscillations are the key mechanisms. This picture is consistent
with the one which was drawn on the basis of high-pressure Raman scattering
experiments and which uses the BaTiO
3
correlation length [58]. Also, it can
be recalled that the soft-mode related cluster sizes and the Ornstein Zernicke
function were used in the case of lithium-substituted KTaO
3
[67, 68]. From
these pioneering works, several attempts have been made to transfer the
cluster model to lead-containing relaxors. It seems that the continuous crossover
T
>>
T
C
,
X
<
X
(f–r)
, ξ<<ξ
max
T
~
T
C
,
X
<
X
(f–r)
, ξ~ξ
max
T
>>
T
VF
,
X
>
X
(f–r)
, ξ<<ξ
max
T
~
T
VF
,
X
>
X
(f–r)
, ξ
average
<ξ
max
30.13
Sketch of the impurity-induced clusters in the BaTiO
3
host
lattice. On cooling to the transition temperature, the clusters can
reach their maximum extension when their density is low leading to
a ferroelectric state (upper row). When their density is high, this
optimal size cannot be reached and a distribution of cluster size sets
in, leading to a relaxor state (lower row).
WPNL2204
Handbook of dielectric, piezoelectric and ferroelectric materials912
that was evidenced in lead-free compounds is in favour of the cluster model
of relaxors. However, the comparison between lead-containing and lead-free
relaxors is limited since:
• a number of features of lead-containing relaxors do not appear in lead-
free relaxors (diffuse scattering, high-pressure-induced Raman lines,…);
• the electronic lone pair of lead leads to very peculiar Pb dynamics which
is not present in Ba-based compounds;
• a continuous crossover from ferroelectric to relaxor states in Pb-based
compounds is missing. There is perhaps one example of such crossover
which is PbTiO
3
: La for which x
f–r
is about 0.20. However, this is very
different from the standard relaxors where the substitution has single
discrete values (0.33/0.66 or 0.50/0.50).
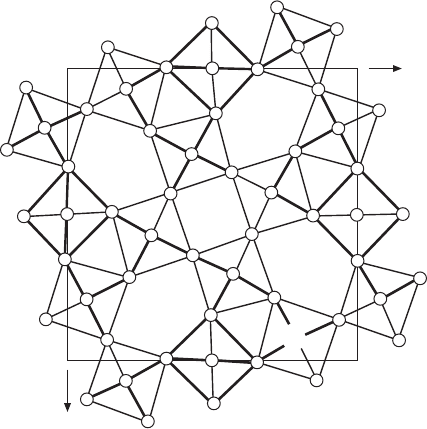
30.5 Lead-free relaxors with tetragonal bronze
(TTB) structure
Figure 30.14 shows a schematic representation of the TTB structure projection
along the [001] direction. For a general formulation A
2
BC
2
M
5
X
15
(X = O,
F), large cations (e.g. Na
+
, K
+
, Sr
2+
, Ba
2+
, Pb
2+
, La
3+
, Bi
3+
, …) occupy the
15-CN (A) and the 12-CN (B) sites, small cations such as Li
+
are in the 9-
CN (C) sites and small and highly charged cations (e.g. Nb
5+
, Ta
5+
, …) are
y
x
M
B
C
A
30.14
Schematic projection of the anionic TTB structure along the 4-
fold
c
-axis (A, B and C correspond to cationic sites with 15, 12 and 9
coordination number).
WPNL2204

Lead-free relaxors 913
in the octahedral (M) site. The present section is devoted to selected lead-
free relaxor compounds of TTB-type structure [69, 70].
The relaxor behaviour was demonstrated in various TTB compositions
including niobates, tantalates, niobo-tantalates and niobo-titanates (Table
30.4) [25, 71, 72]. There was a typical relaxor temperature dependence of
′
ε
r
and
′′
ε
r
. In addition, there was a deviation from the Curie–Weiss law and the
shift of T
m
to lower values for decreasing frequencies obeys the Vogel–
Fulcher law [60, 73].
Table 30.4
Some lead-free TTB relaxor compositions
Relaxor compositions
T
m
(± 10K) ∆
T
m
(K)
(at 1kHz)
K
2
LaNb
5
O
15
165 22
K
2
BiNb
5
O
15
220 80
BaLa䊐Nb
5
O
15
203 55
BaBi䊐Nb
5
O
15
295 75
BaLa
2/3
䊐
1/3
NaNb
5
O
15
210 34
BaLaNa(Nb
4
Ti)O
15
171 41
BaLaK(Nb
4
Ti)O
15
146 13
Ba
1.5
La䊐
0.5
(Nb
4
Ti)O
15
190 35
Ba
1.5
Bi䊐
0.5
(Nb
4
Ti)O
15
255 65
Ba
2
La(Nb
3
Ti
2
)O
15
185 20
Ba
2
Bi(Nb
3
Ti
2
)O
15
270 25
Sr
2
NaTa
5
O
15
120 25
Sr
2
KTa
5
O
15
<80 ∗
Ba
2
NaTa
5
O
15
<80 ∗
Ba
2
KTa
5
O
15
<80 ∗
K
3
LiNb
5
O
14
F 210 40
Ba
2.25
䊐
0.75
Nb
5
O
14.5
F
0.5
175 30
SrK
2
Nb
5
O
14
F 112 16
BaNa
2
Nb
5
O
14
F 140 17
Ba
5
x
/2
Bi
5(1–
x
)
Nb
5
O
15
(0.52 ≤
x
≤ 0.80) 257 ≥
T
m
≥ 251 41 (0.52) to 81 (0.80)
Sr
2
Na(Nb
1–
x
Ta
x
)
5
O
15
(0.40 ≤
x
≤ 1) 222 ≥
T
m
≥ 120 20 (0.40) to 25 (1)
Sr
2
K(Nb
1–
x
Ta
x
)
5
O
15
(0.16
≤
x
≤ 1) 263 ≥
T
m
≥ 80 21 (0.16) to ∗ (1)
Ba
2
Na(Nb
1–
x
Ta
x
)
5
O
15
(0.65 ≤
x
≤ 1) 260 ≥
T
m
≥ 80 6 (0.65) to ∗ (1)
Ba
2–
x
Na
1+
x
Nb
5
O
15–
x
F
x
(0.31 ≤
x
≤ 1) 250 ≥
T
m
≥ 140 40 (0.31) to 17 (1)
Ba
2
Na(Nb
5–
x
Ti
x
)O
15–
x
F
x
(0.31 ≤
x
≤ 0.50) 265 ≥
T
m
≥ 168 15 (0.31) to 30 (0.50)
Sr
2–
x
Na
1+
x
Nb
5
O
15–
x
F
x
(0.075
≤
x
≤ 0.35) 320 ≥
T
m
≥ 222 10(0.075) to 20(0.35)
Sr
2–
x
K
1+
x
Nb
5
O
15–
x
F
x
(0.20 ≤
x
≤ 1) 290 ≥
T
m
≥ 112 15 (0.20) to 16 (1)
Sr
2.5(1–
x
)
Ba
2.5
x
䊐
0.5
Nb
5
O
15
** ** **
∆
T
m
=
T
m
(10
5
Hz) –
T
m
(10
2
Hz). In the case of solid solutions, the given values of
T
m
correspond to the
x
limit values.
* Unknown values due to the experimental low temperature limitation of our
dielectric measurements.
** A relaxor behaviour was announced by previous authors; due to some
disagreements between them, the values of
x
,
T
m
and ∆
T
m
are not given here. This
is due to the modulated distribution of Sr
2+
and Ba
2+
which can vary versus the
different types of preparation between the various samples.
WPNL2204
Handbook of dielectric, piezoelectric and ferroelectric materials914
Some solid solutions situated between niobate oxide ferroelectric and
relaxor were also studied. Such is the case with A
2
B(Nb
1–x
Ta
x
)
5
O
15
. The
relaxor behaviour occurs for the highest values of x. Figure 30.15 shows, as
an example, the variations of T
C
(0 ≤ x < 0.16) and T
m
(0.16 ≤ x ≤ 1) for
ceramics with composition Sr
2
K(Nb
1–x
Ta
x
)
5
O
15
. Both values decrease when
the tantalum rate increases.
This is also the case with the Sr
2
KNb
5
O
15
–SrK
2
Nb
5
O
14
F and Ba
2
NaNb
5
O
15
–
BaNa
2
Nb
5
O
14
F systems; for the compositions close to the oxide, the behaviour
is ferroelectric while it becomes relaxor when the fluorine rate and thus the
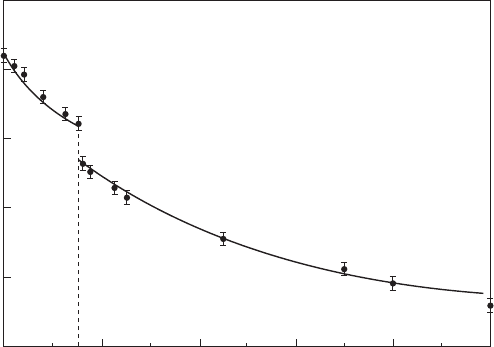
sodium or potassium rate are high enough [74–76]. Figure 30.16 shows as an
example the variations of T
C
(0 ≤ x ≤ 0.25) and T
m
(0.20 ≤ x ≤ 1) for the
barium–sodium system. It is interesting to note that both relaxor and
ferroelectric phases coexist for compositions (0.20 ≤ x ≤ 0.25), giving rise to
the transition sequence relaxor–ferroelectric–paraelectric on heating. Here
also both values of T
C
and T
m
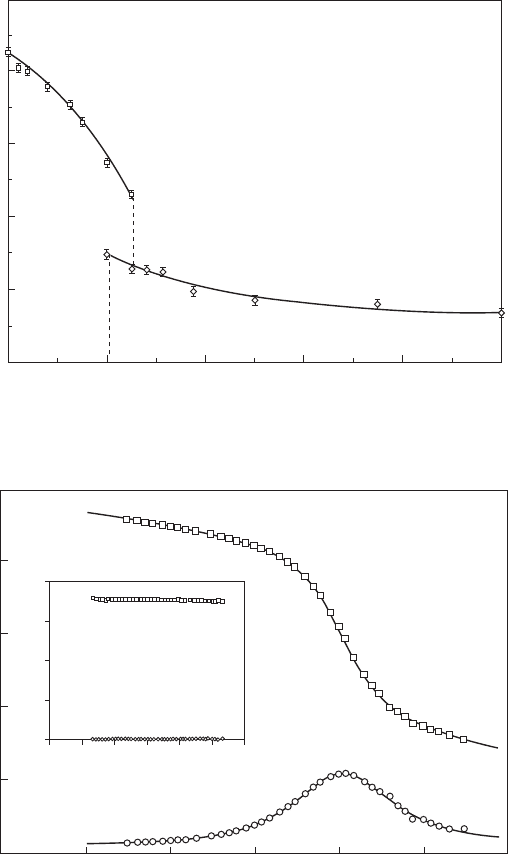
decrease when x increases. Elsewhere the
frequency dependence of the permittivities of a ceramic with a composition
BaNa
2
Nb
5
O
14
F clearly displays a frequency relaxation at 77K, while it
disappears at 300K, i.e. for T > T
m
(T
m
= 140K at 10
3
Hz) (Fig. 30.17).
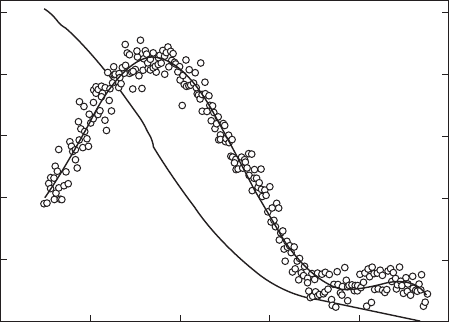
Figure 30.18 shows the temperature dependence of the pyroelectric
coefficient p for a ceramic with composition Sr
1.341
Ba
1.097
Nb
4.875
Sn
0.125
O
15
(SBNS). It shows a broad maximum around 240K. Above 240K, the
pyroelectric signal decreases to values close to zero at approximately 350K.
The variation of P
s
of the sample was obtained by integration of p vs.
T
(K)
500
400
300
200
100
0
T
C
T
m
Paraelectric
Ferro.
Relaxor
0 0.2 0.4 0.6 0.8 1
x
30.15
Variation of transition temperatures with
x
for ceramics with
composition Sr
2
K(Nb
1–
x
Ta
x
)
5
O
15
.
WPNL2204
Lead-free relaxors 915
temperature (Fig. 30.18). The slow decrease of the spontaneous polarisation
associated to a very noisy pyroelectric signal should be considered as
characteristic of a relaxor ferroelectric: the decrease of the polarisation is
associated to a progressive relaxation of polar microdomains. The switching
I
(K)
1000
800
600
400
200
0
T
C
Ferroelec.
Paraelectric
T
m
Relaxor
0 0.2 0.4 0.6 0.8 1
x
30.16
Variation of transition temperatures with x for ceramics with
composition Ba
2–
x
Na
1+
x
Nb
5
O
15–
x
F
x
.
ε
r
1000
800
600
400
200
0
0123456
log
f
(Hz)
′
ε
r
T
= 77 K
T
= 300 K
′
ε
r
′′
ε
r
0 1 2 3 log
f
(Hz) 6
′′
ε
r
800
600
400
200
0
ε
r
30.17
Frequency dependences of
′
ε
r
and
′′
ε
r
for a ceramic with
composition BaNa
2
Nb
5
O
14
F.
WPNL2204
Handbook of dielectric, piezoelectric and ferroelectric materials916
of the independent dipoles, isolated in this particular microstructure, occurs
then randomly, giving rise to a very high noise level in the pyroelectric
signal.
Some of these compositions were previously prepared and characterised.
They were announced as ferroelectric, because the measurements had been
performed only at one frequency (1kHz) and not at various frequencies as
required for the studies of relaxor properties. It was the automation of dielectric
measurements performed with impedance analysers which allowed the relaxor
behaviour to be revealed.
As in the perovskites, the relaxor behaviour appears in the TTB-type
compounds when at least two ions occupy the same crystallographic site.
The coexistence of cations seems to be as favourable on the A site as on the
M site. In addition, at least one ferroelectrically active cation (Ti
4+
, Nb
5+
,
Ta
5+
) must be present on the octahedral site.
The relaxor behaviour can be due to a cationic disorder on the A site,
whatever the coupled substitution ensuring the electrical neutrality; this is
the case with BaLaNb
5
O
15
when Ba
2+
and La
3+
occupy only the A site.
Ba
2
NaNb
5
O
15
, in which the same two Ba
2+
cations
occupy the A site and Na
+
occupies the B sites, is a ferroelectric. On the contrary, BaNa
2
Nb
5
O
14
F is a
relaxor. The crystal structure of this last compound is in good agreement
with the dielectric properties, i.e. the A-site is statistically occupied by equal
quantities of Ba
2+
and Na
+
, thereby giving rise to a cationic disorder on the
A site while the B site is filled by Na
+
cations [77, 78]. In addition there is
coexistence of F
–
and O
2–
on the anionic sites.
p
P
s
150 200 250 300 350 400
T
(K)
p
(nC/cm
2
K)
25
20
15
10
5
0
2.5
2.0
1.5
1.0
0.5
0
P
s
(µC/cm
2
)
30.18
Thermal variations of pyroelectric coefficient
p
and
spontaneous polarization
P
s
in SBNS.
WPNL2204

Lead-free relaxors 917
Concerning the Ta–Nb substitution, the replacement of Nb
5+
, highly
polarisable, by Ta
5+
transforms the macroscopic polarisation into a local one.
This results in a relaxor state as the long-range order is not induced by a
local dipolar cationic order. The higher the associated cationic order in the
A and B sites, the higher the Ta–Nb substitution rate leading to relaxor
behaviour (Table 30.4): e.g. x = 0.16 for Sr
2
K(Nb
1–x
Ta
x
)
5
O
15
and x = 0.65 for
Ba
2
Na(Nb
1–x
Ta
x
)
5
O
15
. In fact there is no ambiguity regarding the disordered
distribution of the two small Sr
2+
cations and the single large K
+
one, nor
regarding the ordered distribution of the two large Ba
2+
cations and the
single small Na
+
ones, since both occur in two large A sites and in one
smaller B one.
For oxyfluorides, the F
–
–O
2–
substitution is coupled with the cationic
one in order to ensure electric neutrality. The origin of relaxor behaviour
comes from cationic or/and anionic substitutions when there are two different
cations on the same crystallographic site, e.g. Ba
2–x
Na
1+x
Nb
5
O
15–x
F
x
, the A
site being filled by both Ba
2+
and Na
+
and the X site by both O
2–
and F
–
for
x > 0 [79].
However, it seems that the relaxor behaviour can be attributed to the only
anionic F
–
–O
2–
substitution in the lack of different cations on the same site,
e.g. K
3
LiNb
5
O
14
F: owing to their very different sizes, the 3K
+
and the Li
+
cations occupy only the (2A + B) sites and the C site, respectively. The
relaxor behaviour is induced by a dilution of the oxygen network leading to
a local polarisation which breaks the long-range order usually at the origin
of ferroelectric properties.
The influence of the heat treatments of the ceramics was studied with
composition BaNa
2
Nb
5
O
14
F (Table 30.5). The value of ∆T
m
increased from
9 to 60 when the sintering of the ceramics was followed by either slow
cooling (favouring order) (50K/h), medium cooling (300K/h) or quenching
in liquid nitrogen (favouring disorder). This result is in good agreement
with the relationship between ionic disorder and relaxor behaviour. As a
comparison, similar results were obtained on Pb(Sc
1/2
Ta
1/2
)O
3
(PST): the
ceramic was a ferroelectric after a long annealing while it was a relaxor after
quenching [80].
Table 30.5
Values of
T
m
and ∆
T
m
for ceramics with composition
BaNa
2
Nb
5
O
14
F obtained after different cooling treatments
Slow cooling Medium cooling Quenching
T
m
(K) at 0.1 kHz 142 138 101
T
m
(K) at 1kHz 143 141 111
T
m
(K) at 10 kHz 147 145 122
T
m
(K) at 100kHz 151 155 161
∆
T
m
(K) 9 17 60
WPNL2204
Handbook of dielectric, piezoelectric and ferroelectric materials918
30.6 Ceramics containing bismuth
The aim of the present section is to discuss the relaxor properties of the
ceramics containing bismuth. The Na
0.5
Bi
0.5
TiO
3
-derived compositions are
not considered here, nor is the perovskite-type solid solution between ATiO
3
(A = Ca, Sr, Ba) and Na
1/2
Bi
1/2
TiO
3
[35, 81].
30.6.1 Ceramics of perovskite type
The Ba
1–x
A
2x/3
䊐
x/3
TiO
3
(A = La, Bi) ceramics showed ferroelectric properties
for compositions very close to BaTiO
3
[82]. Relaxor behaviour occurred for
values of x ≥ 0.15. However, both the values of T
C
or T
m
were higher for Bi-
than for La- substitution: e.g. T
m
< 80K in Ba
0.8
La
0.4/3
TiO
3
, T
m
= 165K in
Ba
0.8
La
0.2/3
Bi
0.2/3
TiO
3
and T
m
= 292K in Ba
0.8
Bi
0.4/3
TiO
3
. This is not related
to a steric effect, since the apparent cationic sizes are very close
( = 1.16Å, = 1.17Å
La
3+
Bi
3+
rr
in 8-CN; these values are given for 8-CN, although
the cations are in the 12-CN site of the perovskite, because no corresponding
value is given for Bi
3+
) [83]. The real cause is undoubtedly related to the
lone pair, which leads to the non-spherical and strongly polarised Bi
3+
cation.
Such an effect is well known, for example, in the case of the influence of
Pb
2+
(also possessing a lone pair) on the T
C
variation of Ba
1–x
Pb
x
TiO
3
: T
C
(BaTiO
3
) = 400K, T
C
(PbTiO
3
) = 763K [84–87].
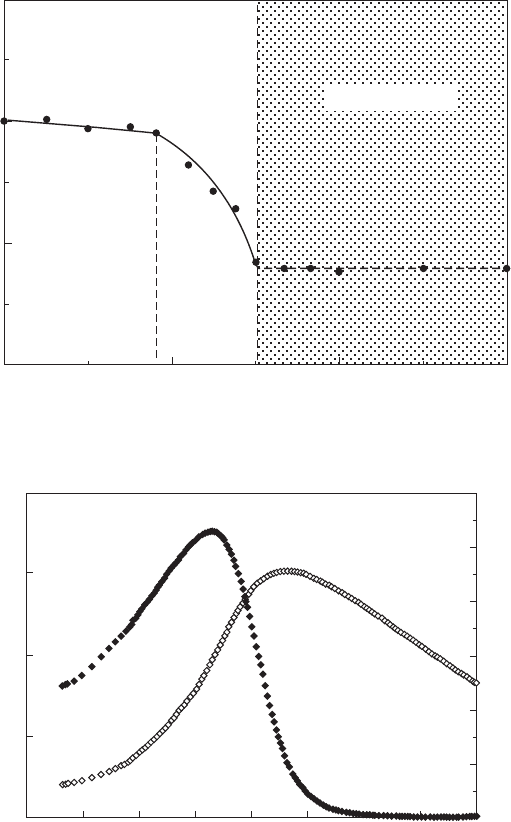
For ceramics with composition Ba
1–x
Bi
2x/3
TiO
3
, for 0 ≤ x < 0.09, i.e. in
the ferroelectric region, the value of T
C
decreases only very slowly as x
increases (Fig. 30.19). Indeed, two antagonist effects are in competition. The
replacement of the big Ba
2+
cation by the smaller Bi
3+
and the creation of
cationic vacancies should lead to a decrease of T
C
( = 1.42Å, = 1.17Å
Ba
3+
Bi
3+
rr
in 8-CN) [83]. In contrast, the introduction of Bi
3+
with its lone pair leads to
an increase of T
C
. The resultant of these two effects is probably responsible
of the relative stability of T
C
with x. For compositions 0.09 ≤ x ≤ 0.15, the
nanostructural disorder which characterises the relaxor behaviour is less
sensitive to the local electronic configuration of Bi
3+
, leading thus to a
stronger decrease of T
m
with x [1]. Figure 30.20 shows the temperature
dependence of
′
ε
r
and the dissipation factor tan δ =
′′ ′
εε
rr
/
at 1kHz for a
ceramic with composition corresponding to x = 0.15. The main dielectric
relaxor characteristics ∆T
m
and ∆
′′
εε
rr
/ increase as the 2/3 Bi
3+
–Ba
2+
substitution rate increases (Table 30.6). This is due of course to the strong
composition heterogeneity that exacerbates the relaxor effect. This was typically
the case in the lead perovskite relaxor PMN where local 1:1 order between
niobium and magnesium atoms generated ordered regions surrounded by
rich niobium polar regions. The heterogeneity thus created induced the relaxor
behaviour commonly correlated with nanoscale spontaneous polarisation
[1]. The present result is of great interest for obtaining relaxor compositions
at temperatures close to 300K for use as lead-free capacitors, dielectrics or
WPNL2204
Lead-free relaxors 919
actuators. The value of T
m
corresponding to x = 0.15 is 288 K (at 1 kHz),
which can be compared with that of the well-known lead-containing PMN
(T
m
= 265K).
Another interesting study concerns ceramics with compositions
Ba
0.9
Bi
0.067
䊐
0.033
(Ti
1–x
Zr
x
)O
3
, i.e. with substitutions on both 6-CN and 12-
′
ε
r
4000
3000
2000
1000
0
tan δ
′
ε
r
50 100 150 200 250 300 350 400 450
T
(K)
tan δ
0.12
0.10
0.08
0.06
0.04
0.02
0.00
30.20
Temperature dependences of
′
ε
r
and tan δ for a ceramic with
composition Ba
0.85
Bi
0.10
TiO
3
, at 1kHz.
Paraelectric
T
C
T
m
Multi-phase zone
Ferroelectric
Relaxor
0 0.1 0.2 0.3
x
T
(K)
500
400
300
200
30.19
Variation of
T
C
or
T
m
with
x
for ceramics of Ba
1–
x
Bi
2
x
/3
TiO
3
composition.
WPNL2204