Zuo-Guang. Ye Advanced Dielectric Piezoelectric and Ferroelectric Materials: Synthesis, Characterisation and Applications
Подождите немного. Документ загружается.

Handbook of dielectric, piezoelectric and ferroelectric materials900
• For homovalent substitutions in both A and M sites (e.g.
Ba
1–x
Ca
x
(Ti
1–x
Zr
x
)O
3
), the sequence was similar to the previous one, but
the composition limits of the various phase zones are of course different.
• For heterovalent substitutions in the A site (e.g. Ba
1–x
(La
x/2
K
x/2
)TiO
3
,
Ba
1–x
A
2x/3
䊐
x/3
TiO
3
(A = La, Bi)), the transition sequence was the same
as that of BT up to relatively high values of x (e.g. x ≤ 0.20 for
Ba
1–x
(La
x/2
K
x/2
)TiO
3
). For higher values of x, a relaxor behaviour was
observed. The system xBaTiO
3
–(1 – x)Na
1/2
Bi
1/2
TiO
3
shows a wide relaxor
solid solution (0.20 ≤ x ≤ 0.80). The value of T
m
increases with x.
However, the relaxor phase was reported to be tetragonal [35].
• For heterovalent substitutions in both A and M sites (e.g.
Ba
1–x
K
x
(Ti
1–x
M
x
)O
3
, Ba
1–x
Na
x
(Ti
1–x
Nb
x
)O
3
) or in both M and X sites
(e.g. Ba(Ti
1–x
Li
x
)O
3–3x
F
3x
), the relaxor properties were observed from
values of x as small as 0.05, i.e. for small substitution rates [32, 36–41].
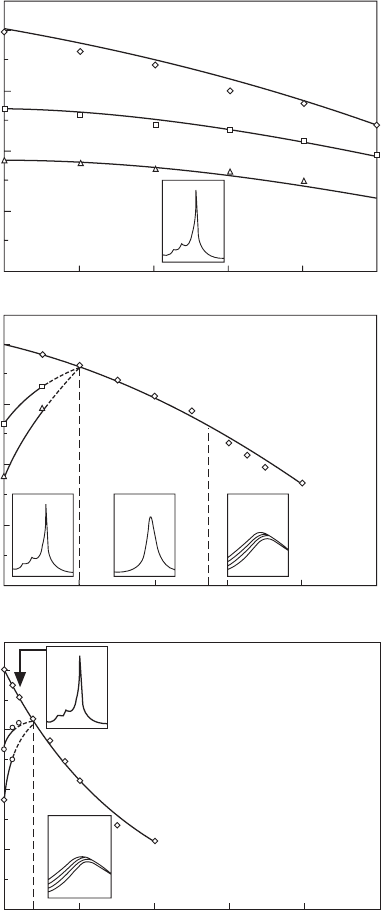
Figure 30.4 shows the various types of behaviour depending on the type
of ionic substitution from BaTiO
3
.
30.2.2 Relaxor characteristics in solid solutions
The relaxor characteristics (∆T
m
= T
m
(100kHz) – T
m
(0.1kHz),
∆
′′ ′
εε ε
rr r
/ = [ (0.1 kHz)
–
′
ε
r
(100kHz)]/
′
ε
r
(0.1 kHz) (at T
m
) become more
significant as the composition deviates from BaTiO
3
. Moreover, the
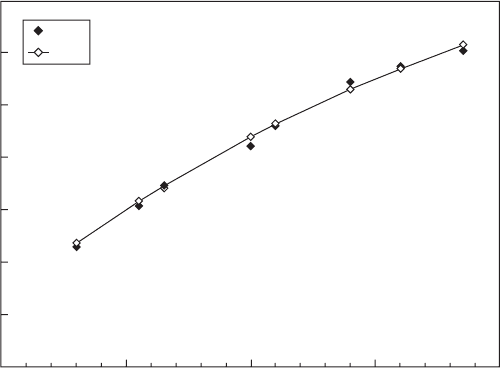
Exp.
Cal.
Log [
f
(Hz)]
14
12
10
8
6
4
2
0
190 195 200 205 210
T
m
(K)
30.3
Variation of log
f
with
T
m
for a ceramic with composition
Ba(Ti
0.65
Zr
0.35
)O
3
.
WPNL2204
Lead-free relaxors 901
T
(K)
400
300
200
100
0
(a)
T
(K)
400
300
200
100
0
x
1
x
2
(b)
T
(K)
400
300
200
100
0
x
1
x
0 0.1 0.2 0.3 0.4 0.5
(c)
30.4
Composition dependence of the transition temperatures for
homovalent substitutions in the A site (e.g. Ba
1–
x
Sr
x
TiO
3
) (a), for
homovalent substitutions in the B site (e.g. BaTi
1–
x
Zr
x
O
3
) (b) and for
heterovalent substitutions (e.g. Ba
1–
x
K
x
(Ti
1–
x
Nb
x
)O
3
) (c). The
temperature dependences of
′
ε
r
are shown on insets.
WPNL2204
Handbook of dielectric, piezoelectric and ferroelectric materials902
composition range of solid solutions showing the relaxor behaviour depends
on the type of substitution. Table 30.2 gives comparative values of x for the
same shift of T
m
(∆T
m
= 10K):
• For homovalent substitutions in the A site or for all compositions very
close to BaTiO
3
, no relaxor behaviour was detected.
• For homovalent substitutions in the M site, the equal charge of the
cations (e.g. Ti
4+
and Zr
4+
) requires a high substitution rate (x = 0.35).
• Coupled homovalent substitutions in both A and M sites generate higher
heterogeneity, leading to relatively lower values of x (x = 0.225).
• Concerning heterovalent substitutions in the A site, the value of x is
nevertheless high, because even for different charges, the relaxor effect
is not enhanced by substitutions in such a site.
• For heterovalent substitutions in the M site, whatever the coupled
substitutions in other sites A or X, in order to respect electrical neutrality,
the values of x are the lowest. This implies that the relaxor effect is
mainly dependent on heterovalent substitutions in this M site.
The values of T
dev.
– T
m
(see Fig. 30.2) which characterise the diffusivity
of the transition and consequently the relaxor behaviour, are in the range
100–150K for the compositions listed in Table 30.2.
30.2.3 Relaxor compositions in some ternary systems
Large solid solution zones with compositions relatively close to BaTiO
3
and
with a derived perovskite structure were evidenced in some ternary systems:
BaTiO
3
–BaZrO
3
–CaTiO
3
, BaTiO
3
–KNbO
3
–CaTiO
3
, BaTiO
3
–BaZrO
3
–CaLiF
3
,
BaTiO
3
–BaZrO
3
–BaLiF
3
and BaTiO
3
–BaZrO
3
–La
2/3
TiO
3
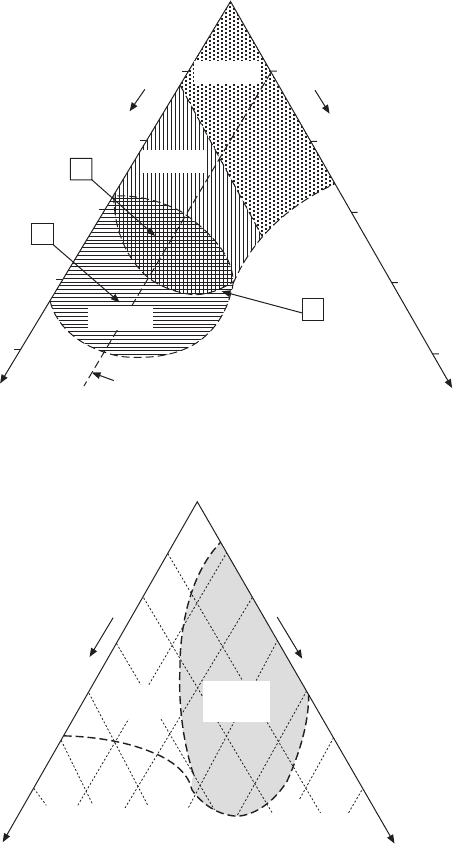
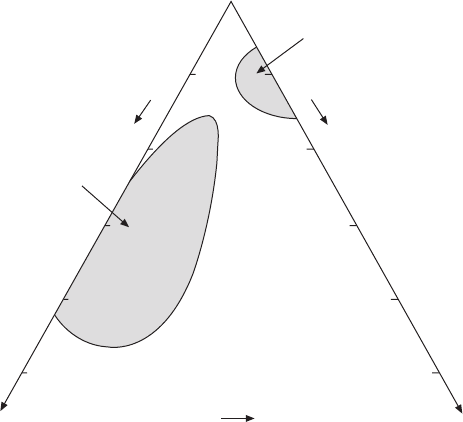
[34, 42–46]. Figures
30.5, 30.6 and 30.7 show, as examples, the ferroelectric or relaxor zones in
the corresponding ternary diagrams.
In the BaTiO
3
–BaZrO
3
–CaTiO
3
system (Fig. 30.5), zones I, II and III
correspond to a ferroelectric zone with three phase transitions like BaTiO
3
,
a ferroelectric one with only a rhombohedral–cubic transition and a relaxor
Table 30.2
Comparative values of
x
for the same shift of
T
m
(∆
T
m
= 10K) and
values of
T
dev.
–
T
m
(at 1 kHz)
Substitution Sites Solid solutions
xT
dev.
–
T
m
(K)
Homovalent M Ba(Ti
1–
x
Zr
x
)O
3
0.35 150
A and M Ba
1–
x
Ca
x
(Ti
1–
x
Zr
x
)O
3
0.225 130
Heterovalent A Ba
1–
x
K
x
/2
La
x
/2
TiO
3
0.30 100
Ba
1–
x
/2
䊐
x
/2
(Ti
1–
x
Nb
x
)O
3
0.10 120
A and M Ba
1–
x
K
x
(Ti
1–
x
Nb
x
)O
3
0.125 105
M and X Ba(Ti
1–
x
Li
x
)O
3–3
x
F
3
x
0.15 120
WPNL2204
Lead-free relaxors 903
one, respectively. The wide boundary between zones II and III represents a
ferroelectric–relaxor transition; such a type of transition will be discussed in
Section 30.4. In the BaTiO
3
–KNbO
3
–CaTiO
3
system (Fig. 30.6), there is
only one relaxor zone (zone II). In the BaTiO
3
–BaZrO
3
–BaLiF
3
system (Fig.
30.7), zones I and II are both relaxor.
30.5
Schematic representation of the [BaTiO
3
–BaZrO
3
–CaTiO
3
] ternary
diagram.
BaTiO
3
0.10
0.20
0.30
0.10
0.20
0.30
To CaTiO
3
To KNbO
3
x
Multiphase zone
x
Relaxor
zone II
Ferroelectric
zone I
[1] [2] [3] [7] [4] [6] [5]
30.6
Schematic representation of the [BaTiO
3
–KNbO
3
–CaTiO
3
] ternary
diagram.
C
A
B
BaTiO
3
0.10
0.20
0.30
0.40
0.50
0.10
0.20
0.30
0.40
0.50
x
To BaZrO
3
To CaTiO
3
Ba
0.90
Ca
0.10
(Ti
1–0.90
x
Zr
0.90
x
)O
3
Zone III
Zone II
Zone I
x
WPNL2204
Handbook of dielectric, piezoelectric and ferroelectric materials904
In all the cases, the relaxor zones develop from the relaxor solid solutions
existing in the binary systems BaTiO
3
–BaZrO
3
, BaTiO
3
–KNbO
3
and BaTiO
3
–
BaLiF
3
. There are always two types of ionic substitutions: (Ca
2+
–Ba
2+
and
Zr
4+
–Ti
4+
), (K
+
–Ba
2+
and Nb
5+
–Ti
4+
) and (Li
+
–[Ti
4+
, Zr
4+
] and 3F
–
–3O
2–
).
The presence of different cations in the same crystallographic site enhances
the relaxor effect and the main dielectric relaxor characteristics. The values
of T
m
, ∆T
m
and ∆
′′
εε
rr
/ (at T
m
) increase when the composition deviates from
the binary system. An example is given in Table 30.3 for the BaTiO
3
–BaZrO
3
–
CaTiO
3
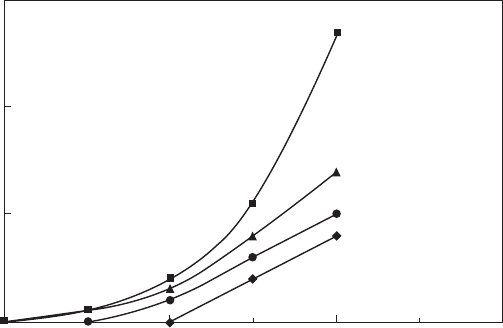
system. Another example is illustrated by Figs 30.8 and 30.9 concerning
the BaTiO
3
–KNbO
3
–CaTiO
3
system.
30.2.4 X-ray diffraction and Raman studies
An X-ray diffraction study performed on Ba(Ti
0.65
Zr
0.35
)O
3
showed that the
dielectric peak at T
m
does not correspond to any symmetry change: it remains
cubic. Such a result has been reported for PMN relaxor. For a more complex
substitution in Ba
0.92
Ca
0.08
(Ti
0.75
Nb
0.25
)O
3
the result is different, e.g. for
Pb(Mg
0.3
Nb
0.6
Ti
0.1
)O
3
. It transforms spontaneously from a relaxor (cubic)
into a microscopic ferroelectric (rhombohedral) state on cooling. Such a
transition was in good agreement with dielectric and pyroelectric measurements.
BaTiO
3
x
x
Relaxor
zone I
Relaxor
zone II
y
To BaZrO
3
To BaLiF
3
0.1
0.20
0.30
0.40
0.50
0.1
0.20
0.30
0.40
0.50
30.7
Schematic representation of the relaxor zones I and II in the
[BaTiO
3
–BaZrO
3
–BaLiF
3
] ternary diagram. Filled circles represent the
investigated compositions.
WPNL2204
Lead-free relaxors 905
This behaviour is due here to a supplementary local polarisation resulting
from the Ca
2+
displacement in its crystallographic site because of its small
size (1.36Å) compared with that of Ba
2+
(1.61 Å) in 12-CN [47].
A Raman study was performed on barium titanate ceramics doped with
either zirconium or niobium [48, 49]. These two Zr
4+
and Nb
5+
cations have
Table 30.3
Variation of ferroelectric and relaxor characteristics with composition
Compositions
T
C
(K)
a
T
m
(K)
a
∆
T
m
(K)
b
∆
′′
εε
rr
c
/
Ca
2+
–Ba
2+
BaTiO
3
400 0.06
substitution Ba
0.80
Ca
0.20
TiO
3
405 0.05
Ba(Ti
0.85
Zr
0.15
)O
3
340 0.07
Ba
0.85
Ca
0.15
(Ti
0.85
Zr
0.15
)O
3
347 0.03
Ba(Ti
0.63
Zr
0.37
)O
3
194 14 0.41
Ba
0.88
Ca
0.12
(Ti
0.63
Zr
0.37
)O
3
169 28 0.45
Zr
4+
–Ti
4+
BaTiO
3
400 0.06
substitution Ba(Ti
0.80
Zr
0.20
)O
3
314 0.05
Ba(Ti
0.60
Zr
0.40
)O
3
188 16 0.43
Ba
0.90
Ca
0.10
TiO
3
410 0.05
Ba
0.90
Ca
0.10
(Ti
0.90
Zr
0.10
)O
3
364 0.06
Ba
0.90
Ca
0.10
(Ti
0.70
Zr
0.30
)O
3
209 19 0.37
a
at 1 kHz
b
∆
T
m
=
T
m
(10 kHz) –
T
m
(0.1kHz)
c
∆
′′ ′
εε ε
rr r
/ =
(0.1 kHz) –
′
ε
r
(200 kHz)/
′
ε
r
(0.1kHz), at
T
C
(or
T
m
) – 50 K
T
C
(K) (or
T
m
)
500
400
300
200
100
0 0.1 0.2 0.3
x
[7]
[6]
[5]
[BT-KN]
30.8
Variation of
T
C
(or
T
m
) with composition for coupled substitution
of (Ba
2+
, Ti
4+
) for (K
+
, Nb
5+
) in the BaTiO
3
–KNbO
3
–CaTiO
3
diagram.
The numbers in brackets correspond to the various composition lines
given in Fig. 30.6. The value of
x
represents the atomic ratio
x
= [K +
Nb]/([Ba + Ti] + [K + Nb]).
WPNL2204
Handbook of dielectric, piezoelectric and ferroelectric materials906
been chosen because of their differences with titanium: Zr
4+
is isovalent but
larger in size by about 20% than Ti
4+
, while Nb
5+
has approximately the
same size as Zr
4+
but a different charge. It reinforces the general idea that
electric random fields are more efficient in ferroelectric materials than elastic
(dilatational) random fields in lowering the ferroelectric transition temperature
and in inducing the relaxor behaviour, as was already demonstrated in a
previous theoretical study [50], in which the nature of the complex defects
expected from the inherent high concentration of barium vacancies in Nb-
doped compositions was discussed in connection with photoluminescence
spectra.
30.3 Perovskite-type relaxor not derived from BaTiO
3
A series of relaxor compositions were derived from the antiferroelectric
NaNbO
3
in several solid solutions such as NaNbO
3
–AMO
3
(AMO
3
= NaTaO
3
,
CaTiO
3
, SrTiO
3
, etc.), NaNbO
3
–Sr
0.5
NbO
3
, NaNbO
3
–MSnO
3
(M = Ca, Ba),
etc. The values of T
m
are well below room temperature. However, the T
m
values can be increased by Li or K-doping, leading to the formation of
NaNbO
3
–ABO
3
–LiNbO
3
(KNbO
3
) solid solution zones [51–57].
30.4 Crossover from a ferroelectric to a relaxor state
The aim of this section is to determine the crossover from ferroelectric to
relaxor versus substitutions rate in lead-free ceramics. Indeed, the continuous
∆
T
m
(K)
30
20
10
0
0 0.1 0.2 0.3
x
[6]
[5]
[7]
[BT-KN]
30.9
Variations of ∆
T
m
=
T
m
(0.1 kHz) –
T
m
(100 kHz) for some
composition lines (see Fig. 30.6) corresponding to coupled
substitution of (Ba
2+
, Ti
4+
) for (K
+
, Nb
5+
).
WPNL2204
Lead-free relaxors 907
change from ferroelectric to relaxor behaviour is a unique feature of lead-
free solid solutions. In lead-containing compounds, only well-defined
compositions lead to a low-temperature relaxor state. In addition, the exact
nature of the relaxor state in lead-free perovskites is still a matter of
debate [58]. Investigating the gradual change from ferroelectric to relaxor
behaviour is thus helpful to understand the physics of the latter. To this aim,
it has been focused on the following compositions: Ba(Ti
1–x
Zr
x
)O
3
,
Ba
1–x/2
䊐
x/2
(Ti
1–x
Nb
x
)O
3
, Ba
0.95x
䊐
0.05x
(Ti
0.90
Nb
0.10
)O
2.05+0.95x
and
Ba(Ti
1–x
Li
x
)O
3–3x
F
3x
belonging to the various systems BaO–TiO
2
–ZrO
2
,
BaO–TiO
2
–Nb
2
O
5
and BaO–BaF
2
–TiO
2
–LiF [59–63]. They correspond to
homovalent and/or heterovalent cationic substitutions on the 6–CN site, anionic
substitution and also non-stoichiometric compositions.
When the local strength of the substituted defects increases, the ferroelectric-
relaxor crossover composition x
f–r
decreases:
• for an homovalent substitution (Zr
4+
→ Ti
4+
), x
(f–r)
= 0.27;
• for an heterovalent substitution (2Nb
5+
+ 䊐 → Ba
2+
+2Ti
4+
), x
(f–r)
= 0.06;
• for both anionic and cationic heterovalent substitutions (Ti
4+
+3O
2–
→
Li
+
+ 3F
–
), x
(f–r)
= 0.045.
On this list, the homovalent Zr
4+
ions are the softest defects while the coupled
ions Li
3+
+ 3F
–
are the strongest.
Figure 30.10 shows the composition dependence of transition temperatures
for a ceramic with the Zr
4+
–Ti
4+
substitution. The solid solution starts from
T
(K)
500
400
300
200
100
0
0.00 0.10 0.20 0.30
x
T
3
T
m
T
C
Para. (cubic)
Ferro. (tetrag.)
Ferro. (orth.)
Ferro. (rhomb.)
Relaxor (‘cubic’)
T
1
T
2
30.10
Variation of transition temperatures with composition for
ceramics of (Ba
0.90
Ca
0.10
)(Ti
1–0.90
x
Zr
0.90
x
)O
3
solid solution.
WPNL2204
Handbook of dielectric, piezoelectric and ferroelectric materials908
a composition of the BaTiO
3
–CaTiO
3
system, (Ba
0.90
Ca
0.10
)TiO
3
. There is
first a progressive disappearance of the tetragonal and orthorhombic
ferroelectric phases, leading to a rhombohedral, ferroelectric–cubic, paraelectric
transition only. Secondly, as observed earlier, a relaxor phase appears with a
transition from relaxor to ferroelectric at T
3
, on cooling.
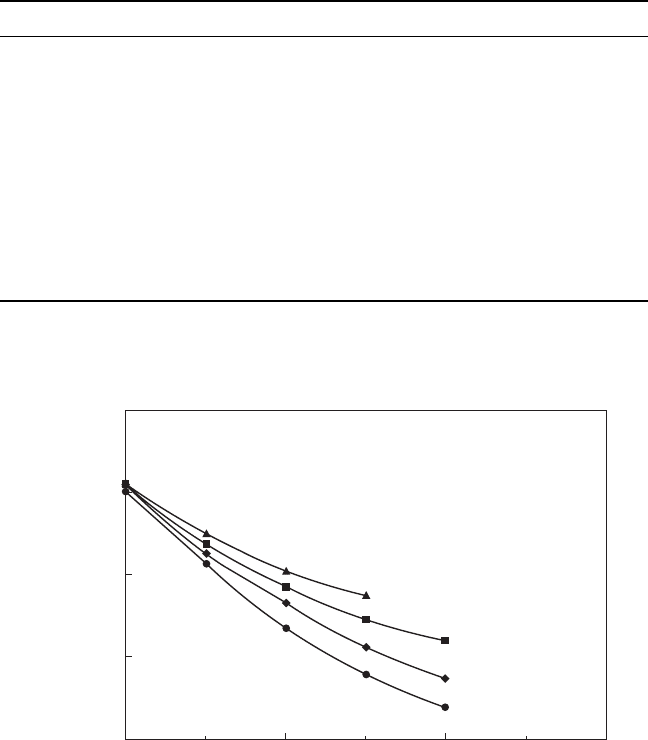
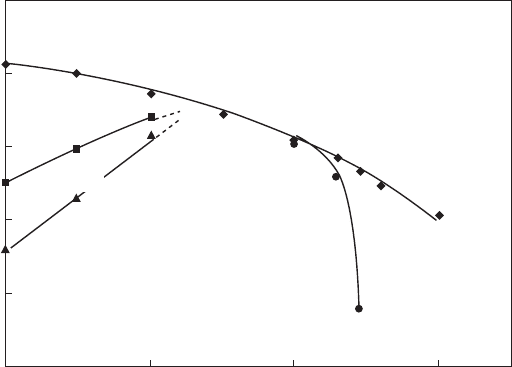
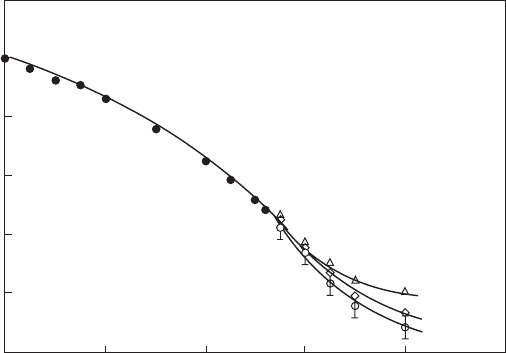
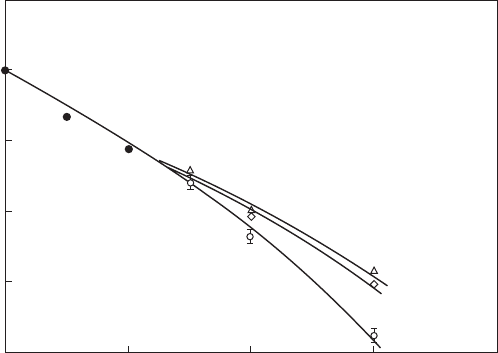
The shape of the phase diagrams displayed on Figs. 30.11 and 30.12 for
Ba(Ti
1–x
Zr
x
)O
3
and Ba
1–x/2
䊐
x/2
(Ti
1–x
Nb
x
)O
3
respectively is also of interest.
Indeed, for x < x
f–r
, the paraelectric–ferroelectric transition temperature
decreases on increasing x. When the crossover composition x
f–r
is reached,
this transition line splits because of the already mentioned dielectric dispersion
in the relaxor state. The Vogel–Fulcher line can be considered, following
equation [30.1], as the zero frequency extrapolation of the various T
m
lines.
The error bars that are drawn on Figs 30.11 and 30.12 take into account the
limited accuracy of the Vogel–Fulcher fitting which mainly stems from the
limited frequency range used. Nevertheless, it can be noted that in lead-
containing relaxors, extended frequency ranges usually lead to similar Vogel–
Fulcher temperatures. Keeping in mind these limitations, the Vogel–Fulcher
line T
VF
= f (x) (x > x
f–r
) is the best extrapolation of the ferroelectric line T
C
= f (x) (x < x
f–r
). This is the main experimental feature that will be discussed
in the following.
To confirm the dielectric results, X-ray diffraction and thermocurrent
measurements were performed on the composition Ba
0.92
Ca
0.08
(Ti
0.75
Zr
0.25
)O
3
corresponding to point B in Fig. 30.5, i.e. in the wide boundary between
T
(K)
450
400
350
300
250
200
150
0 0.1 0.2 0.3 0.4 0.5
x
T
VF
T
C
T
m
100 kHz
0.1 kHz
30.11
Variations of
T
C
,
T
m
and
T
VF
with composition for ceramics of
the Ba(Ti
1–
x
Zr
x
)O
3
system.
WPNL2204
Lead-free relaxors 909
zones [II] and [III]. As stated above, there is a ferroelectric–relaxor transition
at T
3
= 210K, and T
m
= 255K, at 1kHz. The temperature dependence of the
symmetry and the cell parameters showed a rhombohedral–apparently cubic
transition at T
3
. The α rhombohedral angle increases progressively from
88.93° at 93K and reaches 90° at T
3
[47]. No symmetry change was observed
at T
m
. The ceramic appeared to be pyroelectric from 80 to about 350K [64].
Its polarisation could also be reversed, thus indicating a ferroelectric behaviour.
A strong and sharp current peak around 200K, close to T
3
, which involved
a steep decrease in spontaneous polarisation, was due to a decrease in the
ferroelectric distortion. It corresponds to the ferroelectric–relaxor transition.
At higher temperature, a progressive decrease in p occurred, resulting from
a decrease in P
s
with increasing temperature.
The Vogel–Fulcher line T
VF
= f (x) (x > x
f–r
) and the ferroelectric transition
line T
C
= f (x) (x < x
f–r
) are aligned, calling for a possible link between the
ferroelectric and relaxor transitions. This link is by no way obvious since
these two states are very different in nature. In lead-containing relaxors, the
interplay between ferroelectricity and relaxor state displays a wealth of different
features. In PMN, the ferroelectricity is only field induced and the transition
temperature lies well below the relaxor transition. In PST and PSN, the
ferroelectricity is spontaneous in chemically ordered compounds and closely
follows the relaxor transition.
Having established a link between the relaxor and ferroelectric lines in
lead-free compounds, it is interesting to understand the possible origin of
T
(K)
500
400
300
200
100
0
0.00 0.05 0.10 0.15 0.20
x
T
VF
T
C
T
m
100 kHz
0.1 kHz
30.12
Variations of
T
C
,
T
m
and
T
VF
with composition for ceramics of
the Ba
1–
x
/2
䊐
x
/2
(Ti
1–
x
Nb
x
)O
3
system.
WPNL2204