Zuo-Guang. Ye Advanced Dielectric Piezoelectric and Ferroelectric Materials: Synthesis, Characterisation and Applications
Подождите немного. Документ загружается.

Handbook of dielectric, piezoelectric and ferroelectric materials340
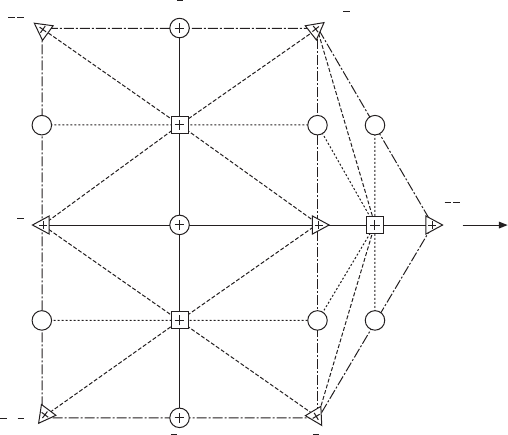
using the extinction pattern of Fig. 12.2. First, one of the crossed P/A pair
axes at reading 0° was aligned with one sample edge, such as [110] or [100].
The extinction angles therefore were measured with respect to the [110] or
the [100] directions. The solid crosses within the symbols in Fig. 12.2 represent
the orientation of the extinction. For instance, if the (001)-cut sample’s [110]
edge is aligned with P/A: 0°, R phase domains represented by triangles with
solid crosses thus have extinction at 0° (or 90°). T phase domains represented
by squares with solid crosses have extinction at 45°. T phase domains with
polarization P along the [001] axis represented by the solid black square in
the center have extinction at every orientation of the crossed P/A pair and are
written as ‘T
001
’ in the following discussion. The O phase domains represented
by circles with solid crosses have extinctions at 0° (or 90°) or 45°, whereas
R domains only give extinctions at 0°. Any extinctions at angles other than
0° (or 90°) and 45° must be from the M or Tri phase domains. Note that all
the phases except Tri phase have been reported in various PMN–PT crystals.
The large observed variation in extinction angle with E field or temperature
in some of our experiments indicates M domains whose polarization P can
vary with E field or temperature through a large angle, whereas the polarization
directions are nearly fixed for R, T, or O domains as E field or temperature
varies.
12.3
Relation between the optical extinction orientations
corresponding to the ferroelectric polarization directions for various
phases and domains projected on the (110) plane (adapted from
Chien
et al
., 2005b).
M
B
M
A
M
C
[111]
[111]
[111]
[110] [111]
[001]
[111]
[001][111]
[111]
[110]
[100]
[110]
[010]
WPNL2204
Electric field-induced domain structures and phase transitions 341
12.4 Thermal stability for various PMN–PT
compositions
12.4.1 (001)-cut PMN–
x
PT crystals (
x
= 0.24, 0.26, 0.27,
0.29, 0.35, 0.38)
To enhance piezoelectric performance, a prior E-field poling process has
usually been done before employing these materials in applications. However,
how prior E-field poling affects phase thermal stability still remains unclear.
In this section, dielectric permittivity, electric polarization, domain structure,
and X-ray spectrum were measured as functions of Ti content, temperature,
and poling strength for (001)-cut crystals before and after a dc E-field poling.
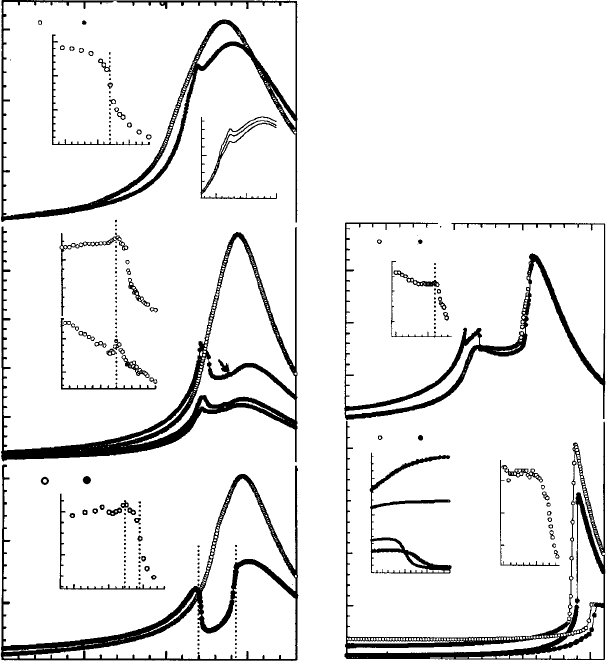
Figure 12.5(a) shows dielectric results of ZFH and FC-ZFH for PMN–
24%PT. The maximum temperature T
m
was shifted a few degrees higher in
the FC-ZFH. Besides a broad maximum near 390K an extra peak appears
near 370K in the FC-ZFH, whose position (but not the amplitude) is
independent of frequency as seen in the inset. The P
r
also exhibits an abrupt
decline near 370K. The coercive field E
C
is ~3.8kV/cm at room temperature.
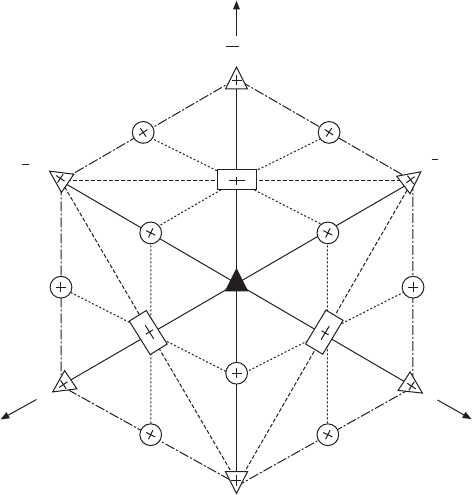
12.4
Relation between the optical extinction orientations
corresponding to the ferroelectric polarization directions for various
phases and domains projected on the (111) plane (adapted from Tu
et al
., 2003b).
[111]
z
ˆ
[111]
[111]
[001]
M
A
M
B
M
C
y
ˆ
x
ˆ
[101]
[111]
M
B
WPNL2204
Handbook of dielectric, piezoelectric and ferroelectric materials342
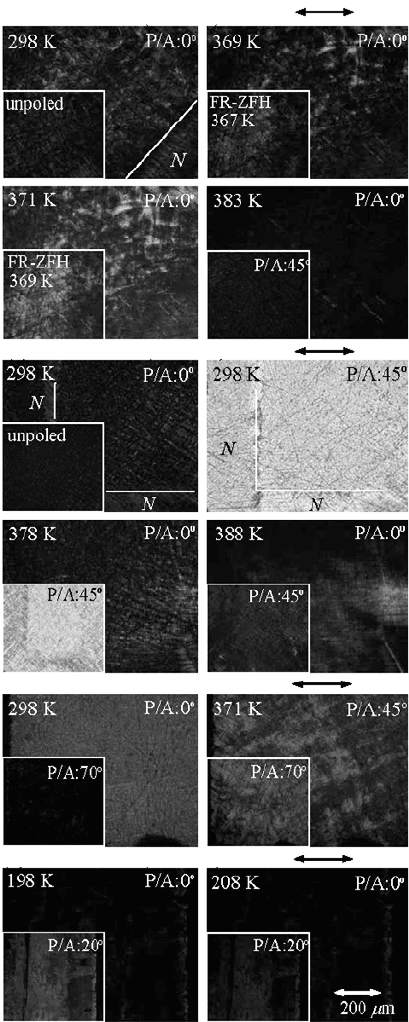
ZFH domain structures after FC are shown in Fig. 12.6(a). ‘N’ indicates
the area without ITO films. When observing the (001)-cut sample along
[001] between a crossed P/A pair with the <110> sample edge aligned with
P/A: 0°, the optical extinction angle of the R phase is 0°. As seen in the inset
which shows extinction at 0°, the symmetry of unpoled PMN-24%PT is
mostly R at 298K. After the FC, besides the R domains at 298K a small
fraction of the domain matrix exhibits extinction in the range of ~20–70°,
indicating M domains (perhaps mixed with T domains whose extinction
angle is 45°). As shown in Fig. 12.7(a), the unpoled <002> X-ray diffraction
taken at room temperature shows a single peak, indicating the R phase even
after poling at E = 6 kV/cm. Near 371K M domains associated with extinction
Temperature (K)
300 350 400 450
Real part of dielectric permittivity ε′ (×10
4
)
3
2
1
4
3
2
1
0
(d)
ZFH
FR-ZFH (2kV/cm)
29%
(e)
ZFH
FR-ZFH (6kV/cm)
35%
35%
T
(K)
300 400
P
r
(µC/cm
2
)
15
10
5
T
(K)
180200 220 240
0.3
0.2
0.1
38%
35%
35%
38%
FR-ZFH
T
(K)
300 350
20
10
P
r
(µC/cm
2
)
Temperature (K)
250 300 350 400
Real part of dielectric permittivity ε′ (×10
4
)
1.5
1.0
0.5
4
3
2
1
3
2
1
T
(K)
300 350 400
27%
(c) ZFH FC–ZFH
20
10
P
r
(µC/cm
2
)
T
(K)
300 350 400
12
6
2
1
(b)
26%
E
c
(kV/cm)
P
r
(µC/cm
2
)
ZFH
E
= 25kV/cm
E
= 15kV/cm
E
= 5kV/cm
FC-ZFH
T
(K)
T
(K)
300
350 400
15
10
5
0
P
r
(µC/cm
2
)
(a)
ZFH FC-ZFH (6kV/cm)
24%
1.0
0.5
ε′ (×10
4
)
360
380 400
0.5
10
100kHz
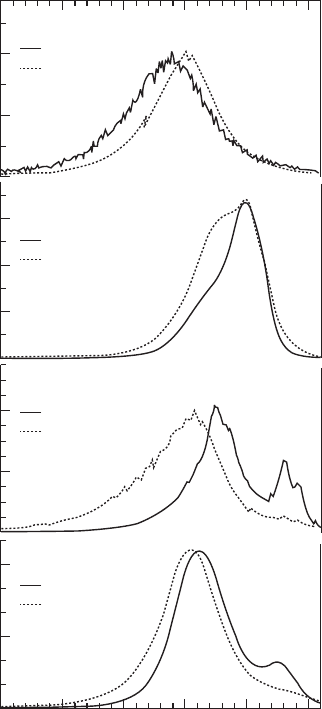
12.5
Dielectric permittivity and remanent polarization for (001)-cut
PMN–
x
PT crystals,
x
= (a) 24%, (b) 26%, (c) 27%, (d) 29%, and (e)
35% (adapted from Tu
et al.
, 2004).
(4 kV/cm)
ε′ (×10
4
)
ZFH
38%
WPNL2204
Electric field-induced domain structures and phase transitions 343
<110>(a) 24% FC-ZFH (7kV/cm)
<110>
<110>
<100>
(b) 26% FR-ZFH (5kV/cm)
(c) 29% FR-ZFH (2kV/cm)
(d) 35% FR-ZFH (6kV/cm)
12.6
Domain structures. Angles of the P/A pair are with regard to the
[110] for PMN–24%PT, 26%PT, and 29%PT and [100] for 35%PT
crystals (adapted from Tu
et al
., 2004). A color version of the figure
can be found in Tu
et al.
, 2004.
WPNL2204
Handbook of dielectric, piezoelectric and ferroelectric materials344
angles at ~20–70° expand widely in the domain matrix. This anomaly was
also seen in the FR-ZFH (Fig. 12.6a), suggesting that FR and FC have the
same poling effect. The crystal becomes cubic phase near 383K. Thus, after
poling the PMN–24%PT undergoes a R(M)→M(R)→C transition sequence
near 370 and 383K upon heating. ‘R(M)’ represents that dominant R domains
coexist with a smaller fraction of M domains.
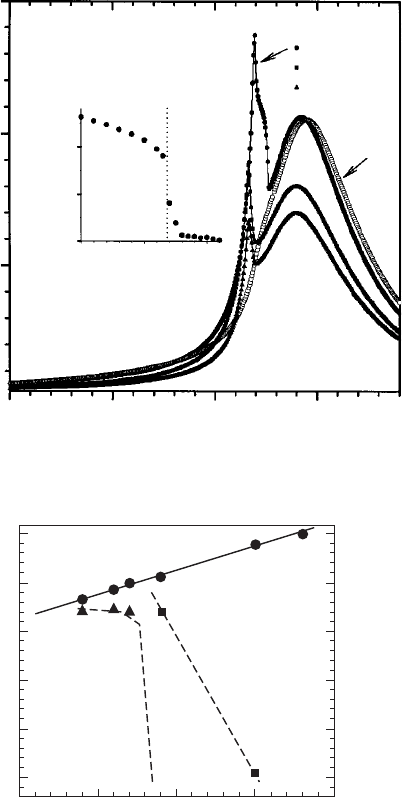
More complicated dielectric anomalies were seen in PMN–26%PT.
Compared with the ZFH, in the FR-ZFH two other anomalies, as shown in
Fig. 12.5(b), were observed near 370–376K and ~385K (as indicated by an
(a) 24%
(b) 26%
(c) 35%
(d) 38%
<002>
Unpoled
E
= 6kV/cm
Unpoled
E
= 6kV/cm
Unpoled
E
= 5kV/cm
Unpoled
E
= 6kV/cm
2θ (degree)
45.545.044.544.043.0 43.5
Intensity (arb. units)
4
2
0
6
4
2
0
4
2
0
6
3
0
12.7
<002> X-ray diffraction spectra taken at room temperature for
unpoled and poled (001)-cut PMN–
x
PT crystals,
x
= (a) 24%, (b) 26%,
(c) 35%, and (d) 38%.
WPNL2204
Electric field-induced domain structures and phase transitions 345
arrow) which were shifted to lower temperatures with increasing E field.
The minimum E field to induce this behavior is ~1.0 kV/cm which is smaller
than room temperature E
C
~2.5kV/cm. As E field increases, the anomaly
seen near 370–376 K becomes a single peak and rather weaker. As shown in
Fig. 12.5(b), P
r
and E
C
also exhibit a peak near 370K. Similar dielectric
anomalies were observed in the FC–ZFH. ZFH domain structures after poling
are shown in Fig. 12.6(b). The unpoled sample shows optical extinction at 0°
at 298K, indicating R domains. In the FR-ZFH, besides the dominant R
domains, a very small fraction of M domain (with extinction angles of ~0-
10°) was observed at 298K. Near 378K the M domains dramatically expand
with extinction angles of ~0–15°. Near 388K some domains show extinction
at 45°, indicating T domains. The crystal becomes cubic near 393K. Similar
domain anomalies were seen in the FR-ZFH (10 kV/cm). It is important to
note that the ‘370 K’ anomaly was also observed in the pure ZFH domain
observation, but not as apparent as the FR-ZFH. It implies that a prior poling
can reveal a ‘hidden’ transition which is not obvious in an unpoled sample.
The unpoled <002> X-ray data (Fig. 12.7b) show a broad peak and a weak
shoulder, which are similar with the <002> synchrotron X-ray profile (Noheda
et al., 2002) and probably correspond to R and M phases respectively. The
M phase becomes more pronounced after poling at E = 5kV/cm. Thus, after
poling a R(M)→M(R)→M(T)→C transition sequence occurs in PMN–26%PT
near 370–376, 388, and 393K upon heating.
Similar dielectric anomalies were observed in PMN–27%PT as given in
Fig. 12.5(c). In the FC-ZFH two clear frequency-independent anomalies (as
marked by dashed lines) occurred near 370 and 392K. The P
r
also shows a
maximum peak and a rapid decline near 370 and 392 K. After poling the
PMN–27%PT probably goes through a R(M)→M(R)→M(T)→C transition
sequence near 370, 392, and 400K respectively upon heating.
Figure 12.5(d) shows ZFH and FR-ZFH dielectric results for PMN–29%PT.
Besides a broad maximum near 407K, two extra peaks appear near 358
and 368K after poling. The minimum E field to induce this anomaly is
~2.0kV/cm which is smaller than room temperature E
C
~3.3 kV/cm. The P
r
exhibits an abrupt decline near 365K. As given in Fig. 12.6(c), at 298K
domains show extinction in the range of ~40°–80°, indicating mostly M
domains. At 371K, besides a small fraction of M domains associated with
extinction at ~60–80°, most domains exhibit extinction at 45°, which indicates
T phase domains. In other words, an M(T)→T(M) transition occurs near
370 K. A similar anomaly was seen in the pure ZFH domain observation. An
extra peak that occurred near 358K and weak shoulders that appeared in the
region of 400–407K, as seen in Fig. 12.5(d), are probably due to phase
segregation.
Instead of a gradual climb up in the ZFH, the FR-ZFH of PMN–35%PT
in Fig. 12.5(e) exhibits a step-like decline near 200–210K. ZFH domain
WPNL2204
Handbook of dielectric, piezoelectric and ferroelectric materials346
structures observed after poling are shown in Fig. 12.5(d) for 198 and 208K.
Below 198K domains exhibit extinction from 0 to 10°, but near 208K the
extinction range becomes twice as wide, i.e. 0–20°. A similar anomaly was
seen in the pure ZFH domain observation. The 90° domain walls between
two domains with their T-phase polar axes along [100] and [010] were seen
before the FR process but disappeared after poling. T and M
C
-type M domains
have extinction at 0° with regard to [100]. The broad extinction angles (0–
20°) imply that polarization directions of M domains are close to [001] T
polarization. The crystal reaches mostly total extinction at E = 9kV/cm.
The unpoled <002> X-ray diffraction [Fig. 12.7c) for PMN–35%PT exhibits
at least four peaks. A dominant T phase mixed with M phase was found in
the unpoled PMN–35%PT ceramics (Noheda et al., 2002). Thus, these peaks
probably are associated with T and M phase domains. After poling, a strong
broad peak and a weak shoulder were observed, perhaps indicating two main
T and M phase domains. Based on the above evidence, a long-range
M(T)→T(M) transition probably takes place in the region of 200–210K
after poling. The crystal becomes cubic near 440K, where the P
r
exhibits a
rapid decline.
A step-like decline was seen near 210K in the FR–ZFH of PMN-38%PT
as shown in Fig. 12.5(e). This anomaly was not observed for E ≤ 5 kV/cm
and E
C
is ~6 kV/cm at room temperature. From the ZFH domain observation,
a coexistence of T and M domains was seen in a PMN–38%PT crystal in
which T domains increase rapidly from 200 to 300 K. Two peaks were seen
in the unpoled <002> X-ray diffraction of Fig. 12.7(d), perhaps indicating a
coexistence of T and M domains. After poling, only a broad peak was observed.
Note that the E field was along the [001] T polar direction. Thus, the dielectric
anomaly seen near 210K in the FR–ZFH most likely indicates a long-range
T(M)→T transition.
Briefly, phase thermal stability of (001)-cut PMN–PT crystals after a
prior E-field poling strongly depends on Ti content and field strength. The
‘370 K’ dielectric anomaly was seen in PMN–24%PT, PMN–26%PT, and
PMN-27%PT, and correlates to a R(M)→M(R) transition. FC and FR have
the same effect on phase transitions as seen upon subsequent ZFH. For a
differently oriented compound, similar dielectric anomalies after a prior
field poling were also seen in (110)-cut PMN–26%PT as shown in Fig. 12.8.
An extra dielectric anomaly ‘triggered’ by a prior field poling seems to be a
common phenomenon in PMN–PT (Chien et al., 2005b) and PZN–PT crystals.
However, this extra dielectric anomaly can be easily erased by thermal annealing
in the C phase.
Figure 12.9 shows a phase diagram based on the above evidence, in which
the phase boundaries may be changed with stronger E field or different
crystallographic orientation. It is very different from the phase diagram for
unpoled PMN–PT crystals, in which the M phase was not found. An M
C
WPNL2204
Electric field-induced domain structures and phase transitions 347
phase was found to coexist with R, T, or O phases in unpoled PMN–xPT
ceramics for 31 ≤ x ≤ 37 (Noheda et al., 2002). M
B
and M
C
phases were also
found in unpoled PMN–xPT ceramics for 27 ≤ x ≤ 30 and 31 ≤ x ≤ 34
respectively. Regarding the prior poling effect in PMN–PT crystals, more
details and references can be found in Tu et al. (2004).
Temperature (K)
250 300 350 400
6
4
2
ε′ (×10
4
)
(110) 26%
ZFH
FR-ZFH
E
= 0.75
E
= 12
E
= 20kV/cm
T
(K)
300 350 400
P
r
(µC/cm
2
)
20
10
0
12.8
Dielectric permittivity and remanent polarization for (110)-cut
PMN–26%PT crystal (adapted from Chien
et al.
, 2005b).
C
RMT
Ti concentration (%)
4035302520
Temperature (K)
450
400
350
300
250
200
12.9
Phase diagram of (001)-cut PMN–PT crystals after poling.
Triangle and square symbols represent R(M)→M(R) and M(T)→T(M)
transitions respectively. Lines are estimated boundaries for various
dominant phases (adapted from Tu
et al.
, 2004).
WPNL2204
Handbook of dielectric, piezoelectric and ferroelectric materials348
12.4.2 WO
3
doped PMN–PT crystals
Recently, an unpoled PMN–PT single crystal with 0.5 mole% WO
3
in the
growth solution exhibited an interesting wavelength-dependent photovoltaic
response after a prior E-field poling (Tu et al., 2006a).
In addition, WO
3
-
doped PMN–PT crystals show higher dielectric permittivities compared with
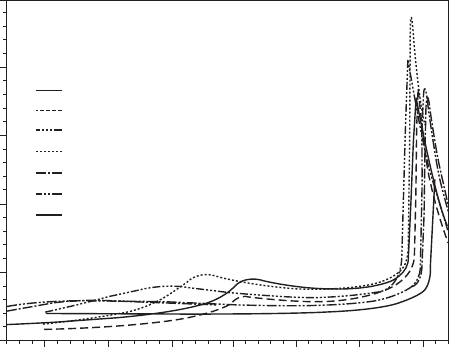
the pure PMN–PT crystals (without tungsten dopant). Figure 12.10 illustrates
temperature-dependent dielectric permittivities from different layers of the
same WO
3
-doped unpoled crystals. It shows obvious PT segregation with
different dielectric maximum temperature T
m
. Dielectric permittivity exhibits
a wide range of thermal stability (below the cubic phase) and can reach ∼10
4
at room temperature for some compounds, which are promising for piezoelectric
applications.
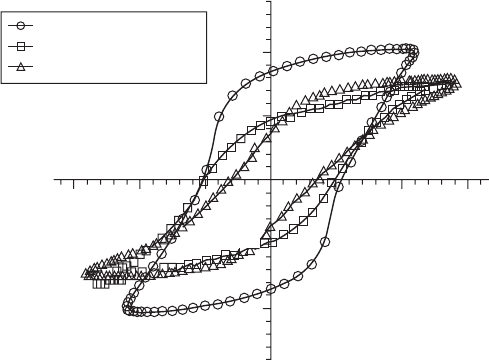
Figure 12.11 shows hysteresis loops (polarization vs. E field) from WO
3
-
doped PMN–PT crystals (#1 and #2) and an undoped PMN–PT compound.
The spontaneous and remanent polarizations and the coercive field (E
C
) are
smaller compared with the undoped crystal. Such significant reduction of
electric polarization may be due to a tendency toward a different structure
near tungsten ions. Pure WO
3
has a monoclinic ferroelectric phase (Jona and
Shirane, 1962).
1. 444K 36.2%
2. 439K 35.2%
3. 446K 36.6%
4. 440K 35.4%
5. 454K 38.2%
6. 451K 37.6%
7. 460K 39.4%
%PT
T
m
0.5 mole% WO
3
doped PMN–PT single crystals
6
5
2
3
4
1
7
Temperature (K)
450400350300250200150
5
4
3
2
1
0
ε′ (×10
4
)
12.10
Dielectric permittivities of 0.5 mole% WO
3
doped PMN–PT
crystals taken at
f
= 10kHz upon heating without any
E
-field poling.
Crystals #1–6 are from different layers of the same crystal. Crystal #7
is without WO
3
dopant.
WPNL2204
Electric field-induced domain structures and phase transitions 349
12.5 Field-dependent domain structures of various
PMN–PT compositions
12.5.1 (001)-cut PMN–24% PT crystal
Figure 12.12 shows the E-field-dependent domain structures taken at P/A:
45° in a PMN–24%PT crystal as a dc E field is applied along [001]. Without
E-field poling, the whole domain matrix exhibits extinction at P/A: 0° with
respect to the [110] direction as shown in the inset of Fig. 12.12(a). When
observing the (001)-cut sample along the [001] direction between a crossed
P/A pair, as shown in Fig. 12.2, the extinction angle is 0° (or 90°) for all R
domains. Thus, domains in the PMN–24%PT crystal are certainly R phase at
E = 0kV/cm. In addition, there is no evidence for the O phase in the PMN–
24%PT at zero E field.
Near E = 4kV/cm (Fig. 12.12b), the domain matrix begins to exhibit
change and some domains show extinction at all P/A angles, indicating a T
phase with polarization along the [001] direction labeled as T
001
in the
micrograph. This is consistent with the coercive field E
C
∼3.8kV/cm as shown
in Fig. 12.13. The T
001
domain corresponds to the black square in Fig. 12.2.
The rest of the domain matrix exhibits R phase with extinction at 0°. As the
field increases, the T
001
phases gradually expand in the domain matrix as
shown in Fig. 12.12(c) and (d). Above E∼30kV/cm (Fig. 12.12e), the T
001
phase rapidly spreads into the domain matrix and forms network-like [001]
T domain chains, indicating a long-range order of the [001] T phase. Most
domains still maintain extinction angle at 0° except for the network-like T
001
Without dopant
#1 WO
3
doped sample
#2 WO
3
doped sample
–15 –10 0 5 10 15
–20
–10
0
10
20
E
(kV/cm)
P
(µC/cm
2
)
12.11
Hysteresis loops of WO
3
-doped PMN–PT crystals (#1 and #2),
and the pure PMN–PT crystal taken at room temperature.
WPNL2204