Zdunkowski W., Trautmann T., Bott A. Radiation in the atmosphere: A course in Theoretical Meteorology
Подождите немного. Документ загружается.


7.4 Transmission in inhomogeneous atmospheres 255
where g is the cumulative probability density for the absorbing gas. For simplicity,
we have omitted in τ
G
(g) the pressure and temperature dependence. The contribu-
tion to the total optical depth in layer z resulting from Mie scattering is
3
τ
M
= τ
sca,M
+ τ
abs,M
(7.215)
The single scattering albedo in the homogeneous layer is defined by
ω
0
(g) =
τ
R
+ τ
sca,M
τ
R
+ τ
M
+ τ
G
(g)
(7.216)
Let the Legendre expansion coefficients for the Rayleigh and Mie scattering be
given by p
l,R
and p
l,M
. The Legendre expansion coefficients for the phase function
for the combined action of air molecules and particle scattering is defined by a
linear weighting of the expansion coefficients of the individual components. The
weighting factor is the scattering optical depth of the respective material in layer
z, i.e.
p
l
=
τ
sca,M
p
l,M
+ τ
R
p
l,R
τ
sca,M
+ τ
R
(7.217)
For many cases the Mie phase function can be approximated by the Henyey–
Greenstein phase function, which for particle scattering depends on the asymmetry
factor only, see (6.41). Thus we obtain for the phase function the two relations
P(cos ) =
M
l=0
p
l
P
l
(cos ) =
3
4
(1 + cos
2
) Rayleigh scattering
M
l=0
(2l + 1)g
l
P
l
(cos ) Henyey–Greenstein
(7.218)
In these examples we have seen that the k-distribution method can be applied to
various simple models. It is difficult to conceive any situation where this method
would fail.
7.4 Transmission in inhomogeneous atmospheres
In the previous sections we have derived various transmission functions for model
spectra of absorbing atmospheres. These transmission functions applying to homo-
geneous gaseous layers can be extended to simulate the transmission through inho-
mogeneous atmospheres. Ordinarily this involves coupled integrations over the
atmospheric path and the wave number. In order to avoid such extremely laborious
integrations to handle the transfer problem, it is customary to adopt approximate
3
A detailed description of the Mie theory will be given in a later chapter.

256 Transmission in spectral lines and bands of lines
techniques by means of scaling procedures which attempt to decouple these two
types of integrations. In earlier years radiation charts and the emissivity method
were used to study the radiative properties of the atmosphere. These procedures
already provided reasonably accurate profiles of the vertical flux density and the
radiative cooling rate for various types of air masses as was verified by compari-
son with measurements. These methods required that the integration over the wave
number was carried out once and for all. Then followed the integration over the
inhomogeneous path of the atmosphere either using a graphical or a numerical pro-
cedure. This was done with the help of a one-parameter scaling technique which
will be discussed below. In order to improve the accuracy of the one-parameter pro-
cedure, the Curtis–Godson approximation was introduced which is a two-parameter
scaling technique. Higher order scaling techniques are possible but usually they are
quite difficult to apply. In the following we will describe one- and two-parameter
models.
7.4.1 One-parameter scaling
The most simple scaling procedure is the so-called one-parameter scaling. Fortu-
nately, this method is sufficiently accurate to handle various transfer problems. The
transmission function for a non-homogeneous vertical atmospheric path may be
expressed by
T (u) =
1
ν
ν
exp
−
k
ν,L
(p, T )du
dν
=
1
ν
ν
exp
−
i
S
i
π
α
L,i
(ν − ν
0,i
)
2
+ α
2
L,i
du
dν
(7.219)
which applies to a small spectral interval containing numerous spectral lines. To
be specific we will assume that these lines have Lorentzian profiles, but for brevity
henceforth we omit the index L.
For simplicity let us first consider the technique as it applies to a single spectral
line. The formal extension to include neighboring lines is simple. We have shown in
(7.27) that the Lorentzian half-width is proportional to the linear pressure reduction
(p/ p
0
) while the temperature dependency varies according to
√
T
0
/T . There is
sufficient empirical and some theoretical evidence that the square root law to handle
the temperature dependency is not always sufficient. Hence we will express the
temperature dependency by a more general law as stated by
α = α
0
p
p
0
T
0
T
n
(7.220)
7.4 Transmission in inhomogeneous atmospheres 257
leaving the exponent n unspecified. Since ( p
0
, T
0
) refer to the reference pressure and
temperature, the ratio of the absorption coefficients k
ν
(p, T )/k
ν
(p
0
, T
0
)isgiven
by
k
ν
(p, T )
k
ν
(p
0
, T
0
)
=
S(T )
π
α
(ν − ν
0
)
2
+ α
2
S(T
0
)
π
α
0
(ν − ν
0
)
2
+ α
2
0
≈
S(T )
S(T
0
)
p
p
0
T
0
T
n
≈
p
p
0
T
0
T
n
(7.221)
Here, we have assumed that the strong-line approximation is sufficiently accurate
for the one-parameter scaling procedure. Thus, by ignoring the square of the half-
width in the denominator of the spectral line, the wave number-dependent parts of
the absorption coefficient can be factored out and cancel. Furthermore, we have
assumed that the ratio S(T )/S(T
0
) is approximately equal to 1. Hence we may
write
k
ν
(p, T )du = k
ν
(p
0
, T
0
)
p
p
0
T
0
T
n
du = k
ν
(p
0
, T
0
)
˜
u (7.222)
where the quantity
˜
u =
p
p
0
T
0
T
n
du
(7.223)
is known as the scaling parameter or the scaling path length. In case that there
are many spectral lines in the interval, the approximation used in (7.221) must be
replaced by
k
ν
(p, T )
k
ν
(p
0
, T
0
)
≈
i
S
i
(T )α
0,i
(ν − ν
0,i
)
2
p
p
0
T
0
T
n
i
S
i
(T
0
)α
0,i
(ν − ν
0,i
)
2
≈
p
p
0
T
0
T
n
(7.224)
However, the same scaling parameter
˜
u is used whether we are scaling the absorption
path of a single line or a group of lines.
As stated above, most early radiative transfer calculations were carried out with
the help of radiation charts or the emissivity method. These methods were designed
to employ the scaling parameter
˜
u which can also be successfully employed in
connection with the rotational water vapor band, see Chou and Arking (1980). In
the older literature the parameter
˜
u was called the reduced absorber mass.
The extension to an inclined path, assuming horizontally homogeneous sublay-
ers, is quite simple as we have seen in our previous work. All we need to do is to
introduce the factor 1/µ in the exponent of (7.219).

258 Transmission in spectral lines and bands of lines
7.4.2 The two-parameter scaling technique of Curtis and Godson
To simplify the transmission calculations, the approximation replaces an inhomoge-
neous by a more or less equivalent homogeneous layer. This will be accomplished by
adjusting the parameters appearing in the absorption coefficient which is assumed
to have the Lorentzian shape. The mean transmission in correct form is given by
(7.219). For simplicity let us again begin with a single spectral line by omitting the
summation sign. In the limit of the strong line approximation T
s
(u) the half-width
in the denominator may be ignored. Instead of neglecting α
2
altogether, we replace
it by a suitable mean value
˜
a
2
which is independent of the atmospheric path
T
s
(u) =
1
ν
ν
exp
−
S(T )
π
α(p, T )
(ν − ν
0
)
2
+ ˜α
2
du
dν (7.225)
By expanding the exponent and discontinuing the expansion after the second term,
we obtain the weak line limit T
w
(u) of the transmittance. Since the interval ν is
assumed to be much larger than the half-width of the line, we may extend the wave
number integration to infinity yielding
T
w
(u) =1 −
1
ν
S(T )α( p, T )
π ˜α
du
∞
−∞
1
x
2
+ 1
dx =1 −
1
ν
S(T )α( p, T )
˜α
du
(7.226)
Here we have used the simple transformation x = (ν − ν
0
)/
˜
a. In order to evaluate
˜
a, we also expand the exponent of (7.219) and obtain the approximation
T
w
= 1 −
1
ν
S(T )du (7.227)
which, of course, is identical with the result obtained from the Ladenburg–Reiche
formula (7.73). Forcing agreement between (7.226) and (7.227) we obtain the
scaling half-width
˜
a
˜α =
S(T )α( p, T )du
S(T )du
(7.228)
which is the first scaling parameter of the Curtis–Godson approximation. By ignor-
ing the small temperature dependence of the half-width, that is
α
˜α
≈
p
˜
p
(7.229)
we obtain the so-called pressure scaling factor
˜
p
˜
p =
S(T ) pd u
S(T )du
(7.230)

7.4 Transmission in inhomogeneous atmospheres 259
To simulate the transmission through an inhomogeneous atmosphere by an equiv-
alent homogeneous layer, using Goody’s (1964b) notation, we employ the adjusted
parameters
˜
S,
˜
a,
˜
u. Thus, instead of (7.219) (omitting the summation sign), we
write
T =
1
ν
ν
exp
−
˜
S ˜α
˜
u
π[(ν − ν
0
)
2
+ ˜α
2
]
dν (7.231)
We now wish to obtain explicit expressions for
˜
S,
˜
a and
˜
u. Comparing (7.231) with
(7.225) and utilizing (7.228) gives
˜
S ˜α
˜
u =
Sαdu,
˜
S
˜
u =
Sd u,
˜
u =
Sd u
˜
S
(7.232)
For a moment one is tempted to conclude that we have a three-parameter approxi-
mation. However, only the parameters
˜
a and
˜
u are needed. The pressure variation of
the inhomogeneous atmosphere is included in (7.228) or (7.230) while the temper-
ature variation is modeled by (7.232). The mean line intensity
˜
S can be evaluated
at any specified temperature since the effect of this temperature cancels. Thus the
two scaling parameters are
˜
a (or
˜
p) and
˜
u.
For a system of many lines the principle of the Curtis–Godson approximation
is the same as for a single line. We repeat equation (7.219) but we introduce the
line-shape factor of the Lorentzian line according to (7.18)
T (u) =
1
ν
ν
exp
−
i
S
i
f (ν − ν
0,i
,α
i
)du
dν (7.233)
In case of the weak line approximation this equation assumes the form
T
w
(u) = 1 −
1
ν
i
S
i
ν
f (ν − ν
0,i
,α
i
)dν du = 1 −
1
ν
i
S
i
dν
(7.234)
where we have assumed that the normalization condition (7.17) of the line-shape
factor is valid in the frequency interval ν. In order to introduce the strong line
approximation, as before, in the denominator of (7.219) we replace the half-width
by the constant
˜
a
i
yielding
T
s
(u) =
1
ν
ν
exp
−
i
S
i
π
α
i
(ν − ν
0,i
)
2
+ ˜α
2
i
du
dν (7.235)

260 Transmission in spectral lines and bands of lines
To obtain the proper value for
˜
a that fits the strong line and the weak line approxi-
mation, we expand the exponent and find
T
w
(u) = 1 −
1
ν
i
S
i
α
i
˜α
i
ν
f (ν − ν
0,i
, ˜α
i
)dν du = 1 −
1
ν
i
S
i
α
i
˜α
i
du
(7.236)
We proceed analogously to the single line case by comparing (7.234) and (7.236).
This gives
i
S
i
du =
i
S
i
p
˜
p
du (7.237)
Since the pressure dependence of each line is identical, we obtain the first scaling
parameter
˜
p =
σ pd u
σ du
(7.238)
where σ = 1/N
i
S
i
is the mean line intensity. In case of a single line this equa-
tion, as it should, reduces to (7.230).
Now we need to find the second scaling parameter. Let us reconsider equation
(7.219) whose exact analogy to a homogeneous path can be written as
T (u) =
1
ν
ν
exp
−
i
˜
S
i
˜α
i
˜
u
π
(ν − ν
0,i
)
2
+ ˜α
2
i
dν (7.239)
Comparison of (7.235) with (7.239) gives the second scaling parameter
˜
u =
i
S
i
α
i
(ν − ν
0,i
)
2
+ ˜α
2
i
du
i
˜
S
i
˜α
i
(ν − ν
0,i
)
2
+ ˜α
2
i
(7.240)
Recalling (7.228) and applying it to line i, after introducing the line-shape factors,
cf. (7.18), results in
˜
u =
i
f (ν − ν
0,i
, ˜α
i
)
S
i
du
i
f (ν − ν
0,i
, ˜α
i
)
˜
S
i
(7.241)
which is the scaled absorber mass. The line intensity
˜
S
i
, as explained before, can
be evaluated at any specified temperature.
7.5 Results 261
The quality of the Curtis–Godson approximation for spectral intervals contain-
ing many spectral lines has been tested by Walshaw and Rodgers (1963). They
performed extensive cooling rate calculations using a line-by-line integration tech-
nique. For the water vapor rotational band and the 15
µmCO
2
band they found
errors less than a few percent. Various authors have investigated the accuracy of
the Curtis–Godson approximation. For example, Zdunkowski and Raymond (1970)
investigated the transmission in small spectral intervals in the 1.9 and 6.3
µm water
vapor bands. They found excellent agreement between the exact calculations and
the Curtis–Godson approximation. The Curtis–Godson approximation may also be
applied to other line shapes than the Lorentz line, but we omit any discussion.
While in many situations the Curtis–Godson approximation provides satisfactory
results for atmospheric water vapor and carbon dioxide distributions, the method is
less satisfactory for the 9.6
µm ozone band. Goody (1964b) employed van de Hulst’s
(1945) rather general technique to handle the transmission calculations pertaining
to inhomogeneous atmospheres. This technique is based on the series expansion of
the Fourier cosine transform permitting the formulation of three scaling parame-
ters. The extension of the Curtis–Godson scaling method resulted in a significant
improvement of the transmission calculations. It is also possible to use additional
scaling parameters. This, however, greatly complicates the calculation procedure.
For more details the reader is referred to Goody’s original work.
7.5 Results
In this section we will briefly consider some typical vertical profiles of solar and
infrared flux densities as well as radiative temperature changes which have been
obtained by means of the radiation transfer model DISORT (Stamnes et al., 1988)
with a total of four discrete streams. To handle the spectrally dependent absorption
by atmospheric gases we have used the correlated k-distribution parameterization
of Fu and Liou (1992). Presently this appears to be the most efficient yet sufficiently
accurate way to handle the spectral integration. The calculations specify the ground
albedo and the solar zenith angle as A
g
= 0.1 and θ
0
= 30
◦
for the solar spectrum
and a ground emissivity ε
g
= 1 for the entire thermal emission spectrum. Further-
more, the calculations assume clear sky conditions (no clouds and no aerosol) in
a mid-latitude summer atmosphere with typical vertical distributions of the radia-
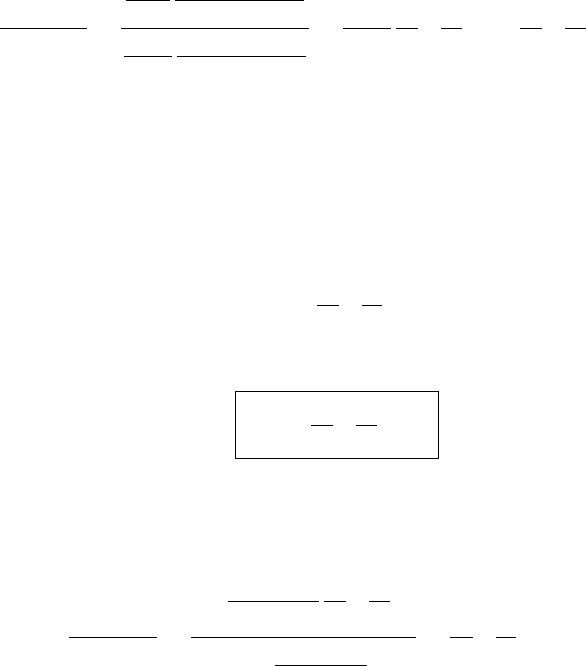
tively relevant atmospheric trace gases. Figure 7.16 shows the vertical distributions
of temperature, relative humidity and those of the atmospheric trace gases which
have been used in the radiation calculations. The height constant CO
2
volume mix-
ing ratio has been set to 350 ppmv where 1 ppmv = 10
−6
. The integrated or total
amount of ozone in a vertical column above the surface of the Earth is expressed
in atmosphere centimeters (atm-cm) which is the height of the resulting volume
262 Transmission in spectral lines and bands of lines
220 240 260 280 300
Temperature (K)
0
10
20
30
40
50
60
Altitude (km)
0 20 40 60 80 100
Relative humidity (%)
0
10
20
30
40
50
60
Altitude (km)
10
−10
10
−8
10
−6
10
−4
10
−2
10
0
Volume mixing ratio
0
10
20
30
40
50
60
Altitude (km)
H
2
O
CO
CO
2
O
3
N
2
O
CH
4
O
2
Fig. 7.16 Vertical distributions of temperature, relative humidity and the radia-
tively active trace gases for a mid-latitude summer atmosphere.
7.5 Results 263
0 200 400 600 800 1000 1200
Flux density (W m
−2
)
0
10
20
30
40
50
60
Altitude (km)
s,dir
s, +dir
s,
i,i,
t,
t, net
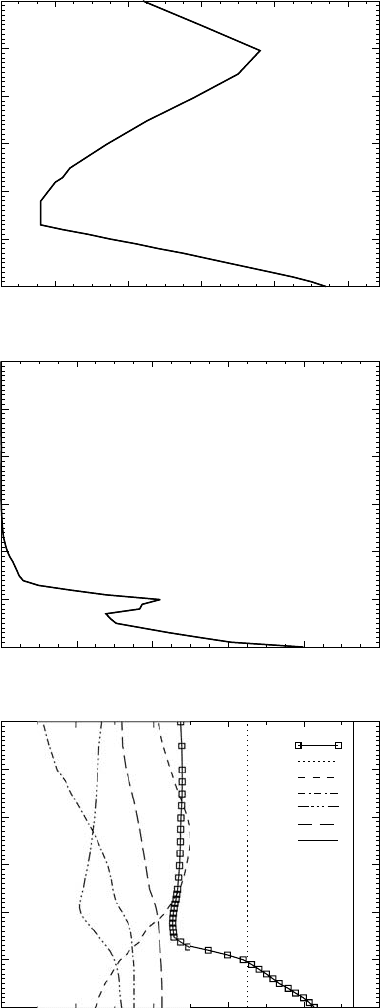
Fig. 7.17 Distribution of upward (↑), downward (↓) and net flux densities labeled
as s (solar), i (infrared), t (total), s,dir (direct downward solar radiation) and net
(net radiation).
if all the ozone in the column of unit area were brought to normal pressure and
temperature (NTP). Currently, the total amount of atmospheric ozone is expressed
in terms of Dobson units (DU) where 1 DU = 10
−3
atm-cm NTP. The total ozone
column shown in Figure 7.16 amounts to 330 DU.
The absorption bands of the gases have been fully accounted for in the solar and in
the infrared spectrum. All transfer calculations pertaining to the solar spectrum use
a solar constant of 1368 W m
−2
while the infrared calculations assume a black-body
ground emission.
Figure 7.17 depicts the upward and downward directed solar and infrared flux
densities and the corresponding net flux density. The value of the upward solar flux
density at the ground is found by multiplying the value of total downward solar
radiation reaching the ground (s,↓+dir) by A
g
= 0.1. The flux densities at the
ground are needed to formulate energy boundary conditions in the thermodynamic
parts of weather and climate prediction models. Of particular interest is the radiative
flux divergence of the combined solar and infrared spectrum, which is needed to
evaluate thermodynamic equations of the type (2.44).
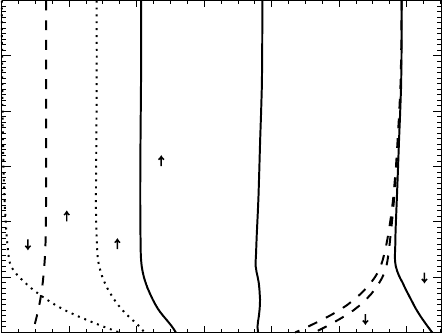
Radiative heating rates corresponding to the radiative flux densities of
Figure 7.17 are shown in Figure 7.18. While the vertical flux density profiles are
rather smooth, radiative temperature changes vary quite rapidly with height. This
variation results from the vertical structure of the volume mixing ratio of the trace
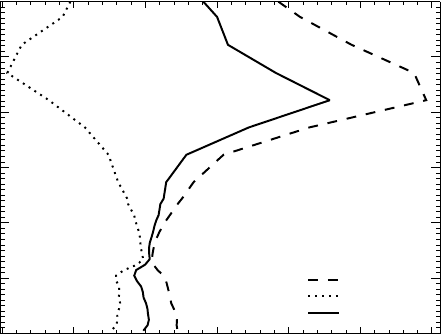
264 Transmission in spectral lines and bands of lines
−10 −5 0 5 10 15 20
Heating rate (K day
−1
)
0
10
20
30
40
50
60
Altitude (km)
solar
infrared
net
Fig. 7.18 Solar heating rates, infrared cooling rates and the net radiative temper-
ature changes expressed in K day
−1
.
gases and from the atmospheric vertical temperature distribution. Inspection of the
curves shows that solar heating at the ground amounts to about2Kday
−1
. Had a
normal aerosol distribution been included, we would have calculated an additional
heating of about 0.1 K day
−1
. This is a small but not entirely negligible effect.
Since aerosol concentrations usually decrease with height, the aerosol contribution
to the heating rate is negligible at some height above the atmospheric boundary
layer. Solar heating, mainly caused by the presence of water vapor, decreases rather
rapidly with height in the troposphere due to the vertically decreasing water vapor
concentration. In the stratosphere strong solar heating is observed resulting from an
increase of the ozone volume mixing ratio with height. At a height of 42 km where
the ozone concentration begins to decrease, a maximum value of nearly 20 K day
−1
is obtained. For a smaller value of µ
0
maximum heating would have occurred at a
somewhat smaller height. For increasing values of µ
0
solar heating is most effective
in the upper part of the O
3
layer. As stands to reason, maximum heating will then
be less intense due to the smaller O
3
concentations existing there.
Let us now consider the infrared cooling rates which strongly depend on the con-
centration of the absorbing and emitting gases and also on the vertical temperature
distribution. For the midlatitude summer model, the tropospheric cooling rate of
2 K day
−1
, mostly due to water vapor absorption bands, is nearly height constant.
Additional calculations (not shown) reveal that larger tropospheric cooling will be
found in the moist tropical and smaller cooling in arctic air masses. Moreover, the
cooling rates will be strongly modified by the presence of clouds.