Zdunkowski W., Trautmann T., Bott A. Radiation in the atmosphere: A course in Theoretical Meteorology
Подождите немного. Документ загружается.


7.2 Band models 225
interval at ν = 0isk
ν,i
. The contribution from all N lines in the spectral interval is
N
i=1
k
ν,i
. Therefore, the resultant transmission is given by
T
ν=0
(u) = exp
−
N
i=1
k
ν,i
u
=
N
!
i=1
exp(−k
ν,i
u) (7.84)
We have assumed that the lines in this superficial spectrum are randomly spaced.
Due to the random spacing, the probability for a line to be located in the interval ν
i
to ν
i
+ dν
i
is dν
i
/δ. Consequently, the joint probability for lines to be located in
the intervals extending from ν
1
to ν
1
+ dν
1
, ν
2
to ν
2
+ dν
2
, ..., ν
i
to ν
i
+ dν
i
, ...,
ν
N
to ν
N
+ dν
N
is given by
.
N
i=1
dν
i
/δ.
In order to allow for all possible arrangements of lines we must permit each
line to be located anywhere in the interval ν extending from −N δ/2toN δ/2.
Therefore, the average value of (7.84) over the interval is given by
T (u) =
N
!
i=1
1
δ
N δ/2
−N δ/2
exp(−k
ν,i
u)dν
i
N
!
i=1
1
δ
N δ/2
−N δ/2
dν
i
(7.85)
Assuming that each arrangement of lines is equally probable then (7.85) can be
simplified substantially. Instead of the product
.
N
i=1
we obtain the N -th power so
that (7.85) can be written as
T (u) =
1
N δ
N δ/2
−N δ/2
exp
(
−k
ν
u
)
dν
N
=
1 −
1
N δ
N δ/2
−N δ/2
[1 − exp(−k
ν
u)]dν
N
(7.86)
If we permit the number of lines to be very large (N →∞) then this equation
becomes the exponential function
T (u) = exp
−
1
δ
∞
−∞
[1 − exp(−k
ν
u)]dν
= exp
−
W (u)
δ
(7.87)
where we have used the definition (7.50) of the equivalent width. It should be
noted that no particular line profile has been specified in the derivation of (7.87).
In general, we will use the Lorentz profile to specify the absorption coefficient.
The artificial situation of lines with equal intensity will now be generalized to
a more realistic spectrum consisting of randomly distributed lines with different
intensities. Let us consider a certain frequency range containing N lines. Each of
these is assumed to belong to an infinite array of randomly spaced lines of equal

226 Transmission in spectral lines and bands of lines
intensity and mean spacing N δ. According to (7.87) the mean transmission of array
i is given by
T
i
(u) = exp
−
W
i
(u)
N δ
(7.88)
Due to the assumption of randomness in each array we may expect that the multi-
plication property (7.49) also applies so that
T (u) =
N
!
i=1
T
i
(u) = exp
−
1
N δ
N
i=1
W
i
(u)
(7.89)
or
T
G
(u) = exp
−
W (u)
δ
= exp[−A(u)]
(7.90)
The transmission function T
G
(u) is due to Goody (1952). Sometimes (7.90) is also
attributed to Mayer (1947) and one speaks of the Mayer–Goody model.
In the following we will show how to find A(u). Since (7.90) refers to a realistic
spectrum, the line intensities of the N lines vary in strength. In order to account for
this situation various probability distributions p(S) for the distributions of S have
been proposed in the literature. We are going to discuss three prominent models.
Goody’s exponential model
Goody (1952) proposed the following distribution for the line intensities
p(S) =
1
σ
exp
(
−S/σ
)
(7.91)
where σ is the average value of the line intensity in the given spectral interval. The
quantity p(S)dS then gives the percentage of lines in the spectral interval which
belong to the line intensity interval (S, S + dS). It is easily seen that the probability
distribution (7.91) fulfils the normalization condition
∞
0
p(S)dS = 1 (7.92)
The expectation value for the absorption A(u) due to the exponential model is
obtained from
A(u) =
∞
0
p(S)A(S, u)dS
with A(S, u) =
1
δ
∞
−∞
1 − exp
(
− f
ν
Su
)
dν
(7.93)

7.2 Band models 227
Introducing (7.91) into (7.93) yields
A(u) =
∞
0
1
σ
exp
−
S
σ
1
δ
∞
−∞
[1 − exp
(
− f
ν
Su
)
]dνdS =
1
δ
∞
−∞
f
ν
uσ
1 + f
ν
uσ
dν
(7.94)
In the following we will use the line-shape factor of the Lorentz line (7.18) for
ν
0
= 0. Employing the substitutions
¯
u =
σ u
2πα
L
, y =
α
L
δ
(7.95)
we obtain for the average absorption of the exponential model
A(u) =
∞
−∞
2
¯
uα
L
y
ν
2
+ α
2
L
(1 + 2
¯
u)
dν =
2π
¯
uy
√
1 + 2
¯
u
(7.96)
The parameters σ and α
L
, or equivalently
¯
u and y, have not been specified so
far. They can be determined by the so-called matching principle, i.e. one forces
the random band model to obey the limiting forms of the weak and the strong line
approximation (7.82) and (7.83) of the band model with non-overlapping lines.
Thus the matching principle can also be viewed as the closure assumption of the
random band models. For the weak line and strong line approximation we find
using (7.96)
¯
u 1: 2π y
¯
u =
1
N δ
N
i=1
S
i
u
¯
u 1: π y
√
2
¯
u =
2
N δ
N
i=1
-
S
i
α
L,i
u
(7.97)
These two equations can be used to determine the unknown parameters
¯
u and y.
The result is
¯
u =
u
8
C
2
D
2
, y =
4
π N δ
D
2
C
with C =
N
i=1
S
i
, D =
N
i=1
-
S
i
α
L,i
(7.98)
The exponential distribution for S as assumed in the Goody model involves a
range of line intensities. It is clear that the strongest lines will be most important
for very short path lengths, while the very weak line intensities dominate the trans-
mission of radiation over very long path lengths. Therefore, in order to correctly
describe the mean transmission for arbitrary path lengths, the distribution function

228 Transmission in spectral lines and bands of lines
for S must be carefully chosen. While the exponential distribution leads to a simple
expression, in several cases the model provides rather inaccurate representations of
the line intensities in atmospheric bands. For example, in the case of water vapor,
the exponential distribution fails to account for the large number of weak lines in the
bands between 50 and 100
µm wavelength. For more details see Goody and Yung
(1989).
Godson’s inverse power model
Godson (1955) applied an inverse power law to describe the distribution of line
intensities as
p(S) =
κ
S
for S
0
< S ≤ S
1
0 for S > S
1
(7.99)
The constant κ is a model parameter which is used to normalize the probability
distribution according to (7.92). The expectation value for absorption, employing
the inverse power law, is given by
A(u) = lim
S
0
→0
1
δ
S
1
S
0
κ
S
∞
−∞
[1 − exp
(
− f
ν
Su
)
]dνdS (7.100)
Since p(S) approaches infinity if S
0
→ 0, the limiting value of the integral must be
considered. Using the substitutions
¯
u =
Su
2πα
, x =
κν
δ
, y =
κα
δ
(7.101)
we obtain for a Lorentz line the intermediate result
A(
¯
u
1
) = lim
¯
u
0
→0
¯
u
1
¯
u
0
1
¯
u
∞
−∞
1 − exp
−2
¯
uy
2
x
2
+ y
2
dxd
¯
u (7.102)
where the upper bound
¯
u
1
implicitly contains the dependence on u and S
1
.It
is convenient to carry out the integration over x first. From Appendix 7.5.2 we
know
∞
−∞
1 − exp
−
2
¯
uy
2
(x
2
+ y
2
)
dx = 2π y
¯
u exp
(
−
¯
u
)
[I
0
(
¯
u) + I
1
(
¯
u)] (7.103)
Inserting this expression in (7.102) yields
A(
¯
u
1
) = 2π y lim
¯
u
0
→0
¯
u
1
¯
u
0
exp
(
−
¯
u
)
[I
0
(
¯
u) + I
1
(
¯
u)]d
¯
u (7.104)

7.2 Band models 229
The modified Bessel functions fulfill the following functional relations
(a)
d
dx
[x
−ν
I
ν
(x)] = x
−ν
I
ν+1
(x)
(b)
d
dx
[x exp
(
−x
)
(I
0
(x) + I
1
(x))] = exp
(
−x
)
I
0
(x)
(7.105)
where ν is a fixed real number. Integration by parts of the following integral gives
¯
u
1
¯
u
0
exp
(
−
¯
u
)
I
1
(
¯
u)d
¯
u =
¯
u
1
¯
u
0
exp
(
−
¯
u
)
I
0
(
¯
u)d
¯
u + exp
(
−
¯
u
)
I
0
(
¯
u)
¯
u
1
¯
u
0
(7.106)
where (7.105a) with ν = 0 has been used. Substituting this equation into (7.104)
we obtain
A(
¯
u
1
) = 2π y lim
¯
u
0
→0
¯
u
1
¯
u
0
2exp
(
−
¯
u
)
I
0
(
¯
u)d
¯
u + 2π y exp
(
−
¯
u
)
I
0
(
¯
u)
¯
u
1
¯
u
0
(7.107)
The integral on the right-hand side of this equation may be evaluated by means of
(7.105b) yielding
A(
¯
u
1
) = 2π y[2
¯
u
1
exp
(
−
¯
u
1
)
[
I
0
(
¯
u
1
) + I
1
(
¯
u
1
)
]
+ exp
(
−
¯
u
1
)
I
0
(
¯
u
1
)]
−2π y lim
¯
u
0
→0
[2
¯
u
0
exp
(
−
¯
u
0
)
[
I
0
(
¯
u
0
) + I
1
(
¯
u
0
)
]
+ exp
(
−
¯
u
0
)
I
0
(
¯
u
0
)] (7.108)
and hence
A(
¯
u
1
) = 2π y[2
¯
u
1
exp
(
−
¯
u
1
)
[
I
0
(
¯
u
1
) + I
1
(
¯
u
1
)
]
+ exp
(
−
¯
u
1
)
I
0
(
¯
u
1
)] − 2π y
(7.109)
Here, use was made of I
0
(0) = 1 and I
1
(0) = 0, see (7.71). This is the final form
of the mean absorption of Godson’s model.
The unknown parameters y and
¯
u
1
will again be determined by requiring in the
weak and strong line limit agreement between the Godson model and the band
model for nonoverlapping lines
¯
u
1
1: 2π y
¯
u
1
=
1
N δ
N
i=1
S
i
u
¯
u
1
1: 4y
-
2π
¯
u
1
=
2
N δ
N
i=1
-
S
i
α
i
u
(7.110)

230 Transmission in spectral lines and bands of lines
Solving these two equations gives
¯
u
1
=
2u
π
C
2
D
2
, y =
1
4N δ
D
2
C
(7.111)
where C and D are given by (7.98). The Godson model allows for a good
representation of weak lines in certain absorption bands and is usually more accurate
than the exponential law.
The Malkmus model
So far the most successful statistical model is due to Malkmus (1967). This model
is a combination of the Goody and the Godson model. Malkmus also observed
that the exponential distribution (7.91) substantially underestimates the number of
weak lines. If we consider only the Boltzmann factor in the line intensity formula
to be discussed in a later chapter, then S ∼ exp [−E /kT ], where E represents
the lower energy level in a molecular transition. From this relation he concludes
that dE/dS ∼ S
−1
. In many cases the number density of lines, n, is approximately
equally spaced with respect to variations in E, that is dn/dE ∼ const. The prob-
ability p(S)dS to find lines with intensity S must be proportional to the change of
n versus S. Therefore, we obtain the relationship
p(S) ∼
dn
dS
∼
dn
dE
dE
dS
∼
dE
dS
∼
1
S
(7.112)
which shows that p(S) should vary as S
−1
. Indeed, it is this dominating influ-
ence which determines the accuracy of the average band absorption. For this rea-
son Malkmus proposes a multiplicative combination of Goody’s and Godson’s
statistical models, that is
p(S) =
1
S
exp
−
S
σ
(7.113)
where σ is the average value of the line intensities. For S = 0 the function p(S)of
the Godson and the Malkmus model is not defined. Nevertheless, both models can
be applied by using a limiting procedure.
The average absorption A(u) due to the Malkmus model is now given by
A(u) = lim
ε→0
∞
ε
1
S
exp
−
S
σ
1
δ
∞
−∞
[1 − exp
(
− f
ν
Su
)
]dνdS (7.114)

7.2 Band models 231
The integral over S will be evaluated by means of
lim
ε→0
∞
ε
1
S
exp
−
S
σ
[1 − exp
(
− f
ν
Su
)
]dS
= lim
ε→0
∞
ε
1
S
exp
−
S
σ
dS − lim
ε
→0
∞
ε
1
S
exp
−
S
σ
dS
=−lim
ε→0
ln ε −
ε
σ
+
1
4
ε
σ
2
−
1
18
ε
σ
3
±···
(7.115)
+ lim
ε
→0
ln ε
−
ε
σ
+
1
4
ε
σ
2
−
1
18
ε
σ
3
±···
= ln(1 + σ f
ν
u)
where the substitutions S
= S(1 + σ f
ν
u) and ε
= ε(1 + σ f
ν
u) have been
introduced. Furthermore, it should be noted that the contributions of the upper
limit of the integrals over S and S
cancel so that only the difference of the lower
integral limits remains.
Substituting this result into (7.114) and applying the Lorentz line-shape factor
gives the average absorption of the Malkmus model
A(u) =
1
δ
∞
−∞
ln(1 + σ f
ν
u)dν = 2π y(
√
1 + 2
¯
u − 1)
(7.116)
with y = α
L
/δ and
¯
u = σ u/(2πα
L
). Finally, with the help of the matching proce-
dure we obtain
¯
u 1: 2π y
¯
u =
1
ν
N
i=1
S
i
u
¯
u 1: 2π y
√
2
¯
u =
2
ν
N
i=1
-
S
i
α
i
u
(7.117)
so that the unknown parameters y and
¯
u are given as
¯
u =
u
2
C
2
D
2
, y =
1
πν
D
2
C
(7.118)
The terms C and D are again given by (7.98). Applications of the Malkmus model
can be found, for example, in Crisp et al. (1986) and Lacis and Oinas (1991).
It should be observed that the absorption equations (7.96), (7.109) and (7.116)
have been derived on the assumption that only the intensities vary from line to
line. The model parameters
¯
u and y employ the complete spectral data so that the
variation of the half-width from line to line is also taken into account.
232 Transmission in spectral lines and bands of lines
f
E
()
−110
x
ν
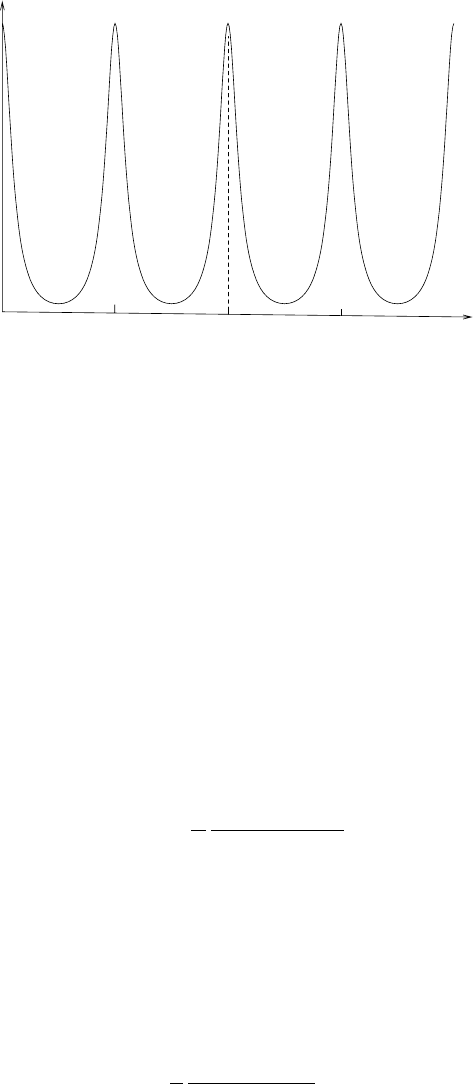
Fig. 7.7 Line-shape factor of Elsasser’s regular band model with x = ν/δ.
The model parameters
¯
u and y have been determined for the three statistical
models using different formulations of p(S). We are now in the position to employ
the Mayer–Goody transmission formula (7.90) with some confidence. The spectral
data required to evaluate
¯
u and y are given in Goody (1964a) or in Goody and Yung
(1989). This part of the sections on band models largely follow Goody’s (1964a)
excellent text.
7.2.4 Elsasser’s regular model
Spectra of linear molecules such as CO
2
often appear as a superposition of arrays
of more or less regularly spaced lines with nearly identical line shape. Due to
this observation Elsasser (1942) constructed a band model consisting of an infinite
number of evenly spaced identical Lorentz lines. The absorption coefficient is given
by the superposition of all lines, that is
k
ν,E
=
∞
n=−∞
S
π
α
L
(ν − nδ)
2
+ α
2
L
(7.119)
Figure 7.7 illustrates the line-shape factor f
E
(ν) = k
ν,E
/S of the Elsasser band
model. The spectral lines are separated by the distance δ.
The function k
ν,E
possesses an infinite number of simple poles at ν = jδ ± iα
L
.
With the help of the Mittag–Leffler theorem, see Appendix 7.6.3, the infinite sum
can be stated as a closed expression involving periodic and hyperbolic functions.
This leads to the absorption coefficient
k(s) =
S
δ
sinh β
cosh β − cos s
(7.120)

7.2 Band models 233
where s = 2πν/δ and β = 2πα
L
/δ. Figure 7.7 suggests that k
ν
varies periodically
within the bounds k
min
≤ k
ν
≤ k
max
. From (7.120) we immediately find
k
min
=
S
δ
sinh β
cosh β + 1
, k
max
=
S
δ
sinh β
cosh β − 1
(7.121)
Next we will compute the average transmission of the regular band. Due to the
periodicity it is sufficient to average over the interval [−δ/2,δ/2], i.e.
T (u) =
1
δ
δ/2
−δ/2
exp
(
−k
ν
u
)
dν =
1
2π
π
−π
exp
[
−k(s)u
]
ds
(7.122)
It is convenient to determine the first derivative of T with respect to u
dT
du
=−
1
2π
π
−π
k(s)exp
[
−k(s)u
]
ds (7.123)
Substituting
cos φ =
1 − cosh β cos s
cosh β − cos s
(7.124)
gives
dφ =−
cosh β − cos φ
sinh β
ds =−k(φ)
δ
S
ds (7.125)
The latter expression is valid since by means of simple trigonometric manipulations
it can be shown that
cosh β − cos φ
sinh β
=
sinh β
cosh β − cos s
(7.126)
Using the above relations (7.123) may be rewritten as
dT
du
=
S
2πδ
2π
0
exp
−
Su
δ
cosh β − cos φ
sinh β
dφ (7.127)
If we substitute in the argument of the exponential function the expression
y =
Su
δ sinh β
(7.128)
we obtain
dT
dy
=
sinh β
2π
exp
(
−y cosh β
)
2π
0
exp
(
y cos φ
)
dφ (7.129)

234 Transmission in spectral lines and bands of lines
The Bessel functions J
n
of the first kind can be expressed by the following
definite integral (Watson, 1980)
J
n
(x) =
(−i)
n
2π
π
−π
cos(nw)exp
(
ix cos w
)
dw, n ∈ N
0
(7.130)
Substitution of φ = π − w yields
J
n
(x) =
(−i)
n
2π
2π
0
cos(nπ − nφ)exp
[
ix cos(π − φ)
]
dφ (7.131)
which for n = 0 and y =−ix turns into
J
0
(iy) =
1
2π
2π
0
exp
(
y cos φ
)
dφ (7.132)
Hence (7.129) can be expressed as
dT
dy
= sinh β exp
(
−y cosh β
)
J
0
(iy) (7.133)
A final substitution of Y = y sinh β = Su/δ then leads to a formula for the average
transmission of the Elsasser model
T (Y ) =
∞
Y
exp(−Y
coth β)J
0
iY
sinh β
dY
(7.134)
There are no analytical solutions to this integral. However, results can be found by
means of numerical integration.
From Figure 7.7 we conclude that there exists an average value
¯
k for the
absorption coefficient k
ν
. For the rapidly varying absorption coefficients of real
spectra it is usually impossible to give a reliable value of
¯
k. Formally we have
¯
k =
1
δ
δ/2
−δ/2
S
δ
sinh β
cosh β − cos(2πν/δ)
dν (7.135)
Using the indefinite integral
dx
b + c cos ax
=
2
a
√
b
2
− c
2
tan
−1
(b − c) tan(ax /2)
√
b
2
− c
2
for b
2
> c
2
(7.136)
listed in integration tables, we find the expected result
¯
k =
S
δ
(7.137)
This relation could have been guessed from Figure 7.7, since within the periodic
pattern of Lorentz lines the area under each line is S. Despite the fact that within