Wallace J.M., Hobbs P.V. Atmospheric Science. An Introductory Survey
Подождите немного. Документ загружается.


74 Atmospheric Thermodynamics
If we are dealing with a unit mass of a substance,
the volume V is replaced by the specific volume
.
Therefore, the work dw that is done when the spe-
cific volume increases by d
is
(3.37)
Combination of (3.34) and (3.37) yields
(3.38)
which is an alternative statement of the first law of
thermodynamics.
18
3.3.1 Joule’s Law
Following a series of laboratory experiments on air,
Joule
19
concluded in 1848 that when a gas expands
without doing external work, by expanding into a
chamber that has been evacuated, and without taking
in or giving out heat, the temperature of the gas does
dq du pd
dw pd
not change. This statement, which is known as Joule’s
law, is strictly true only for an ideal gas, but air (and
many other gases) behaves very similarly to an ideal
gas over a wide range of conditions.
Joule’s law leads to an important conclusion con-
cerning the internal energy of an ideal gas. If a gas
neither does external work nor takes in or gives out
heat, dw 0 and dq 0 in (3.38), so that du 0.
Also, according to Joule’s law, under these conditions
the temperature of the gas does not change, which
implies that the kinetic energy of the molecules
remains constant. Therefore, because the total inter-
nal energy of the gas is constant, that part of the
internal energy due to the potential energy must also
remain unchanged, even though the volume of the
gas changes. In other words, the internal energy of an
ideal gas is independent of its volume if the tempera-
ture is kept constant. This can be the case only if the
molecules of an ideal gas do not exert forces on each
other. In this case, the internal energy of an ideal gas
will depend only on its temperature.
20
18
We have assumed here that the only work done by or on a system is due to a change in the volume of the system. However, there are
other ways in which a system may do work, e.g., by the creation of new surface area between two phases (such as between liquid and air
when a soap film is formed). Unless stated otherwise, we will assume that the work done by or on a system is due entirely to changes in the
volume of the system.
19
James Prescott Joule (1818–1889) Son of a wealthy English brewer; one of the great experimentalists of the 19th century. He started
his scientific work (carried out in laboratories in his home and at his own expense) at age 19. He measured the mechanical equivalent of
heat, recognized the dynamical nature of heat, and developed the principle of conservation of energy.
20
Subsequent experiments carried out by Lord Kelvin
21
revealed the existence of small forces between the molecules of a gas.
21
Lord Kelvin 1st Baron (William Thomson) (1824–1907) Scottish mathematician and physicist. Entered Glasgow University at age 11.
At 22 became Professor of Natural Philosophy at the same university. Carried out incomparable work in thermodynamics, electricity, and
hydrodynamics.
Box 3.1. showed that the gas laws can be illus-
trated by picturing the molecules of a gas as
elastic balls bouncing around randomly in a
handball court. Suppose now that the walls of
the court are permitted to move outward when
subjected to a force. The force on the walls is
supplied by the impact of the balls, and the work
required to move the walls outward comes from
a decrease in the kinetic energy of the balls that
rebound from the walls with lower velocities
than they struck them. This decrease in kinetic
energy is in accordance with the first law of
thermodynamics under adiabatic conditions. The
work done by the system by pushing the walls
outward is equal to the decrease in the internal
energy of the system [see (3.38)]. Of course, if
the outside of the walls of the court are bom-
barded by balls in a similar manner to the inside
walls, there will be no net force on the walls and
no work will be done.
3.2 More Handball?
P732951-Ch03.qxd 9/12/05 7:41 PM Page 74

3.3 The First Law of Thermodynamics 75
3.3.2 Specific Heats
Suppose a small quantity of heat dq is given to a unit
mass of a material and, as a consequence, the tem-
perature of the material increases from T to T dT
without any changes in phase occurring within the
material. The ratio dqdT is called the specific heat of
the material. The specific heat defined in this way
could have any number of values, depending on how
the material changes as it receives the heat. If the
volume of the material is kept constant, a specific
heat at constant volume c
v
is defined
(3.39)
However, if the volume of the material is constant
(3.38) becomes dq du.Therefore
For an ideal gas, Joule’s law applies and therefore u
depends only on temperature. Therefore, regardless
of whether the volume of a gas changes, we may write
(3.40)
From (3.38) and (3.40), the first law of thermody-
namics for an ideal gas can be written in the form
22
(3.41)
Because u is a function of state, no matter how the
material changes from state 1 to state 2, the change
in its internal energy is, from (3.40),
We can also define a specific heat at constant
pressure c
p
(3.42)c
p
dq
dT
p const
u
2
u
1
T
2
T
1
c
v
dT
dq c
v
dT pd
c
v
du
dT
c
v
du
dT
v const
c
v
dq
dT
v const
where the material is allowed to expand as heat is
added to it and its temperature rises, but its pressure
remains constant. In this case, a certain amount of
the heat added to the material will have to be
expended to do work as the system expands against
the constant pressure of its environment.Therefore, a
larger quantity of heat must be added to the material
to raise its temperature by a given amount than if the
volume of the material were kept constant. For the
case of an ideal gas, this inequality can be seen math-
ematically as follows. Equation (3.41) can be rewrit-
ten in the form
(3.43)
From the ideal gas equation (3.3), d(p
) RdT.
Therefore (3.43) becomes
(3.44)
At constant pressure, the last term in (3.44) vanishes;
therefore, from (3.42) and (3.44),
(3.45)
The specific heats at constant volume and at con-
stant pressure for dry air are 717 and 1004 J K
1
kg
1
, respectively, and the difference between
them is 287 J K
1
kg
1
, which is the gas constant
for dry air. It can be shown that for ideal
monatomic gases c
p
:c
v
:R 5:3:2, and for ideal
diatomic gases c
p
:c
v
:R 7:5:2.
By combining (3.44) and (3.45) we obtain an alter-
nate form of the first law of thermodynamics:
(3.46)
3.3.3 Enthalpy
If heat is added to a material at constant pressure
so that the specific volume of the material
increases from
1
to
2
, the work done by a unit
mass of the material is p(
2
1
). Therefore,
from (3.38), the finite quantity of heat q added to
dq c
p
dT
dp
c
p
c
v
R
dq (c
v
R)dT
dp
dq c
v
dT d(p
)
dp
22
The term dq is sometimes called the diabatic (or nonadiabatic) heating or cooling, where “diabatic” means involving the transfer of
heat. The term “diabatic” would be redundant if “heating” and “cooling” were always taken to mean “the addition or removal of heat.”
However, “heating” and “cooling” are often used in the sense of “to raise or lower the temperature of,” in which case it is meaningful to
distinguish between that part of the temperature change dT due to diabatic effects (dq) and that part due to adiabatic effects (pd
).
P732951-Ch03.qxd 9/12/05 7:41 PM Page 75

76 Atmospheric Thermodynamics
a unit mass of the material at constant pressure is
given by
where u
1
and u
2
are, respectively, the initial and final
internal energies for a unit mass of the material.
Therefore, at constant pressure,
where h is the enthalpy of a unit mass of the material,
which is defined by
(3.47)
Because u, p, and
are functions of state, h is a func-
tion of state. Differentiating (3.47), we obtain
Substituting for du from (3.40) and combining with
(3.43), we obtain
(3.48)
which is yet another form of the first law of thermo-
dynamics.
By comparing (3.46) and (3.48) we see that
(3.49)
or, in integrated form,
(3.50)
where h is taken as zero when T 0. In view of
(3.50), h corresponds to the heat required to raise the
temperature of a material from 0 to T K at constant
pressure.
When a layer of air that is at rest and in hydrostatic
balance is heated, for example, by radiative transfer,
the weight of the overlying air pressing down on it
h c
p
T
dh c
p
dT
dq dh
dp
dh du d(p
)
h # u p
q h
2
h
1
(u
2
p
2
) (u
1
p
1
)
q (u
2
u
1
) p(
2
1
)
remains constant. Hence, the heating is at constant
pressure.The energy added to the air is realized in the
form of an increase in enthalpy (or sensible heat,as
atmospheric scientists commonly refer to it) and
The air within the layer expands as it warms, doing
work on the overlying air by lifting it against the
Earth’s gravitational attraction. Of the energy per
unit mass imparted to the air by the heating, we see
from (3.40) and (3.41) that du c
v
dT is reflected in
an increase in internal energy and pd
RdT is
expended doing work on the overlying air. Because
the Earth’s atmosphere is made up mainly of the
diatomic gases N
2
and O
2
, the energy added by the
heating dq is partitioned between the increase in
internal energy du and the expansion work pd
in
the ratio 5:2.
We can write a more general expression that is
applicable to a moving air parcel, the pressure of
which changes as it rises or sinks relative to the sur-
rounding air. By combining (3.20), (3.48), and (3.50)
we obtain
(3.51)
Hence, if the material is a parcel of air with a fixed
mass that is moving about in an hydrostatic atmos-
phere, the quantity (h ), which is called the dry
static energy, is constant provided the parcel neither
gains nor loses heat (i.e., dq 0).
23
3.4 Adiabatic Processes
If a material undergoes a change in its physical state
(e.g., its pressure, volume, or temperature) without
any heat being added to it or withdrawn from it, the
change is said to be adiabatic.
Suppose that the initial state of a material is repre-
sented by the point A on the p–V diagram in Fig. 3.5
and that when the material undergoes an isothermal
transformation it moves along the line AB. If the same
material underwent a similar change in volume but
under adiabatic conditions, the transformation would
dq d(h ) d(c
p
T )
dq dh c
p
dT
23
Strictly speaking, Eq. (3.51) holds only for an atmosphere in which there are no fluid motions. However, it is correct to within a few
percent for the Earth’s atmosphere where the kinetic energy of fluid motions represents only a very small fraction of the total energy.
An exact relationship can be obtained by using Newton’s second law of motion and the continuity equation in place of Eq. (3.20) in the
derivation. See J. R. Holton, An Introduction to Dynamic Meteorology, 4th ed.,Academic Press, pp. 46–49 (2004).
P732951-Ch03.qxd 9/12/05 7:41 PM Page 76
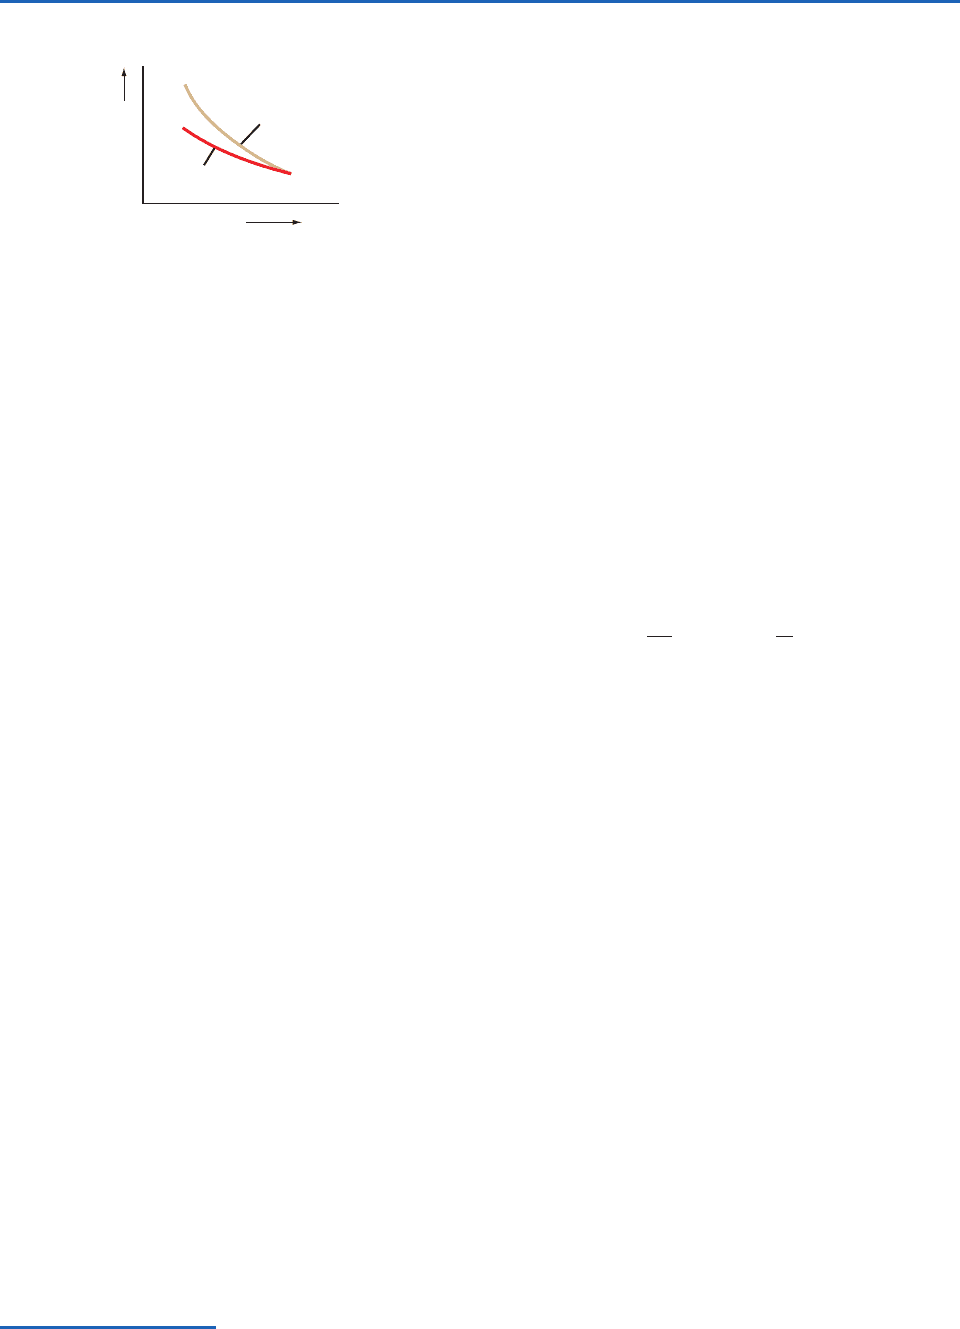
3.4 Adiabatic Processes 77
be represented by a curve such as AC, which is called
an adiabat. The reason why the adiabat AC is steeper
than the isotherm AB on a p–V diagram can be seen
as follows. During adiabatic compression, the internal
energy increases [because dq 0 and pd
is negative
in (3.38)] and therefore the temperature of the system
rises. However, for isothermal compression, the tem-
perature remains constant. Hence, T
C
T
B
and there-
fore p
C
p
B
.
3.4.1 Concept of an Air Parcel
In many fluid mechanics problems, mixing is viewed
as a result of the random motions of individual mole-
cules. In the atmosphere, molecular mixing is impor-
tant only within a centimeter of the Earth’s surface
and at levels above the turbopause (105 km). At
intermediate levels, virtually all mixing in the vertical
is accomplished by the exchange of macroscale “air
parcels” with horizontal dimensions ranging from
millimeters to the scale of the Earth itself.
To gain some insights into the nature of vertical
mixing in the atmosphere, it is useful to consider the
behavior of an air parcel of infinitesimal dimensions
that is assumed to be
i. thermally insulated from its environment so
that its temperature changes adiabatically as it
rises or sinks, always remaining at exactly the
same pressure as the environmental air at the
same level,
24
which is assumed to be in
hydrostatic equilibrium; and
ii. moving slowly enough that the macroscopic
kinetic energy of the air parcel is a negligible
fraction of its total energy.
Although in the case of real air parcels one or
more of these assumptions is nearly always violated
to some extent, this simple, idealized model is helpful
in understanding some of the physical processes that
influence the distribution of vertical motions and
vertical mixing in the atmosphere.
3.4.2 The Dry Adiabatic Lapse Rate
We will now derive an expression for the rate of
change of temperature with height of a parcel of dry
air that moves about in the Earth’s atmosphere while
always satisfying the conditions listed at the end of
Section 3.4.1. Because the air parcel undergoes only
adiabatic transformations (dq 0) and the atmos-
phere is in hydrostatic equilibrium, for a unit mass of
air in the parcel we have, from (3.51),
(3.52)
Dividing through by dz and making use of (3.20) we
obtain
(3.53)
where
d
is called the dry adiabatic lapse rate. Because
an air parcel expands as it rises in the atmosphere, its
temperature will decrease with height so that
d
defined by (3.53) is a positive quantity. Substituting
9.81 m s
2
and c
p
1004 J K
1
kg
1
into (3.53)
gives
d
0.0098 K m
1
or 9.8 K km
1
, which is the
numerical value of the dry adiabatic lapse rate.
It should be emphasized again that
d
is the rate of
change of temperature following a parcel of dry air
that is being raised or lowered adiabatically in the
atmosphere. The actual lapse rate of temperature in a
column of air, which we will indicate by
T
z,
as measured, for example, by a radiosonde, averages
6–7K km
1
in the troposphere, but it takes on a wide
range of values at individual locations.
3.4.3 Potential Temperature
The potential temperature
of an air parcel is defined
as the temperature that the parcel of air would have
if it were expanded or compressed adiabatically from
its existing pressure and temperature to a standard
pressure p
0
(generally taken as 1000 hPa).
dT
dz
dry parcel
c
p
d
d(c
p
T ) 0
24
Any pressure differences between the parcel and its environment give rise to sound waves that produce an almost instantaneous
adjustment.Temperature differences, however, are eliminated by much slower processes.
Pressure
Volume
Isotherm
Adiabat
C
B
A
Fig. 3.5 An isotherm and an adiabat on a p–V diagram.
P732951-Ch03.qxd 9/12/05 7:41 PM Page 77

78 Atmospheric Thermodynamics
We can derive an expression for the potential tem-
perature of an air parcel in terms of its pressure p,
temperature T, and the standard pressure p
0
as fol-
lows. For an adiabatic transformation (dq 0) (3.46)
becomes
Substituting
from (3.3) into this expression yields
Integrating upward from p
0
(where, by definition,
T
) to p, we obtain
or
Taking the antilog of both sides
or
(3.54)
Equation (3.54) is called Poisson’s
25
equation. It is
usually assumed that and
; therefore,
Parameters that remain constant during certain
transformations are said to be conserved. Potential
temperature is a conserved quantity for an air parcel
that moves around in the atmosphere under adia-
batic conditions (see Exercise 3.36). Potential tem-
perature is an extremely useful parameter in
atmospheric thermodynamics, since atmospheric
processes are often close to adiabatic, and therefore
remains essentially constant, like density in an
incompressible fluid.
R
c
p
0.286.c
p
c
pd
1004 J K
1
kg
1
R R
d
287 J K
1
kg
1
p
0
p
R
c
p
T
c
p
R
p
p
0
c
p
R
ln
T
ln
p
p
0
c
p
R
T
dT
T
p
p
0
dp
p
c
p
R
dT
T
dp
p
0
c
p
dT
dp 0
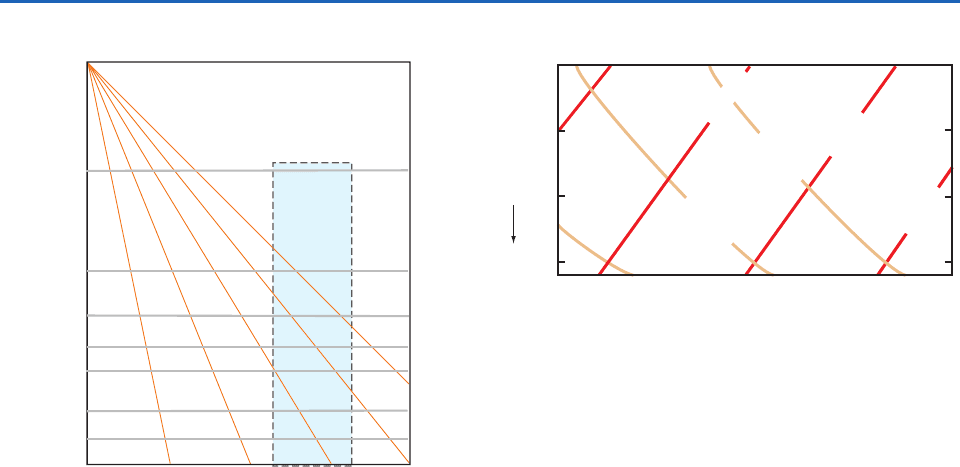
3.4.4 Thermodynamic Diagrams
Poisson’s equation may be conveniently solved in
graphical form. If pressure is plotted on the ordinate
on a distorted scale, in which the distance from the ori-
gin is proportional to , or p
0.286
is used, regardless
of whether air is dry or moist, and temperature (in K)
is plotted on the abscissa, then (3.54) becomes
(3.55)
For a constant value of
, Eq. (3.55) is of the form y
x
where y p
0.286
, x T, and the constant of proportion-
ality is . Each constant value of
represents
a dry adiabat, which is defined by a straight line with a
particular slope that passes through the point p 0,
T 0. If the pressure scale is inverted so that p
increases downward, the relation takes the form shown
in Fig. 3.6, which is the basis for the pseudoadiabatic
chart that used to be widely used for meteorological
computations. The region of the chart of greatest inter-
est in the atmosphere is the portion shown within the
dotted lines in Fig. 3.6, and this is generally the only
portion of the chart that is printed.
In the pseudoadiabatic chart, isotherms are verti-
cal and dry adiabats (constant
) are oriented at an
acute angle relative to isotherms (Fig. 3.6). Because
changes in temperature with height in the atmos-
phere generally lie between isothermal and dry adia-
batic, most temperature soundings lie within a
narrow range of angles when plotted on a pseudo-
adiabatic chart. This restriction is overcome in the
so-called skew T ln p chart, in which the ordinate
(y) is ln p (the minus sign ensures that lower pres-
sure levels are located above higher pressure levels
on the chart) and the abscissa (x) is
(3.56)
Since, from (3.56),
and for an isotherm T is constant, the relation-
ship between y and x for an isotherm is of the form
y
x T
(constant)
x T (constant)y T (constant) ln p
p
0.286
0
p
0.286
p
0.286
0
T
p
R
d
c
p
25
Simeon Denis Poisson (1781–1840) French mathematician. Studied medicine but turned to applied mathematics and became the
first professor of mechanics at the Sorbonne in Paris.
P732951-Ch03.qxd 9/12/05 7:41 PM Page 78
3.5 Water Vapor in Air 79
y mx c, where m is the same for all isotherms
and c is a different constant for each isotherm.
Therefore, on the skew T ln p chart, isotherms are
straight parallel lines that slope upward from left
to right. The scale for the x axis is generally chosen
to make the angle between the isotherms and the
isobars about 45°, as depicted schematically in
Fig. 3.7. Note that the isotherms on a skew T ln p
chart are intentionally “skewed” by about 45° from
their vertical orientation in the pseudoadiabatic
chart (hence the name skew T ln p chart). From
(3.55), the equation for a dry adiabat (
constant) is
Hence, on a ln p versus ln T chart, dry adiabats
would be straight lines. Since ln p is the ordinate on
the skew T ln p chart, but the abscissa is not ln T,
dry adiabats on this chart are slightly curved lines
that run from the lower right to the upper left. The
angle between the isotherms and the dry adiabats on
a skew T ln p chart is approximately 90° (Fig. 3.7).
Therefore, when atmospheric temperature soundings
are plotted on this chart, small differences in slope
ln
p (constant) lnT constant
are more apparent than they are on the pseudoadia-
batic chart.
Exercise 3.5 A parcel of air has a temperature of
51 °C at the 250-hPa level. What is its potential
temperature? What temperature will the parcel
have if it is brought into the cabin of a jet aircraft
and compressed adiabatically to a cabin pressure of
850 hPa?
Solution: This exercise can be solved using the skew
T ln p chart. Locate the original state of the air
parcel on the chart at pressure 250 hPa and temper-
ature 51 °C. The label on the dry adiabat that
passes through this point is 60 °C, which is therefore
the potential temperature of the air.
The temperature acquired by the ambient air if it
is compressed adiabatically to a pressure of 850 hPa
can be found from the chart by following the dry adi-
abat that passes through the point located by 250 hPa
and 51 °C down to a pressure of 850 hPa and read-
ing off the temperature at that point. It is 44.5 °C.
(Note that this suggests that ambient air brought into
the cabin of a jet aircraft at cruise altitude has to
be cooled by about 20 °C to provide a comfortable
environment.) ■
3.5 Water Vapor in Air
So far we have indicated the presence of water
vapor in the air through the vapor pressure e that
it exerts, and we have quantified its effect on the
density of air by introducing the concept of virtual
temperature. However, the amount of water vapor
present in a certain quantity of air may be expressed
in many different ways, some of the more important
Pressure p (hPa)
Temperature T (K)
θ
= 100 K
θ
= 200 K
θ
= 300 K
θ
= 400 K
θ
= 500 K
10
100
200
300
400
600
800
1000
4003002001000
0
Fig. 3.6 The complete pseudoadiabatic chart. Note that
p increases downward and is plotted on a distorted scale
(representing p
0.286
). Only the blue-shaded area is generally
printed for use in meteorological computations. The sloping
lines, each labeled with a value of the potential temperature
,
are dry adiabats. As required by the definition of
, the actual
temperature of the air (given on the abscissa) at 1000 hPa is
equal to its potential temperature.
Pressure (hPa)
Isotherm
T
=
0
°C
T
=
20
°C
Dry Adiabat
θ
=
293 K
θ
=
273 K
θ
=
253 K
400
600
800
1000
T
=
–20
°C
Fig. 3.7 Schematic of a portion of the skew T ln p chart.
(An accurate reproduction of a larger portion of the chart is
available on the book web site that accompanies this book,
from which it can be printed and used for solving exercises.)
p
P732951-Ch03.qxd 9/12/05 7:41 PM Page 79

80 Atmospheric Thermodynamics
of which are presented later. We must also discuss
what happens when water vapor condenses in air.
3.5.1 Moisture Parameters
a. Mixing ratio and specific humidity
The amount of water vapor in a certain volume of air
may be defined as the ratio of the mass m
v
of water
vapor to the mass of dry air; this is called the mixing
ratio w.That is
(3.57)
The mixing ratio is usually expressed in grams of water
vapor per kilogram of dry air (but in solving numerical
exercises w must be expressed as a dimensionless num-
ber, e.g., as kg of water vapor per kg of dry air). In the
atmosphere, the magnitude of w typically ranges from
a few grams per kilogram in middle latitudes to values
of around 20 g kg
1
in the tropics. If neither condensa-
tion nor evaporation takes place, the mixing ratio of an
air parcel is constant (i.e., it is a conserved quantity).
The mass of water vapor m
v
in a unit mass of air
(dry air plus water vapor) is called the specific
humidity q, that is
Because the magnitude of w is only a few percent, it
follows that the numerical values of w and q are
nearly equivalent.
Exercise 3.6 If air contains water vapor with a mix-
ing ratio of 5.5 g kg
1
and the total pressure is 1026.8
hPa, calculate the vapor pressure e.
Solution: The partial pressure exerted by any con-
stituent in a mixture of gases is proportional to the
number of moles of the constituent in the mixture.
Therefore, the pressure e due to water vapor in air is
given by
(3.58)
n
v
and n
d
are the number of moles of water vapor
and dry air in the mixture, respectively, M
w
is the
molecular weight of water, M
d
is the apparent molec-
e
n
v
n
d
n
v
p
m
v
M
w
m
d
M
d
m
v
M
w
p
q
m
v
m
v
m
d
w
1 w
w
m
v
m
d
ular weight of dry air, and p is the total pressure of
the moist air. From (3.57) and (3.58) we obtain
(3.59)
where 0.622 is defined by (3.14). Substituting
p 1026.8 hPa and w 5.5 10
3
kg kg
1
into
(3.59), we obtain e 9.0 hPa. ■
Exercise 3.7 Calculate the virtual temperature
correction for moist air at 30 °C that has a mixing
ratio of 20 g kg
1
.
Solution: Substituting ep from (3.59) into (3.16)
and simplifying
Dividing the denominator into the numerator in this
expression and neglecting terms in w
2
and higher
orders of w, we obtain
or, substituting 0.622 and rearranging,
(3.60)
With T 303 K and w 20 10
3
kg kg
1
,
Eq. (3.60) gives T
v
306.7 K. Therefore, the virtual
temperature correction is T
v
T 3.7 degrees (K or
°C). Note that (3.60) is a useful expression for obtain-
ing T
v
from T and the moisture parameter w. ■
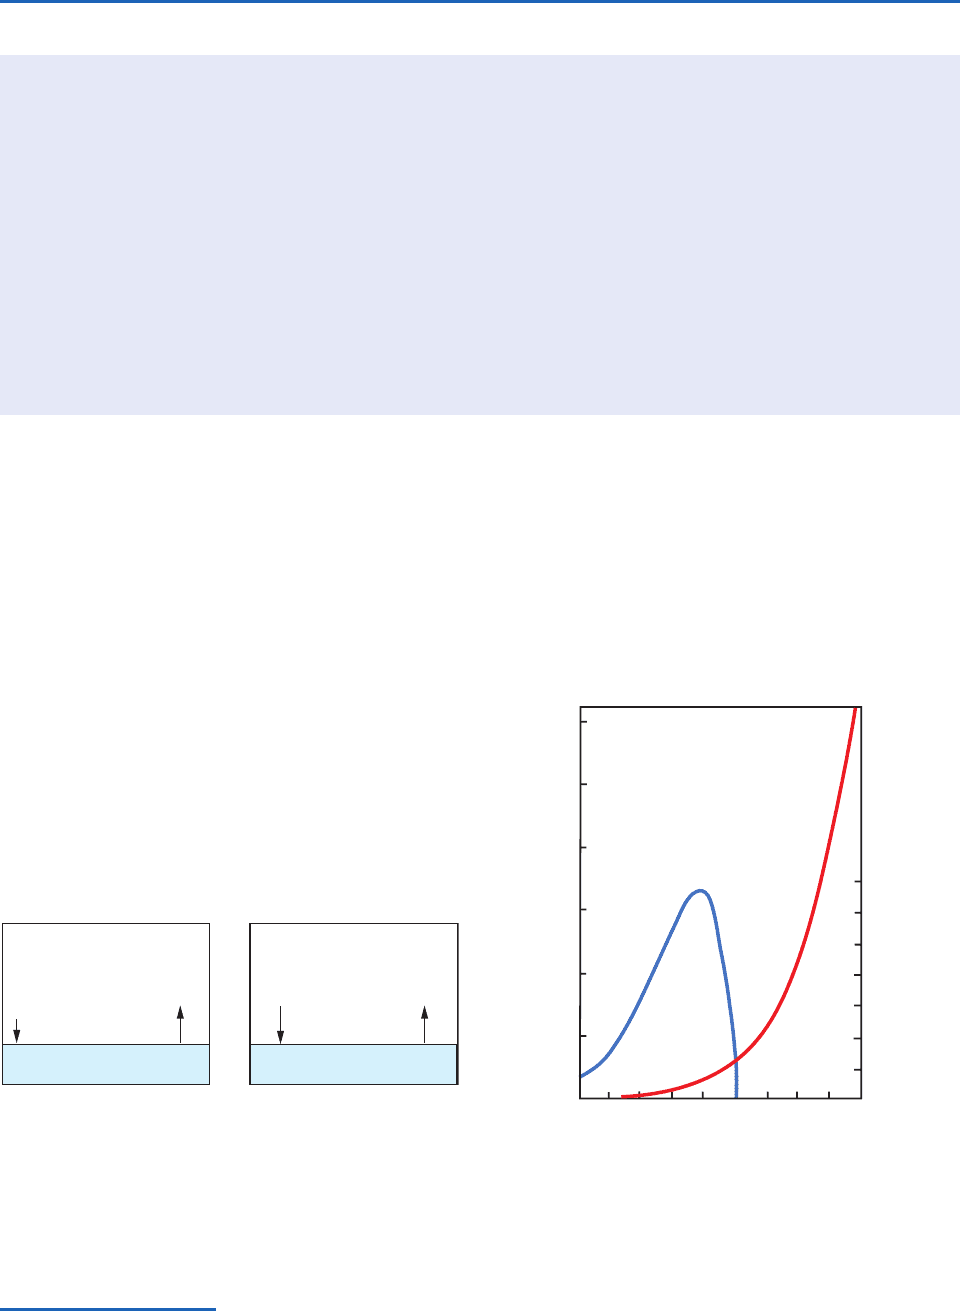
b. Saturation vapor pressures
Consider a small closed box, the floor of which is cov-
ered with pure water at temperature T. Initially
assume that the air is completely dry. Water will begin
to evaporate and, as it does, the number of water mol-
ecules in the box, and therefore the water vapor pres-
sure, will increase. As the water vapor pressure
increases, so will the rate at which the water mole-
cules condense from the vapor phase back to the liq-
uid phase. If the rate of condensation is less than the
rate of evaporation, the box is said to be unsaturated
at temperature T (Fig. 3.8a). When the water vapor
pressure in the box increases to the point that the rate
of condensation is equal to the rate of evaporation
(Fig. 3.8b), the air is said to be saturated with respect
T
v
T(1 0.61w)
T
v
T
1
wT
T
v
T
w
(1 w)
e
w
w
p
P732951-Ch03.qxd 9/12/05 7:41 PM Page 80
3.5 Water Vapor in Air 81
(a) Unsaturated
(b) Saturated
Water
·
·
·
·
·
·
·
·
·
·
·
·
·
·
·
·
·
·
·
·
·
·
·
·
·
·
·
·
·
·
·
·
T, e
T, e
s
·
·
·
Water
Fig. 3.8 A box (a) unsaturated and (b) saturated with respect
to a plane surface of pure water at temperature T. Dots repre-
sent water molecules. Lengths of the arrows represent the
relative rates of evaporation and condensation. The saturated
(i.e., equilibrium) vapor pressure over a plane surface of pure
water at temperature T is e
s
as indicated in (b).
26
For further discussion of this and some other common misconceptions related to meteorology see C. F. Bohren’s Clouds in a Glass of
Beer,Wiley and Sons, New York, 1987.
27
As a rough rule of thumb, it is useful to bear in mind that the saturation vapor pressure roughly doubles for a 10 °C increase in
temperature.
to a plane surface of pure water at temperature T, and
the pressure e
s
that is then exerted by the water vapor
is called the saturation vapor pressure over a plane
surface of pure water at temperature T.
Similarly, if the water in Fig. 3.8 were replaced by a
plane surface of pure ice at temperature T and the
rate of condensation of water vapor were equal to
the rate of evaporation of the ice, the pressure e
si
exerted by the water vapor would be the saturation
vapor pressure over a plane surface of pure ice at T.
Because, at any given temperature, the rate of evapo-
ration from ice is less than from water, e
s
(T) e
si
(T).
The rate at which water molecules evaporate
from either water or ice increases with increasing
temperature.
27
Consequently, both e
s
and e
si
increase
with increasing temperature, and their magnitudes
depend only on temperature. The variations with
temperature of e
s
and e
s
e
si
are shown in Fig. 3.9,
where it can be seen that the magnitude of e
s
e
si
reaches a peak value at about 12 °C. It follows
that if an ice particle is in water-saturated air it will
grow due to the deposition of water vapor upon it.
In Section 6.5.3 it is shown that this phenomenon
It is common to use phrases such as “the air is sat-
urated with water vapor,”“the air can hold no
more water vapor,” and “warm air can hold more
water vapor than cold air.” These phrases, which
suggest that air absorbs water vapor, rather like a
sponge, are misleading. We have seen that the
total pressure exerted by a mixture of gases is
equal to the sum of the pressures that each gas
would exert if it alone occupied the total volume
of the mixture of gases (Dalton’s law of partial
pressures). Hence, the exchange of water mole-
cules between its liquid and vapor phases is
(essentially) independent of the presence of air.
Strictly speaking, the pressure exerted by water
vapor that is in equilibrium with water at a given
temperature is referred more appropriately to as
equilibrium vapor pressure rather than saturation
vapor pressure at that temperature. However, the
latter term, and the terms “unsaturated air” and
“saturated air,” provide a convenient shorthand
and are so deeply rooted that they will appear in
this book.
3.3 Can Air Be Saturated with Water Vapor?
26
Temperature (°C)
e
s
–e
si
e
s
e
s
– e
si
(hPa)
0.28
0.24
0.20
0.16
0.12
0.08
0.04
0
60
50
40
30
20
10
0
Saturation vapor pressure e
s
over pure water (hPa)
–50
403020
100
–10
–20
–30–40
Fig. 3.9 Variations with temperature of the saturation (i.e.,
equilibrium) vapor pressure e
s
over a plane surface of pure
water (red line, scale at left) and the difference between e
s
and the saturation vapor pressure over a plane surface of ice
e
si
(blue line, scale at right).
P732951-Ch03.qxd 9/12/05 7:41 PM Page 81

82 Atmospheric Thermodynamics
plays a role in the initial growth of precipitable
particles in some clouds.
c. Saturation mixing ratios
The saturation mixing ratio w
s
with respect to water
is defined as the ratio of the mass m
vs
of water vapor
in a given volume of air that is saturated with respect
to a plane surface of pure water to the mass m
d
of
the dry air.That is
(3.61)
Because water vapor and dry air both obey the ideal
gas equation
(3.62)
where
vs
is the partial density of water vapor
required to saturate air with respect to water at
temperature T,
d
is the partial density of the dry
air (see Section 3.1.1), and p is the total pressure.
Combining (3.62) with (3.14), we obtain
For the range of temperatures observed in the
Earth’s atmosphere, p e
s
; therefore
(3.63)
Hence, at a given temperature, the saturation mixing
ratio is inversely proportional to the total pressure.
Because e
s
depends only on temperature, it follows
from (3.63) that w
s
is a function of temperature and
pressure. Lines of constant saturation mixing ratio are
printed as dashed green lines on the skew T ln p
chart and are labeled with the value of w
s
in grams of
water vapor per kilogram of dry air. It is apparent from
the slope of these lines that at constant pressure w
s
increases with increasing temperature, and at constant
temperature w
s
increases with decreasing pressure.
d. Relative humidity; dew point and frost point
The relative humidity (RH) with respect to water is
the ratio (expressed as a percentage) of the actual
w
s
0.622
e
s
p
w
s
0.622
e
s
p e
s
w
s
vs
d
e
s
(R
v
T)
(p e
s
)
(R
d
T)
w
s
m
vs
m
d
mixing ratio w of the air to the saturation mixing
ratio w
s
with respect to a plane surface of pure water
at the same temperature and pressure.That is
(3.64)
The dew point T
d
is the temperature to which air
must be cooled at constant pressure for it to become
saturated with respect to a plane surface of pure
water. In other words, the dew point is the tempera-
ture at which the saturation mixing ratio w
s
with
respect to liquid water becomes equal to the actual
mixing ratio w. It follows that the relative humidity
at temperature T and pressure p is given by
(3.65)
A simple rule of thumb for converting RH to a
dew point depression (T T
d
) for moist air (RH
50%) is that T
d
decreases by 1 °C for every 5%
decrease in RH (starting at T
d
dry bulb tempera-
ture (T), where RH 100%). For example, if the RH
is 85%, and the dew point
depression is T T
d
3 °C.
The frost point is defined as the temperature to
which air must be cooled at constant pressure to sat-
urate it with respect to a plane surface of pure ice.
Saturation mixing ratios and relative humidities with
respect to ice may be defined in analogous ways to
their definitions with respect to liquid water. When
the terms mixing ratio and relative humidity are used
without qualification they are with respect to liquid
water.
Exercise 3.8 Air at 1000 hPa and 18 °C has a mix-
ing ratio of 6 g kg
1
. What are the relative humidity
and dew point of the air?
Solution: This exercise may be solved using a skew
T ln p chart. The students should duplicate the
following steps. First locate the point with pressure
1000 hPa and temperature 18 °C. We see from the
chart that the saturation mixing ratio for this state is
13 g kg
1
. Since the air specified in the problem
has a mixing ratio of only 6 g kg
1
, it is unsaturated
and its relative humidity is, from (3.64), 100 613
46%. To find the dew point we move from right to
T
d
T
100 85
5
RH 100
w
s
(at temperature T
d
and pressure p)
w
s
(at temperature T and pressure p)
RH
100
w
w
s
100
e
e
s
P732951-Ch03.qxd 9/12/05 7:41 PM Page 82
3.5 Water Vapor in Air 83
left along the 1000-hPa ordinate until we intercept
the saturation mixing ratio line of magnitude
6gkg
1
; this occurs at a temperature of about 6.5 °C.
Therefore, if the air is cooled at constant pressure,
the water vapor it contains will just saturate the air
with respect to water at a temperature of 6.5 °C.
Therefore, by definition, the dew point of the air
is 6.5 °C. ■
At the Earth’s surface, the pressure typically varies
by only a few percent from place to place and from
time to time. Therefore, the dew point is a good indi-
cator of the moisture content of the air. In warm,
humid weather the dew point is also a convenient
indicator of the level of human discomfort. For
example, most people begin to feel uncomfortable
when the dew point rises above 20 °C, and air with a
dew point above about 22 °C is generally regarded as
extremely humid or “sticky.” Fortunately, dew points
much above this temperature are rarely observed
even in the tropics. In contrast to the dew point, rela-
tive humidity depends as much upon the tempera-
ture of the air as upon its moisture content. On a
sunny day the relative humidity may drop by as
much as 50% from morning to afternoon, just
because of a rise in air temperature. Neither is rela-
tive humidity a good indicator of the level of human
discomfort. For example, a relative humidity of 70%
may feel quite comfortable at a temperature of 20 °C,
but it would cause considerable discomfort to most
people at a temperature of 30 °C.
The highest dew points occur over warm bodies of
water or vegetated surfaces from which water is evap-
orating. In the absence of vertical mixing, the air just
above these surfaces would become saturated with
water vapor, at which point the dew point would be
the same as the temperature of the underlying surface.
Complete saturation is rarely achieved over hot sur-
faces, but dew points in excess of 25 °C are sometimes
observed over the warmest regions of the oceans.
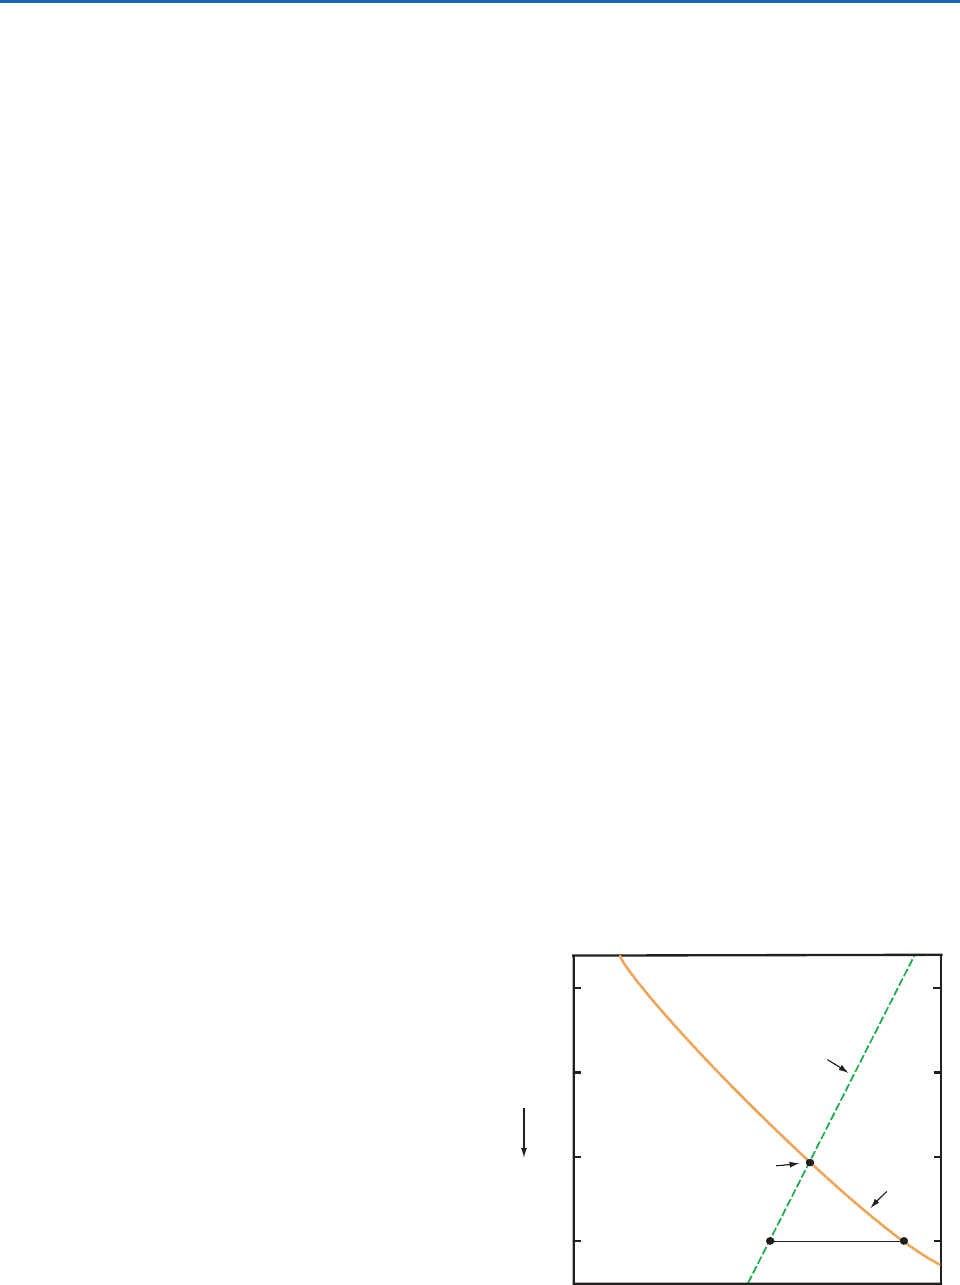
e. Lifting condensation level
The lifting condensation level (LCL) is defined as the
level to which an unsaturated (but moist) parcel of
air can be lifted adiabatically before it becomes satu-
rated with respect to a plane surface of pure water.
During lifting the mixing ratio w and potential tem-
perature
of the air parcel remain constant, but the
saturation mixing ratio w
s
decreases until it becomes
equal to w at the LCL. Therefore, the LCL is located
at the intersection of the potential temperature line
passing through the temperature T and pressure p of
the air parcel, and the w
s
line that passes through the
pressure p and dew point T
d
of the parcel (Fig. 3.10).
Since the dew point and LCL are related in the man-
ner indicated in Fig. 3.10, knowledge of either one is
sufficient to determine the other. Similarly, a knowl-
edge of T, p, and any one moisture parameter is suffi-
cient to determine all the other moisture parameters
we have defined.
f. Wet-bulb temperature
The wet-bulb temperature is measured with a ther-
mometer, the glass bulb of which is covered with a
moist cloth over which ambient air is drawn. The
heat required to evaporate water from the moist
cloth to saturate the ambient air is supplied by the
air as it comes into contact with the cloth. When the
difference between the temperatures of the bulb and
the ambient air is steady and sufficient to supply the
heat needed to evaporate the water, the thermome-
ter will read a steady temperature, which is called the
wet-bulb temperature. If a raindrop falls through a
layer of air that has a constant wet-bulb temperature,
the raindrop will eventually reach a temperature
equal to the wet-bulb temperature of the air.
The definition of wet-bulb temperature and dew
point both involve cooling a hypothetical air parcel
to saturation, but there is a distinct difference. If
the unsaturated air approaching the wet bulb has a
mixing ratio w, the dew point T
d
is the temperature
to which the air must be cooled at constant pressure
C
(p, T
d
, w
s
(A))
A
θ constant
w
s
constant
(p, T, w)
B
Pressure (hPa)
Lifting condensation
level for air at A
1000
800
600
400
Fig. 3.10 The lifting condensation level of a parcel of air at
A, with pressure p, temperature T, and dew point T
d
, is at C
on the skew T ln p chart.
P732951-Ch03.qxd 9/12/05 7:41 PM Page 83