Voit J. The Statistical Mechanics of Financial Markets
Подождите немного. Документ загружается.

4.5 Option Pricing 89
For a variety of reasons which are the principal motivation of the re-
mainder of this book, the traded prices of options usually differ from their
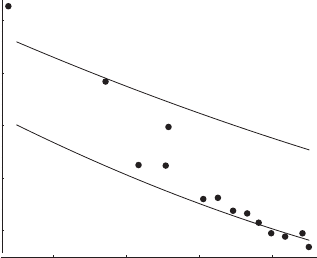
Black–Scholes prices. This is shown in Fig. 4.12 for a series of European calls
on the DAX with a lifetime of one month to maturity. The horizontal axis
“moneyness”, m = X/S, represents the dimensionless ratio of strike price
over underlying. For comparison, the Black–Scholes solution is also displayed
as solid lines. The upper line uses a volatility of 35%y
−1/2
, while the lower
one takes 20%y
−1/2
. Under the assumptions of the Black–Scholes theory and
geometric Brownian motion, a single value of the volatility should be suffi-
cient to describe the entire series of call options, and the prices should fall on
one of the solid lines. Figure 4.12 rejects this hypothesis for real-world option
markets.
In the absence of an accurate ab initio estimation of the volatility, a rough
and pragmatic procedure consists in taking the traded prices for granted and
invert the Black–Scholes equation (4.85) for the implied volatility σ
imp
[10]
C
market
(S, t; r, σ; X, T ) ≡ C
BS
(S, t; r, σ
imp
; X, T) . (4.119)
The idea is to pack all factors leading to deviations from Black–Scholes theory,
independently of their origin, into the single parameter σ
imp
. Volatility, any-
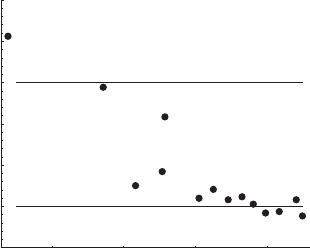
way, is difficult to estimate a priori. For the series of options used in Fig. 4.12,
the implied volatilites are shown in Fig. 4.13. Apparently, there are devia-
tions of traded option prices from a Black–Scholes equation which depend
on the contract to be priced. In this representation, they turn into an im-
plied volatility which explicitly depends on the moneyness of the options. In a
purist perspective, implied volatility adds nothing new to the theory of option
0.98 0.99 1 1.01
moneyness
0.02
0.03
0.04
0.05
0.06
call price
Fig. 4.12. Prices of a series of European call options on the DAX index with
one month to maturity, given in units of the index value, against moneyness X/S
(dots). The two solid lines represent the dependence of the Black–Scholes solutions
on moneyness with two volatilities σ = 35%y
−1/2
(top) and σ = 20%y
−1/2
(bottom)
90 4. Black–Scholes Theory of Option Prices
0.98 0.99 1 1.01
moneyness
0.15
0.2
0.25
0.3
0.35
0.4
0.45
implied volatility
Fig. 4.13. Implied volatilities of a series of European call options on the DAX index
with one month to maturity, against moneyness X/S (dots)in%y
−1/2
. Geometric
Brownian motion and the Black–Scholes theory take volatility independent of the
option contract to be priced. The two solid lines mark the contract-independent
volatilities used to generate the solid lines in Fig. 4.12
pricing, and might even lead to confusion. However, it is a simple transforma-
tion of option prices and therefore is an observable on equal footing with the
prices. This is similar to physics: When temperature is measured, the basic
observable most often is an electric current or voltage drop, or height of a
mercury column, etc., which then is transformed into a temperature reading
with a suitable calibration. Also, implied volatility is the standard language
of derivatives traders and analysts to describe option markets.
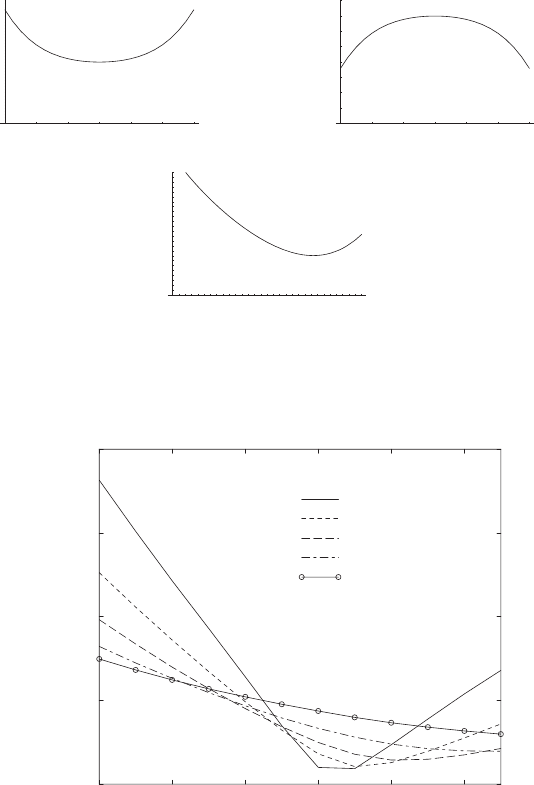
The generic shapes of implied volatilities against moneyness are shown in
Fig. 4.14. Apparently, a pure smile was characteristic of the US option mar-
kets before the 1987 october crash [53]. Ever since, it has become a rather
smirky structure. The aim of market models more sophisticated than geomet-
ric Brownian motion and of option pricing theories beyond Black–Merton–
Scholes, can be restated as to correctly describe implied volatility smiles.
When a series of options with the same strike price but different maturities
is analyzed, a term structure (maturity dependence) of the implied volatility
is obtained in complete analogy to its moneyness dependence. The volatility
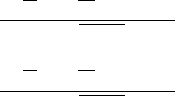
smile turns into a two-dimensional implied volatility surface. Figure 4.15
shows a series of cuts through an implied volatility surface of European call
options. Unlike Fig. 4.13, these curves do not represent market observations
but are the results of a model calculation. Superficially, the one-month curve
is not dissimilar to the empirical data, suggesting that theoretical models
indeed may be capable of correctly describing option markets. Attempts to fit
volatility smiles for a fixed time to maturity usally employ quadratic functions
with different parameters for in- and out-of-the-money options, to account
for the systematic asymmetry [53].
4.5 Option Pricing 91
0.7 0.8 0.9 1 1.1 1.2 1.3
moneyness
0.05
0.1
0.15
0.2
0.25
0.3
0.35
0.4
implied volatility
0.7 0.8 0.9 1 1.1 1.2 1.3
moneyness
0.05
0.1
0.15
0.2
0.25
0.3
0.35
0.4
implied volatility
0.7 0.8 0.9 1 1.1 1.2 1.3
moneyness
0.1
0.2
0.3
0.4
0.5
implied volatility
Fig. 4.14. Sketches of implied volatilities against moneyness. Three generic shapes
can be observed: a smile (top left), a frown (top right) and a smirk resp. skewed
smile (bottom). In equity markets, the smirk is observed most frequently. Often,
the term “volatility smile” includes all three shapes
0.7 0.8 0.9 1.0 1.1 1.2
moneyness
0.6
0.4
0.5
0.3
0.2
implied volatility
1 month
3 months
6 months
1 year
2 years
Time to maturity
Fig. 4.15. Term structure and moneyness dependence of the implied volatility of
a series of European call options based on a model calculation
With reference to the subsequent chapters where we will develop an in-
depth description of financial markets, the main handles on the volatility
smiles and term structures are:
• The ordinate scale is determined by the average volatility of the mar-
ket/model.
92 4. Black–Scholes Theory of Option Prices
• Smiles or frowns are the consequence deviations of the actual return distri-
butions, especially in their wings, from the Gaussian assumed in geometric
Brownian motion.
• The skew in the implied volatility is the consequence either of a skewness
(asymmetry) of the return distribution of the underlying or of return–
volatility correlations.
• The term structure of the volatility smiles is determined by the time scales
(or time-scale-free behavior) of the important variables in the problem.
Figures 4.12 and 4.13 show the option prices and implied volatilites of
DAX options on one particular trading day. Both quantities show an inter-
esting dynamics when studied with time resolution. The price of a specific
option, of course, possesses a dynamics because of the variation in the price of
the underlying. When the prices of a series of options are represented in terms
of moneyness, however, these variations are along the price curve C(X/S)
once the effects of changing time to maturity are eliminated, and should not
lead to dynamical variations of the price curve itself. Additional dynamics
may come, e.g., from the increasing autonomy of option markets which are in-
creasingly driven by demand and supply, in addition to the price movements
of the underlying [54]. One can analyze this dynamics of σ
imp
(m) almost at
the money, m ≈ 1. When, e.g., the time series of σ
imp
(1 − δ) − σ
imp
(1) and
σ
imp
(1) − σ
imp
(1 + δ) are plotted against time, there are long periods where
both stochastic time series are strongly correlated, and other shorter periods
where their correlation is weak [53]. The former correspond to almost rigid
shifts of the smile patterns while the latter appear in periods where the smile
predominantly changes shape. Both time series can be modeled as AR(1)
processes which describes an implied volatility with a mean-reversion time of
about 30 days, comparable to the time to maturity of liquid options.
This line of research can be carried much further by studying the dynami-
cal properties of a two-dimensional implied volatility surface with coordinates
moneyness (m) and time to maturity (T − t) [54]. Implied volatilities are
strongly correlated across moneyness and time to maturity, cf. above, which
suggests a description in terms of surface dynamics. A practical aspect are
trading rules for volatility prediction based on implied volatility. The “sticky
moneyness” rule predicts that the implied volatility surface tomorrow is the
same as that today at constant moneyness and time to maturity. The “sticky
strike” rule stipulates that the implied volatility tomorrow is the same as
today at constant strike and constant maturity (i.e. absolute quantities).
Volatility surfaces can be generated for various series of liquid options
such as calls and puts on the S&P500, the FTSE, or the DAX. With a
generalization of principal component analysis – a technique widely used in
image processing – the implied volatility surfaces can be described as fluc-
tuating random surfaces driven by a small number of dominant eigenmodes.
These eigenmodes parameterize the shape fluctuations of the surface. Their
fluctuating prefactors describe the amplitude of surface variations. The first
4.5 Option Pricing 93
eigenmode which accounts for about 80% of the daily variance of the implied
volatility surface is a flat sheet in σ
imp
−m −(T −t) space, almost indepen-
dent of T − t and with a small positive slope in m. This mode essentially
has the same properties as the time series discussed in the second preceding
paragraph. It is also negatively correlated with the price of the underlyings,
i.e. contributes to a “leverage effect” to be discussed in Sect. 5.6.3. The sec-
ond eigenmode changes sign at the money and is positive for m>1and
negative for m<1. A positive variation of this mode increases the volatili-
ties of out-of-the money calls and descreases it for out-of-the-money puts. It
contributes to the skewness of the risk-neutral distributions (when thinking
backwards from implied volatility to risk-neutral measures) and, due to its
slope in T − t, to the term structure. It also possesses the dynamics of a
mean-reverting AR(1)-process. The third mode is a butterfly modes which
changes the convexity of the implied volatility surface. It leads to a fattening
of the tails of the risk-neutral distributions, cf. the mechanistic rules listed
above [54].
This dynamics can be cast in a low-dimensional factor model
X(t; m, T −t) ≡ ln σ
imp
(t; m, T −t)=X(0; m, T −t)+
d
k=1
x
k
(t)f
k
(m, T −t) .
(4.120)
f
k
is one of the d dominant eigenfunctions of the principal component decom-
position. They are time-independent and describe the spatial variation of the
fluctuations. The dynamics comes from the randomly fluctuating prefactors
x
k
(t) which, according to the findings above, can be modeled as Ornstein-
Uhlenbeck processes
dx
k
(t)=−λ
k
[x
k
(t) − ¯x
k
]dt + γ
k
dz
k
. (4.121)
λ
k
is the rate of mean reversion and ¯x
k
is the average of the k
th
eigenmode.
The stochastic increments dz
k
are uncorrelated and may be drawn from a
Gaussian (consistent with the lognormal distribution of implied volatilites, cf.
below) or a more general distribution. The ranks of the fluctuating expansion
coefficients x
k
(t) in (4.120) are ordered according to their variances γ
2
k
which
measures the amplitude of the fluctuations they impart on σ
imp
(t; m, T −
t). The dynamics of the implied volatility surfaces analyzed above can be
faithfully represented by three factors x
1
(t) ...x
3
(t) [54].
4.5.8 Volatility Indices
Volatility is the most important and least accessible quantity in option the-
ory. Volatility can be inferred either from historical time series [estimate
σ in (4.53)] or from implied volatility of options by inverting the Black–
Scholes equation as in (4.119). For derivative markets, the second method
is preferrable because the information is derived directly from derivative
94 4. Black–Scholes Theory of Option Prices
instruments, and implied volatility is more forward-looking than historical
volatility.
Derivative trading requires high-frequency information on volatility, resp.
implied volatility. The question arises if information on implied volatility can
be provided in a standardized manner to assist traders in their decisions.
Volatility indices have been constructed by various option exchanges to fill
this gap. As volatility often signifies financial turmoil, volatility indices play
the role of “investor fear gauges”. In the following, we discuss two two indices
using different construction principles.
VDAX Index
The VDAX index is provided by Deutsche B¨orse AG, and measures the im-
plied volatility of at-the-money options on the DAX with 45 days to maturity
[55]. Options on the DAX are among the most liquid instruments in the Eu-
ropean derivatives markets. Although it is not directly relevant for other
options, the knowledge of the VDAX value gives a good indication of the
volatilities traded in the broader derivatives market.
Conceptually, the VDAX is based on implied volatilities, i.e. the Black–
Scholes equation (4.85), resp. (4.86), is inverted numerically as formally done
in (4.119). The practical calculation is more difficult, though, most impor-
tantly because, except for accidental circumstances, no option at the money
with 45 days to maturity is traded in the markets.
Moreover, in practice, the traded futures price on the DAX are used for
the VDAX calculation instead of the DAX itself. For options on futures, the
Black–Scholes equation can be rewritten most easily by equating forward and
futures prices F and using (4.1) in (4.85) and (4.86) to obtain
C
F
=e
−r(T −t)
[FN(d
1F
) − XN(d
2F
)] (4.122)
P
F
=e
−r(T −t)
[XN(−d
2F
) − FN(−d
1F
)] (4.123)
for the prices of call and put options on futures, respectively. d
1F
and d
2F
differ from (4.88) and (4.89) and are given by
d
1F
=
ln
F
X
+
σ
2
2
(T − t)
σ
√
T − t
, (4.124)
d
2F
=
ln
F
X
−
σ
2
2
(T − t)
σ
√
T − t
. (4.125)
The risk-free interest rate no longer appears explicitly in (4.124) and (4.125)
and is implicitly accounted for by the use of the futures price F , cf. (4.1).
The Black–Scholes problem for options on futures can also be solved ab initio
following the lines of Sects. 4.5.1 and 4.5.2, with (4.122) and (4.123) as the

4.5 Option Pricing 95
solutions of the modified differential equations [10, 56]. This solution is known
as Black’s 1976 model.
The VDAX is based on a set of eight subindices calculated for DAX op-
tions with maturities of up to two years. Each subindex is based on four
at-the-money options for the given maturity. After data filtering, the best
bid and ask prices of each call and put option and of the DAX futures are
averaged. Next, the risk-free interest rate is not a universal constant but de-
pends on the maturity of the bonds it is taken from. Under normal conditions,
r is lower for short-maturity bonds than for long maturities (“normal interest
rate curve”). Only under exceptional circumstances is the interest rate curve
inverted, i.e. the long maturities bring less interest than the short maturities.
In general, risk-free interest rates are not available for the maturities of the
options considered. In practice, they are generated by linear interpolation
from two values bracketing the option contract maturity.
When the maturity of futures contracts differs from that of options, put-
call parity is used to generate an effective forward price from the option
prices. Using (4.1), (4.8) for put-call parity can be rewritten in terms of the
forward price as
F (t)=[C(t) − P (t)] e
r(T −t)
+ X. (4.126)
This equation is used for up to eight pairs of options for four strike prices
above and below the “at-the-money point”, and averaged at the end. Once
the forward price is available, (4.122) and (4.123) are inverted for the implied
volatility σ
imp
.
The implied volatility constituting a volatility subindex for a specific ma-
turity T
i
is calculated as a weighted average of the implied volatilities a pair
of put and call options with strike prices bracketing the futures price
σ
imp
(T
i
)=
[X
h
− F (T
i
)]
σ
call
imp,l
+ σ
put
imp,l
+[F (T
i
) − X
l
]
σ
call
imp,h
+ σ
put
imp,h
2(X
h
− X
l
)
.
(4.127)
The subscripts h and l label the options with maturity T
i
above and below
the futures price. The eight volatility subindices are published by Deutsche
B¨orse AG as additional information.
The VDAX then is the implied volatility generated from the two subindices
with maturity closest to 45 days, by interpolation of the variances
σ
VDAX
imp
=
T
i+1
− T
T
i+1
− T
i
σ
2
imp
(T
i
)+
T − T
i
T
i+1
− T
i
σ
2
imp
(T
i+1
) , (4.128)
where the maturities satisfy
T
i
≤ T = 45d <T
i+1
. (4.129)
96 4. Black–Scholes Theory of Option Prices
The VDAX is the implied volatility of a hypothetical at-the-money option
with a 45-day maturity. At the time of writing, the VDAX is quoted every
minute from 9 a.m. to 5:30 p.m.
There have been attempts to create derivatives on the VDAX. It is re-
ported that the pricing and hedging of these products encountered many
difficulties. Most likely, it was done in a way similar to that described in the
subsequent text, supplemented by rules of thumb for the inevitable differences
between the VDAX and the quantity effectively priced and hedged.
VIX
The VIX is the volatility index of the Chicago Board Options Exchange
(CBOE) [57]. It measures the volatility of options on the S&P500 index with
30 days to expiration.
Since its introduction in 1993 until 2003, it was based on the implied
volatility of at-the-money options on the S&P100 index, and calculated in
a manner similar to the VDAX described above. In 2003, the method of
calculation was changed, and the index now refers to the S&P500 index. The
change was made in response to advances in quantitative finance which were
driven by the desire to trade volatility derivatives deriving their measure of
volatility directly from a series of option prices [57, 58]. Here, we continue to
call this volatility measure “implied volatility” although this formally is not
justified by (4.119) which we used to define implied volatility. The labeling is
justified, however, (i) when implied volatility is understood as the market’s
expectation of future realized volatility, and (ii) by the strong similarity of the
old VIX based on implied volatility, and the new VIX extended backwards
in time to cover the period of the old VIX [57].
To understand the general problem behind the creation of volatility deriv-
atives, notice that the hedging of a derivative, say on option, based on σ
imp
as obtained by (4.119), is a highly nontrivial task. When volatility can be
represented, e.g., as a linear combination of traded instruments, hedging is
much easier.
How can one create an instrument that allows pure trading of volatility?
With a position in an option, an investor is exposed both to the directional
movements of the underlying and to its volatility. Can one eliminate the
exposure to directional moves?
The simplest derivative instrument on volatility is a volatility, or variance
swap. A swap is a contract which exchanges (“swaps”) two cash flows. Swaps
are most common in the fixed income sector (bonds and credits), and often
the parties exchange the cash flows from fixed interest rate payments against
variable interest rate payments. The payoff of a variance swap at expiration
is
VS(T )=(σ
2
R
− K
var
)N, (4.130)
where σ
2
R
is the variance of the underlying realized over the lifetime of the
swap, K
var
is variance delivery price and N is the notional of the contract. The

4.5 Option Pricing 97
holder of the swap receives N dollars for every point by which the variance
σ
2
R
exceeds the delivery price K
var
[58]. Alternatively, the variance swap may
be understood as a forward contract.
To understand the construction of such a swap, go back to the definition
of the Vega of an option. Vega, as defined in (4.109) measures the sensitivity
to changes in volatility. The variance exposure of a call option is measured
by the “Variance Vega”
V
var
=
∂C
∂σ
2
=
S
√
T − t
2
√
2πσ
exp
−
d
2
1
2
, (4.131)
where the second equality is valid only for Black–Scholes option prices, and
d
1
was given in (4.88). Variance Vega is peaked at S = X with a peak height
proportional to X due to the explicit prefactor S. When many options with
slightly different strikes are superposed with equal weight in a portfolio, the
variance exposure of this portfolio is given by the superposition of the Vari-
ance Vegas. This leads to a triangular shape (in S) with Gaussian roundings
at the edge. When the portfolio weighs the options with a weight factor X
−2
,
on the other hand, the dependence on S drops out, and the portfolio has an
exposure to variance only (provided the price of the underlying remains in
the range covered by the option strikes). This result becomes exact when
the strike price X is treated as a continuous variable, and the portfolio is
expressed as an integral over X with a weight factor X
−2
[58]. In practice,
out-of-the-money options are more liquid. For this reason, both out-of-the-
money call and put options are used in setting up the portfolio
Π
σ
(t)=
S
0
dX
X
2
P (X, t)+
∞
S
dX
X
2
C(X, t) . (4.132)
S
is an arbitrary reference price close to the at-the-money point. This port-
folio’s Delta and Variance Vega are [58]
∆ =
∂Π
σ
(t)
∂S
≡ 0 , V
var
=
∂Π
σ
(t)
∂σ
2
=
T − t
2
. (4.133)
At expiration, the value of the portfolio Π
σ
(T )is
Π
σ
(T )=
S
0
dX
X
2
max [X − S(T ), 0] +
∞
S
dX
X
2
max [S(T ) −X, 0]
=
S(T ) −S
S
− ln
S(T )
S
. (4.134)
The first term in the second equation essentially is an ordinary forward con-
tract with a payoff linear in the deviation from the reference price S
.The
second term is a log-contract whose payoff equals the logarithm of the price
ratio.

98 4. Black–Scholes Theory of Option Prices
As with any other derivative, the fair delivery price of variance K
var
is
fixed by the requirement that the expected present value of the future payoff
in a risk-neutral world is zero. The variance realized over the lifetime of the
swap is
σ
2
R
=
1
T
T
0
dtσ
2
(t) , (4.135)
where σ – unlike geometric Brownian motion – may be a time-dependent,
perhaps even stochastic quantity. The criterion of zero expected value of the
payoff then translates in
F (t)=e
−r(T −t)
σ
2
R
− K
var
=0. (4.136)
When S(t) follows an Itˆo process (4.40) even with a time-dependent
volatility σ(t), we can combine (4.53) and (4.62) to obtain
dS(t)
S(t)
− d[lnS(t)] =
1
2
σ
2
dt. (4.137)
Insert this into (4.135) and solve the second equality in (4.136)
K
var
=
2
T
!
T
0
dS(t)
S(t)
− ln
S(T )
S(0)
"
. (4.138)
For an Itˆo process in a risk-neutral world,
!
T
0
dS(t)
S(t)
"
=
!
T
0
rdt + σ(t)dz
"
= rT . (4.139)
The last term in (4.138) is related to the log-contract in our portfolio of
options with a continuous strike distribution. Combining everything gives
the fair delivery price of the variance swap [58]
K
var
=
2
T
#
e
rT
S
0
dX
X
2
P (X, t)+e
rT
∞
S
dX
X
2
C(X, t)
+ rT −
S(0)e
rT
S
− 1
− ln
S
S(0)
. (4.140)
This derivation does not require geometric Brownian motion, or the validity
of the Black–Scholes assumptions. An instrument trading volatility alone thus
can be constructed based on a weighted portfolio of options with a continuous
strike distribution and weights inversely proportional to X
2
.
Clearly, the value of such an instrument is a measure of the market’s
expected volatility over the lifetime of the contract, and therefore constitutes
a valid volatility index. This is precisely what the CBOE’s VIX does. As with
the instruments acutally traded in the markets, the ideal continuous strike