Voit J. The Statistical Mechanics of Financial Markets
Подождите немного. Документ загружается.

XII Contents
3.4.1 Financial Data . . . . . . . . . . . . . . . . . . . . . . . . . . . . . . . . . . . 44
3.4.2 Perrin’s Observations of Brownian Motion . . . . . . . . . . . 46
3.4.3 One-Dimensional Motion of Electronic Spins . . . . . . . . . 47
4. The Black–Scholes Theory of Option Prices ............... 51
4.1 ImportantQuestions.................................... 51
4.2 AssumptionsandNotation............................... 52
4.2.1 Assumptions..................................... 52
4.2.2 Notation ........................................ 53
4.3 Prices forDerivatives ................................... 53
4.3.1 Forward Price. . . . . . . . . . . . . . . . . . . . . . . . . . . . . . . . . . . . 54
4.3.2 FuturesPrice ................................... 55
4.3.3 Limits on Option Prices . . . . . . . . . . . . . . . . . . . . . . . . . . . 56
4.4 Modeling Fluctuations of Financial Assets . . . . . . . . . . . . . . . . . 58
4.4.1 Stochastic Processes . . . . . . . . . . . . . . . . . . . . . . . . . . . . . 59
4.4.2 The Standard Model of Stock Prices . . . . . . . . . . . . . . . . 67
4.4.3 The Itˆo Lemma .................................. 68
4.4.4 Log-normal Distributions for Stock Prices . . . . . . . . . . . 70
4.5 Option Pricing . . . . . . . . . . . . . . . . . . . . . . . . . . . . . . . . . . . . . . . . . 72
4.5.1 The Black–Scholes Differential Equation . . . . . . . . . . . . . 72
4.5.2 Solution of the Black–Scholes Equation . . . . . . . . . . . . . 75
4.5.3 Risk-NeutralValuation............................ 80
4.5.4 American Options . . . . . . . . . . . . . . . . . . . . . . . . . . . . . . . . 81
4.5.5 TheGreeks...................................... 83
4.5.6 Synthetic Replication of Options . . . . . . . . . . . . . . . . . . . 87
4.5.7 Implied Volatility. . . . . . . . . . . . . . . . . . . . . . . . . . . . . . . . . 88
4.5.8 Volatility Indices . . . . . . . . . . . . . . . . . . . . . . . . . . . . . . . . . 93
5. Scaling in Financial Data and in Physics .................. 101
5.1 ImportantQuestions.................................... 101
5.2 StationarityofFinancial Markets......................... 102
5.3 Geometric Brownian Motion . . . . . . . . . . . . . . . . . . . . . . . . . . . . . 106
5.3.1 Price Histories ................................... 106
5.3.2 Statistical Independence of Price Fluctuations . . . . . . . 106
5.3.3 Statistics of Price Changes of Financial Assets . . . . . . . 111
5.4 Pareto Laws and L´evy Flights............................ 120
5.4.1 Definitions . . . . . . . . . . . . . . . . . . . . . . . . . . . . . . . . . . . . . . 121
5.4.2 The Gaussian Distribution and the Central Limit The-
orem............................................ 123
5.4.3 L´evyDistributions................................ 126
5.4.4 Non-stable Distributions with Power Laws . . . . . . . . . . . 129
5.5 Scaling, L´evy Distributions,
and L´evy Flights in Nature . . . . . . . . . . . . . . . . . . . . . . . . . . . . . . 131
5.5.1 Criticality and Self-Organized Criticality,
DiffusionandSuperdiffusion ....................... 131
Contents XIII
5.5.2 Micelles ......................................... 133
5.5.3 Fluid Dynamics . . . . . . . . . . . . . . . . . . . . . . . . . . . . . . . . . . 134
5.5.4 TheDynamics oftheHuman Heart................. 137
5.5.5 Amorphous Semiconductors and Glasses . . . . . . . . . . . . . 138
5.5.6 Superposition of Chaotic Processes . . . . . . . . . . . . . . . . . 141
5.5.7 Tsallis Statistics . . . . . . . . . . . . . . . . . . . . . . . . . . . . . . . . . . 142
5.6 New Developments: Non-stable Scaling, Temporal
and Interasset Correlations in Financial Markets . . . . . . . . . . . 146
5.6.1 Non-stable Scaling in Financial Asset Returns . . . . . . . . 147
5.6.2 TheBreadthoftheMarket ........................ 151
5.6.3 Non-linear Temporal Correlations .................. 154
5.6.4 Stochastic Volatility Models . . . . . . . . . . . . . . . . . . . . . . . 159
5.6.5 Cross-Correlationsin StockMarkets ................ 161
6. Turbulence and Foreign Exchange Markets ............... 173
6.1 ImportantQuestions.................................... 173
6.2 TurbulentFlows........................................ 173
6.2.1 Phenomenology .................................. 174
6.2.2 Statistical Descriptionof Turbulence................ 178
6.2.3 Relation to Non-extensive Statistical Mechanics . . . . . . 181
6.3 ForeignExchangeMarkets............................... 182
6.3.1 WhyForeign ExchangeMarkets?................... 182
6.3.2 Empirical Results . . . . . . . . . . . . . . . . . . . . . . . . . . . . . . . . 183
6.3.3 StochasticCascade Models ........................ 189
6.3.4 The Multifractal Interpretation . . . . . . . . . . . . . . . . . . . . 191
7. Derivative Pricing Beyond Black–Scholes ................. 197
7.1 ImportantQuestions.................................... 197
7.2 An Integral Framework for Derivative Pricing . . . . . . . . . . . . . . 197
7.3 ApplicationtoForward Contracts ........................ 199
7.4 Option Pricing (EuropeanCalls) ......................... 200
7.5 MonteCarloSimulations ................................ 204
7.6 Option Pricing in a Tsallis World . . . . . . . . . . . . . . . . . . . . . . . . . 208
7.7 Path Integrals: Integrating the Fat Tails
into Option Pricing . . . . . . . . . . . . . . . . . . . . . . . . . . . . . . . . . . . . . 210
7.8 Path Integrals: Integrating Path Dependence
into Option Pricing . . . . . . . . . . . . . . . . . . . . . . . . . . . . . . . . . . . . . 216
8. Microscopic Market Models .............................. 221
8.1 ImportantQuestions.................................... 221
8.2 Are Markets Efficient? .................................. 222
8.3 ComputerSimulation ofMarketModels ................... 226
8.3.1 TwoClassicalExamples........................... 226
8.3.2 Recent Models . . . . . . . . . . . . . . . . . . . . . . . . . . . . . . . . . . . 227
8.4 The MinorityGame .................................... 246
XIV Contents
8.4.1 TheBasic MinorityGame ......................... 247
8.4.2 A Phase Transition in the Minority Game . . . . . . . . . . . 249
8.4.3 Relation toFinancialMarkets...................... 250
8.4.4 Spin Glasses and an Exact Solution . . . . . . . . . . . . . . . . . 252
8.4.5 Extensions oftheMinorityGame................... 255
9. Theory of Stock Exchange Crashes ....................... 259
9.1 ImportantQuestions.................................... 259
9.2 Examples.............................................. 260
9.3 EarthquakesandMaterialFailure ........................ 264
9.4 Stock ExchangeCrashes................................. 270
9.5 WhatCausesCrashes? .................................. 276
9.6 Are Crashes Rational? .................................. 278
9.7 WhatHappensAfteraCrash? ........................... 279
9.8 ARichter ScaleforFinancialMarkets..................... 285
10. Risk Management ........................................ 289
10.1 Important Questions.................................... 289
10.2 What isRisk?.......................................... 290
10.3 Measures of Risk . . . . . . . . . . . . . . . . . . . . . . . . . . . . . . . . . . . . . . . 291
10.3.1 Volatility . . . . . . . . . . . . . . . . . . . . . . . . . . . . . . . . . . . . . . . . 292
10.3.2 Generalizations of Volatility and Moments . . . . . . . . . . . 293
10.3.3 StatisticsofExtremal Events ...................... 295
10.3.4 Value atRisk .................................... 297
10.3.5 CoherentMeasuresofRisk ........................ 303
10.3.6 Expected Shortfall . . . . . . . . . . . . . . . . . . . . . . . . . . . . . . . . 306
10.4 Types ofRisk.......................................... 308
10.4.1 Market Risk . . . . . . . . . . . . . . . . . . . . . . . . . . . . . . . . . . . . . 308
10.4.2 CreditRisk...................................... 308
10.4.3 Operational Risk ................................. 311
10.4.4 Liquidity Risk . . . . . . . . . . . . . . . . . . . . . . . . . . . . . . . . . . . 314
10.5 Risk Management ...................................... 314
10.5.1 Risk Management Requires a Strategy . . . . . . . . . . . . . . 314
10.5.2 Limit Systems ................................... 315
10.5.3 Hedging......................................... 316
10.5.4 PortfolioInsurance ............................... 317
10.5.5 Diversification ................................... 318
10.5.6 StrategicRiskManagement........................ 323
11. Economic and Regulatory Capital
for Financial Institutions ................................. 325
11.1 Important Questions.................................... 325
11.2 Economic Capital . . . . . . . . . . . . . . . . . . . . . . . . . . . . . . . . . . . . . . 326
11.2.1 WhatDetermines Economic Capital? ............... 326
11.2.2 How Calculate Economic Capital? . . . . . . . . . . . . . . . . . . 327
Contents XV
11.2.3 How Allocate Economic Capital? . . . . . . . . . . . . . . . . . . . 328
11.2.4 Economic Capital as a Management Tool . . . . . . . . . . . . 331
11.3 The Regulatory Framework.............................. 333
11.3.1 WhyBankingRegulation?......................... 333
11.3.2 Risk-BasedCapital Requirements .................. 334
11.3.3 Basel I:RegulationofCreditRisk .................. 336
11.3.4 Internal Models .................................. 338
11.3.5 Basel II: The New International Capital
AdequacyFramework............................. 341
11.3.6 Outlook: BaselIII andBaselIV.................... 358
Appendix ..................................................... 359
Notes and References ......................................... 364
Index ......................................................... 375
1. Introduction
1.1 Motivation
The public interest in traded securities has continuously grown over the past
few years, with an especially strong growth in Germany and other European
countries at the end of the 1990s. Consequently, events influencing stock
prices, opinions and speculations on such events and their consequences, and
even the daily stock quotes, receive much attention and media coverage. A
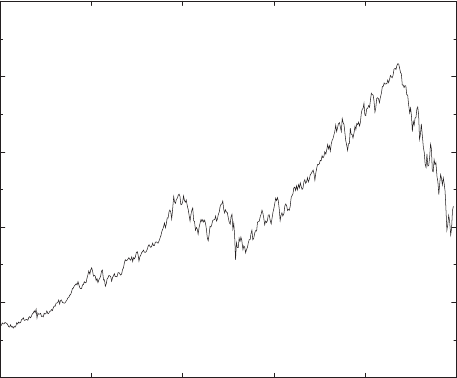
few reasons for this interest are clearly visible in Fig. 1.1 which shows the
evolution of the German stock index DAX [1] over the two years from October
1996 to October 1998. Other major stock indices, such as the US Dow Jones
Industrial Average, the S&P500, or the French CAC40, etc., behaved in a
similar manner in that interval of time. We notice three important features: (i)
the continuous rise of the index over the first almost one and a half years which
14/10/96 9/3/97 4/8/97 18/12/97 22/5/98 13/10/98
2000
3000
4000
5000
6000
7000
Fig. 1.1. Evolution of the DAX German stock index from October 14, 1996 to
October 13, 1998. Data provided by Deutsche Bank Research

2 1. Introduction
was interrupted only for very short periods; (ii) the crash on the “second
black Monday”, October 27, 1997 (the “Asian crisis”, the reaction of stock
markets to the collapse of a bank in Japan, preceded by rumors about huge
amounts of foul credits and derivative exposures of Japanese banks, and a
period of devaluation of Asian currencies). (iii) the very strong drawdown of
quotes between July and October 1998 (the “Russian debt crisis”, following
the announcement by Russia of a moratorium on its debt reimbursements,
and a devaluation of the Russian rouble), and the collapse of the Long Term
Capital Management hedge fund.
While the long-term rise of the index until 2000 seemed to offer investors
attractive, high-return opportunities for making money, enormous fortunes
of billions or trillions of dollars were annihilated in very short times, perhaps
less than a day, in crashes or periods of extended drawdowns. Such events –
the catastrophic crashes perhaps more than the long-term rise – exercise a
strong fascination.
To place these events in a broader context, Fig. 1.2 shows the evolution
of the DAX index from 1975 to 2005. Several different regimes can be dis-
tinguished. In the initial period 1975–1983, the returns on stock investments
were extremely low, about 2.6% per year. Returns of 200 DAX points, or
12%, per year were generated in the second period 1983–1996. After 1996,
we see a marked acceleration with growth rates of 1200 DAX points, or 33%,
per year. We also notice that, during the growth periods of the stock mar-
ket, the losses incurred in a sudden crash usually persist only over a short
1/1975 1/1985 1/1995 1/2005
300
1000
3000
1000010000
DAX
Fig. 1.2. Long-term evolution of the DAX German stock index from January 1,
1975 to January 1, 2005. Data provided by Deutsche Bank Research supplemented
by data downloaded from Yahoo, http://de.finance.yahoo.com
1.1 Motivation 3
time, e.g. a few days after the Asian crash [(ii) above], or about a year after
the Russian debt crisis [(iii) above]. The long term growth came to an end,
around April 2000 when markets started sliding down. The fourth period in
Fig. 1.2 from April 2000 to the end of the time series on March 12, 2003, is
characterized by a long-term downward trend with losses of approximately
1400 DAX points, or 20% per year. The DAX even fell through its long-term
upward trend established since 1983. Despite the overall downward trend of
the market in this period, it recovered as quickly from the crash on Septem-
ber 11, 2001, as it did after crashes during upward trending periods. Finally,
the index more or less steadily rose from its low at 2203 points on March 12,
2003 to about 4250 points at the end of 2004. Only the future will show if a
new growth period has been kicked off.
This immediately leads us to a few questions:
• Is it possible to earn money not only during the long-term upward moves
(that appears rather trivial but in fact is not) but also during the drawdown
periods? These are questions for investors or speculators.
• What are the factors responsible for long- and short-term price changes of
financial assets? How do these factors depend on the type of asset, on the
investment horizon, on policy, etc.?
• How do the three growth periods of the DAX index, discussed in the pre-
ceding paragraph, correlate with economic factors? These are questions for
economists, analysts, advisors to politicians, and the research departments
of investment banks.
• What statistical laws do the price changes obey? How smooth are the
changes? How frequent are jumps? These problems are treated by mathe-
maticians, econometrists, but more recently also by physicists. The answer
to this seemingly technical problem is of great relevance, however, also to
investors and portfolio managers, as the efficiency of stop-loss or stop-buy
orders [2] directly depends on it.
• How big is the risk associated with an investment? Can this be measured,
controlled, limited or even eliminated? At what cost? Are reliable strategies
available for that purpose? How big is any residual risk? This is of interest
to banks, investors, insurance companies, firms, etc.
• How much fortune is at risk with what probability in an investment into a
specific security at a given time?
• What price changes does the evolution of a stock price, resp. an index,
imply for “financial instruments” (derivatives, to be explained below, cf.
Sect. 2.3)? This is important both for investors but also for the writing
bank, and for companies using such derivatives either for increasing their
returns or for hedging (insurance) purposes.
• Can price changes be predicted? Can crashes be predicted?
4 1. Introduction
1.2 Why Physicists? Why Models of Physics?
This book is about financial markets from a physicist’s point of view. Sta-
tistical physics describes the complex behavior observed in many physical
systems in terms of their simple basic constituents and simple interaction
laws. Complexity arises from interaction and disorder, from the cooperation
and competition of the basic units. Financial markets certainly are complex
systems, judged both by their output (cf., e.g., Fig. 1.1) and their struc-
ture. Millions of investors frequent the many different markets organized by
exchanges for stocks, bonds, commodities, etc. Investment decisions change
the prices of the traded assets, and these price changes influence decisions in
turn, while almost every trade is recorded.
When attempting to draw parallels between statistical physics and finan-
cial markets, an important source of concern is the complexity of human
behavior which is at the origin of the individual trades. Notice, however, that
nowadays a significant fraction of the trading on many markets is performed
by computer programs, and no longer by human operators. Furthermore, if
we make abstraction of the trading volume, an operator only has the possi-
bility to buy or to sell, or to stay out of the market. Parallels to the Ising or
Potts models of Statistical Physics resurface!
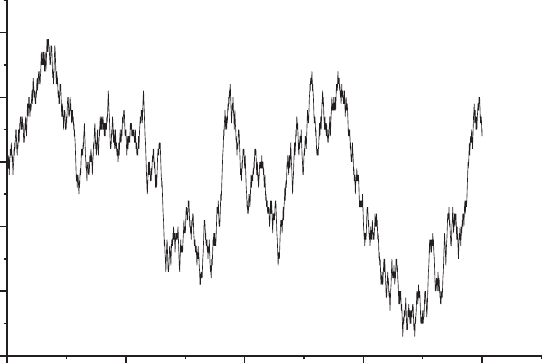
More specifically, take the example of Fig. 1.1. If we subtract out long-
term trends, we are left essentially with some kind of random walk. In other
words, the evolution of the DAX index looks like a random walk to which
is superposed a slow drift. This idea is also illustrated in the following story
taken from the popular book “A Random Walk down Wall Street” by B. G.
Malkiel [3], a professor of economics at Princeton. He asked his students to
derive a chart from coin tossing.
“For each successive trading day, the closing price would be determined
by the flip of a fair coin. If the toss was a head, the students assumed the
stock closed 1/2 point higher than the preceding close. If the flip was a
tail, the price was assumed to be down 1/2. ... The chart derived from the
random coin tossing looks remarkably like a normal stock price chart and
even appears to display cycles. Of course, the pronounced ‘cycles’ that we
seem to observe in coin tossings do not occur at regular intervals as true
cycles do, but neither do the ups and downs in the stock market. In other
simulated stock charts derived through student coin tossings, there were
head-and-shoulders formations, triple tops and bottoms, and other more
esoteric chart patterns. One of the charts showed a beautiful upward
breakout from an inverted head and shoulders (a very bullish formation).
I showed it to a chartist friend of mine who practically jumped out of
his skin. “What is this company?” he exclaimed. “We’ve got to buy
immediately. This pattern’s a classic. There’s no question the stock will
be up 15 points next week.” He did not respond kindly to me when I told
him the chart had been produced by flipping a coin.” Reprinted from B.
G. Malkiel: A Random Walk down Wall Street,
c
1999 W. W. Norton
1.2 Why Physicists? Why Models of Physics? 5
0 500 1000 1500 2000
0
10
20
30
40
50
price
time
Fig. 1.3. Computer simulation of a stock price chart as a random walk
The result of a computer simulation performed according to this recipe,
is shown in Fig. 1.3, and the reader may compare it to the DAX evolution
shown in Fig. 1.1. “THE random walk”, usually describing Brownian motion,
but more generally any kind of stochastic process, is well known in physics;
so well known in fact that most people believe that its first mathematical
description was achieved in physics, by A. Einstein [4].
It is therefore legitimate to ask if the description of stock prices and other
economic time series, and our ideas about the underlying mechanisms, can
be improved by
• the understanding of parallels to phenomena in nature, such as, e.g.,
– diffusion
– driven systems
– nonlinear dynamics, chaos
– formation of avalanches
– earthquakes
– phase transitions
– turbulent flows
– stochastic systems
– highly excited nuclei
– electronic glasses, etc.;
• the associated mathematical methods developed for these problems;
• the modeling of phenomena which is a distinguished quality of physics.
This is characterized by
6 1. Introduction
– identification of important factors of causality, important parameters,
and estimation of orders of magnitude;
– simplicity of a first qualitative model instead of absolute fidelity to real-
ity;
– study of causal relations between input parameters and variables of a
model, and its output, i.e. solutions;
– empirical check using available data;
– progressive approach to reality by successive incorporation of new ele-
ments.
These qualities of physicists, in particular theoretical physicists, are being
increasingly valued in economics. As a consequence, many physicists with an
interest in economic or financial themes have secured interesting, challenging,
and well-paid jobs in banks, consulting companies, insurance companies, risk-
control divisions of major firms, etc.
Rather naturally, there has been an important movement in physics to
apply methods and ideas from statistical physics to research on financial data
and markets. Many results of this endeavor are discussed in this book. Notice,
however, that there are excellent specialists in all disciplines concerned with
economic or financial data, who master the important methods and tools
better than a physicist newcomer does. There are examples where physicists
have simply rediscovered what has been known in finance for a long time.
I will mention those which I am aware of, in the appropriate context. As
an example, even computer simulations of “microscopic” interacting-agent
models of financial markets have been performed by economists as early as
1964 [5]. There may be many others, however, which are not known to me.
I therefore call for modesty (the author included) when physicists enter into
new domains of research outside the traditional realm of their discipline. This
being said, there is a long line of interaction and cross-fertilization between
physics and economy and finance.
1.3 Physics and Finance – Historical
The contact of physicists with finance is as old as both fields. Isaac Newton
lost much of his fortune in the bursting of the speculative bubble of the South
Sea boom in London, and complained that while he could precisely compute
the path of celestial bodies to the minute and the centimeter, he was unable
to predict how high or low a crazy crowd could drive the stock quotations.
Carl Friedrich Gauss (1777–1855), who is honored on the German 10
DM bill (Fig. 1.4), has been very successful in financial operations. This
is evidenced by his leaving a fortune of 170,000 Taler (contemporary, local
currency unit) on his death while his basic salary was 1000 Taler. According
to rumors, he derived the normal (Gaussian) distribution of probabilities in