Szilas A.P. Production and transport of oil and gas, Gathering and Transportation
Подождите немного. Документ загружается.

240
7
PIPELINE TRANSPORTATION
OF
OIL
that
if
t,
=
25
min, and the flow velocity
u=
1
m/s, the flow behaviour of the oil may
change before covering a distance of 25.60.
1
=
1500
m, and then they get
stabilized. During this period, the starting value of the apparent viscosity, and
so
that of the flow gradient, decreases to a stabilized smaller value. For this reason,
with
a relatively short pipeline, the use of the isochronal flow curves may be justified.
If
the length is of
10-
I00
km magnitude, however, the accuracy of the pressure loss
calculation is insignificantly influenced by the fact, that, the flow gradient is higher
in the first section of
1
-2
km length than in the following one. That is why, at long-
distance pipelines, the pressure
loss
is calculated using steady-state flow curves. The
flow gradient is constant along the pipeline at isothermal flow, similarly to that of
Newtonian fluid flow.
At
non-isothermal flow, essentially the procedure, described
in
Section 7.6.4
-
(a,
b) is used for pressure
loss
calculation.
A
slight modification is needed however
because,
in
order to determine the convection factor, a,
(Eq.
7.6-
18).
the Nusselt
coeficient must be determined as a function of the kinematic viscosity
(Eq.
7.6
-
21).
For pseudoplastic crudes, instead of this the apparent viscosity, valid for the given
shear rate should be used.
7.6.5.
Temperature
of
oil
in transient
flow,
in buried pipelines
In
the foregoing sections we have assumed the heat flow about the buried pipeline
to be steady. This is the case
if
the pipeline carries a crude of inflow temperature, flow
rate and physical parameters constant over a comparatively long span of time. and
the temperature of the soil outside the warmed-up envelope about the pipeline is
subject to no change. Strictly speaking, this condition is never satisfied.
If,
however,
departure from the steady state is comparatively slight, procedures outlined
in
Sections 7.6.2 and 7.6.4 remain applicable.
In numerous cases of considerable practical interest, however, deviation from the
steady state may be sufficient to make the steady-state relationships unsuited for
even an approximate description of the situation. Transient heat-flow situations of
this nature will tend to arise primarily in the following cases:
(i)
when starting up
a
hot pipeline: the hot oil flowing into the pipeline that, initially, is as cold as the
ground,
will
gradually warm the environment;
(ii)
flow in the pipeline is stopped and
then started again;
(iii)
flow rates in the pipeline are subject to fluctuations,
(iv)
the
nature and hence the thermal properties of the crude transported are subject
to
fluctuations. Any meaningful attempt at solving these problems requires the
knowledge of the relationships characterizing the processes of warming and cooling.
These will permit the calculation of pressures arising on start-up and restarting, and
the variation
of
said pressures with time.
Numerous models and calculation methods have been devised to describe the
transient heat-flow and liquid-flow situations and to solve partial problems all
subsumed under the above-stated general problems. To mitigate the complications
caused by the large number of variables involved, simplifying assumptions have
been introduced, and, as a result of these, individual models may rather
7
6
NON-ISOTHERMAL
011.
TKANSPORT
24
I
substantially differ from one another. The first attempts at a synthesis have been
published, but the development of theories readily applicable
in
practice has
not by far been accomplished as yet. One publication to be given special mention is
Tugunov's academic thesis (Tugunov
I968),
which summarizes
39
papers written on
the subject by the author and his co-workers. Similarly interesting synthescs were
presented at the Symposium on 'Waxy crudes
in
relation to pipeline operations'
(London, November
1970).
Some of the lectures presented were concerned
with
transient-flow problems (Davenport and Conti
1971).
It
seems, however, too early
yet to attempt a synthesis of the results achieved
so
far
in
the scope of the present
book. In the following
I
propose to present a transient model which describes the
temperature changes of flow v. length and time
in
a pipeline shut down after steady-
state flow (Szilas
1968).
It
is assumed that
(i)
the pipeline is embedded in an infinite half-space filled
with
soil homogeneous as to thermal behaviour,
(ii)
the temperature of the soil in contact
with
the pipeline can be described by the Chernikin model
(1958)
based on the
linear-heat-source theory of Carslaw and Jaeger
(1947).
-
The solution referred to
has been used by Chernikin to characterize oil temperatures
in
non-insulated
pipelines, neglecting the difference between the thermal behaviour of oil and soil.
In
the following
I
shall derive the 'cooling model'
for
an insulated pipeline. Let us
assume that, at a given instant
t,
oil temperature is constant all over a certain cross-
section of the pipeline, including also the steel pipe cross-section; that is,
T,
=
T,,
where suffix
o
refers to the
OD.
Heat flowing through the wall of unity-length pipe into the cooler ground over an
infinitesimal length
of
time dr reduces the temperature of oil and steel by dT
where the symbol
T'
refers to the transient nature of the process. The heat transfer
factor is, after the necessary changes
to
Eq.
7.6- 17:
Let
7.6
-
46
Cooling
will
affect not only oil temperature Ti, but also the outer surface
temperature
TI,
of
the insulation.
It
is to describe this change that we shall make use
of the
Carslaw-Jaeger-Chernikin
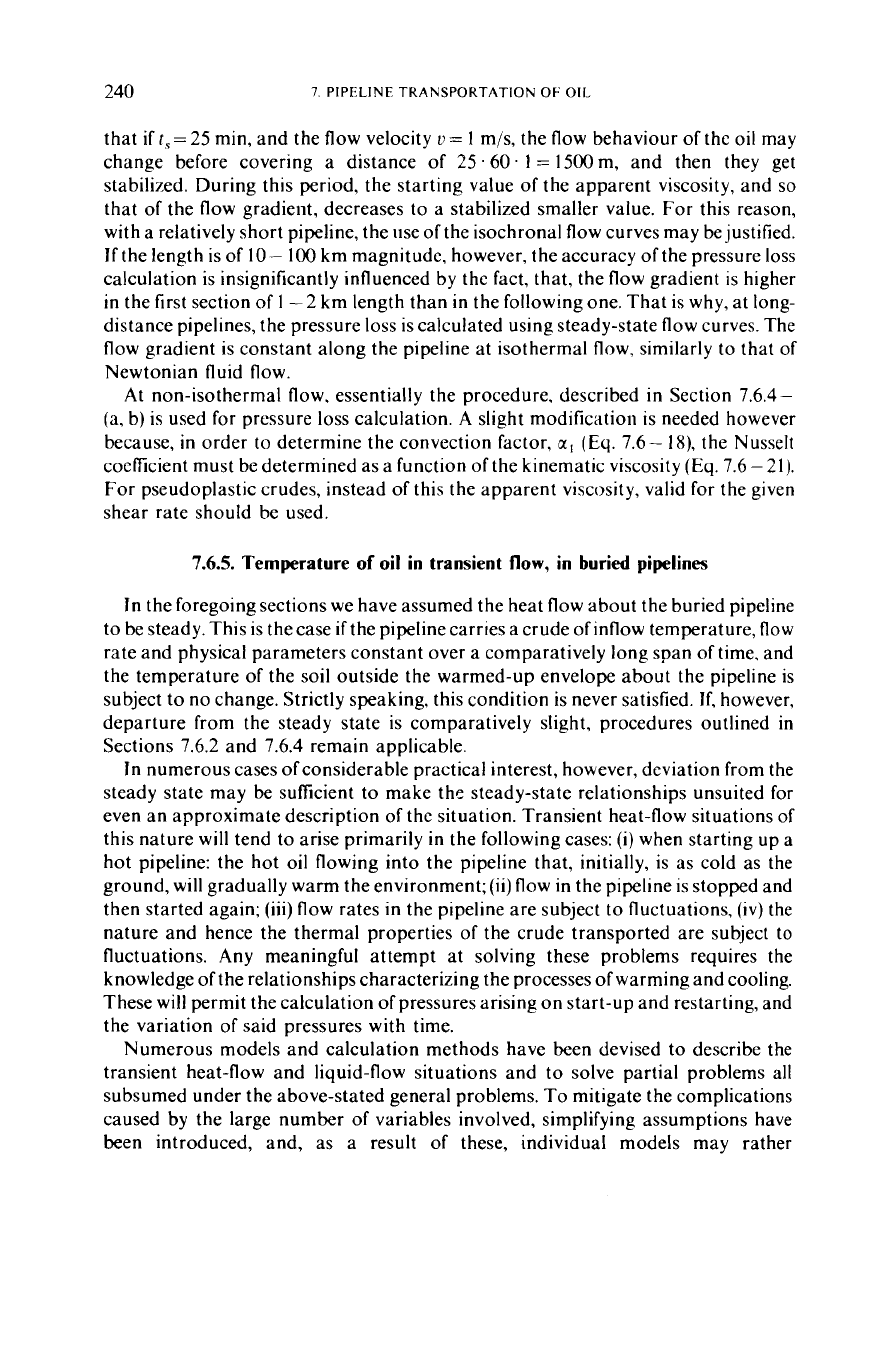
relationship. Let
P,
be the image of the projection
of the linear heat source on a plane perpendicular to
it
(Fig.
7.6-14);
then the
16
242
7.
PIPELINE
TRANSPORTATION
OF
OI[
\
/
'-
/'
Fig.
7.6-
14.
difference in temperature between point
P,
lying in the plane of projection and
defined
by
the coordinates
y
and
z
and the undisturbed soil
will
be
z-T,=
"-{Ei[-
-
h2
-]-Ei[
1
-
L]}.
7.6-47
4x2,
r2 N,, 4Nv0
If
t
=
co,
then the Equation reduces
to
the following form valid for steady-state
flow:
@*
2h
2x2,
r
To-T,=
__
In
-
.
7.6
-
48
Now making use
of
Eqs
7.6
-
47
and
7.6
-
48,
where
as(
N,o=
I.'
is the Fourier factor. In a given pipeline, that is,
if
h,
r,
is,
ps
and
c,~
are given, this
reduces
to
the simpler form
To-
T,
T,-K
=K
This relationship, in the form given here, describes the process of warming up.
In
the
case of cooling down after steady-state flow, on the other hand,
7
6.
NON-ISOTHERMAL OIL TRANSPORT
243
that is,
Ti,=(I-.)
(T,,-
TJ+T,
7.6
-
50
Chernikin used this relationship to determine the surface temperature of an 'oil
cylinder'of radius
r.
He assumed the difference in thermal properties between oil
in
a
non-insulated pipeline and the surrounding soil to be negligible.
In
an insulated
pipeline, this relationship seems suited to determine the external temperature of the
insulation, that is,
Tr
an
=(
1
-
K)
(
Tn-
7J+
T,
.
7.6-51
If
this expression of the external, variable temperature
TI,
of the pipeline is
introduced into Eq.
7.6-46,
then this latter furnishes the time variation of the
temperature of oil enclosed in an insulated pipeline. The complicated nature of this
relationship made
us
adopt the following simplified method for solving
it.
The
relationship
~=f(t)
for a given case can be plotted graphically using Eq.
7.6-49.
The individual sections
of
the curve thus obtained are approximated well enough by
a relationship of the form
K=u+hInt.
7.6
-
52
Introducing this relationship into Eq.
7.6-
51,
and the result into Eq.
7.6-46,
we
ge
t
=
-df
7.6
-
53
d
T,
T:-B+cG
A
where
and
The general solution of Eq.
7.6
-
53
is
Tb=B-CInt+
CEi
-
+c
r-2
i
[:I
I
'
7.6
-
54
wherecis theconstant ofintegration. The initial condition of
To=
T,,
iff
=Ogives the
particular solution
+T,,-B-C(0.5772-
InA)
L'
2.
7.6-55
I'
This relationship permit
us
to calculate the variation of temperature
TI
=
Tj
v.
the
time
f
elapsed after shutdown of the pipeline, at any pipeline section situated at
distance
1
from the head end of the line.
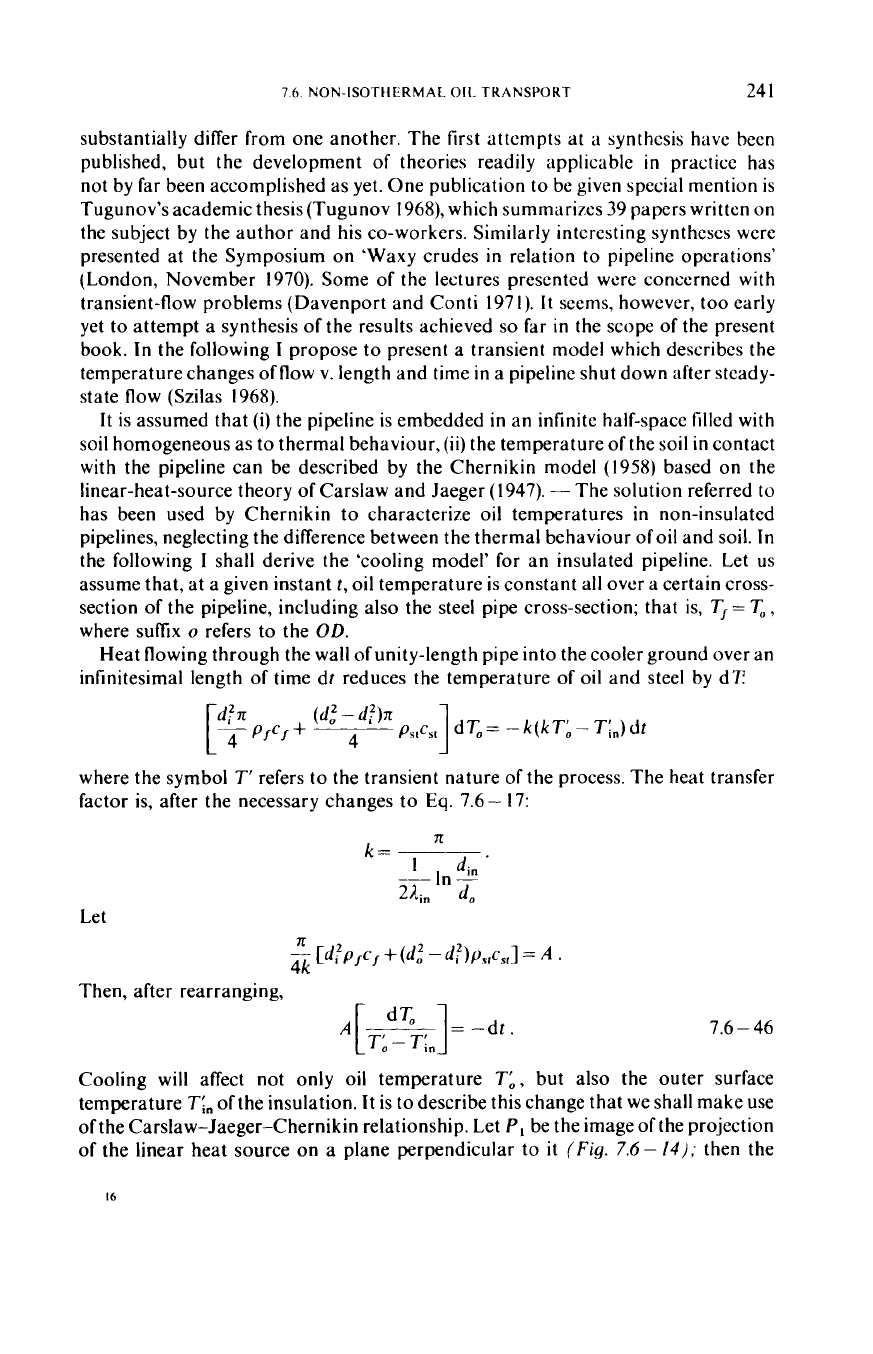
Figure
7.6
-
I5
shows the time variation of the temperature of oil enclosed
in
an insulated pipeline.
In
plotting these curves
using
Eq.
7.6-55
we have assumed
the temperature prevailing during steady-state
flow
to be 70°C at the instant
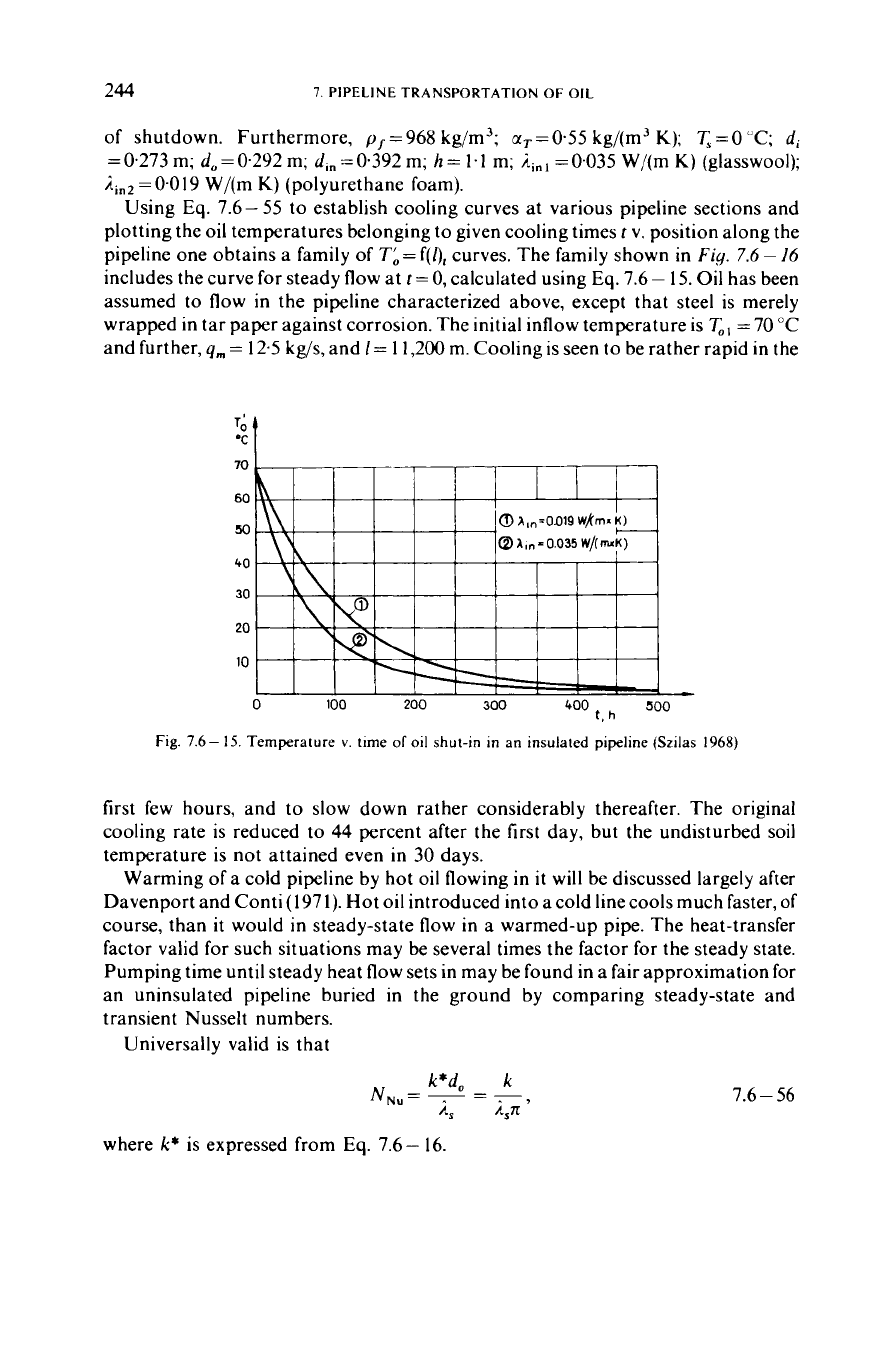
244
7.
PIPELINE TRANSPORTATION
OF
OIL
of
shutdown. Furthermore,
pr
=
968 kg/m3;
aT
=035
kg/(m3
K);
T,
=
0
"C;
di
=
0.273 m;
do
=
0.292 m;
d,,
=
0.392 m;
h
=
1.1
m;
iinl
=
0.035
W/(m
K)
(glasswool);
iin2
=0.019 W/(m
K)
(polyurethane foam).
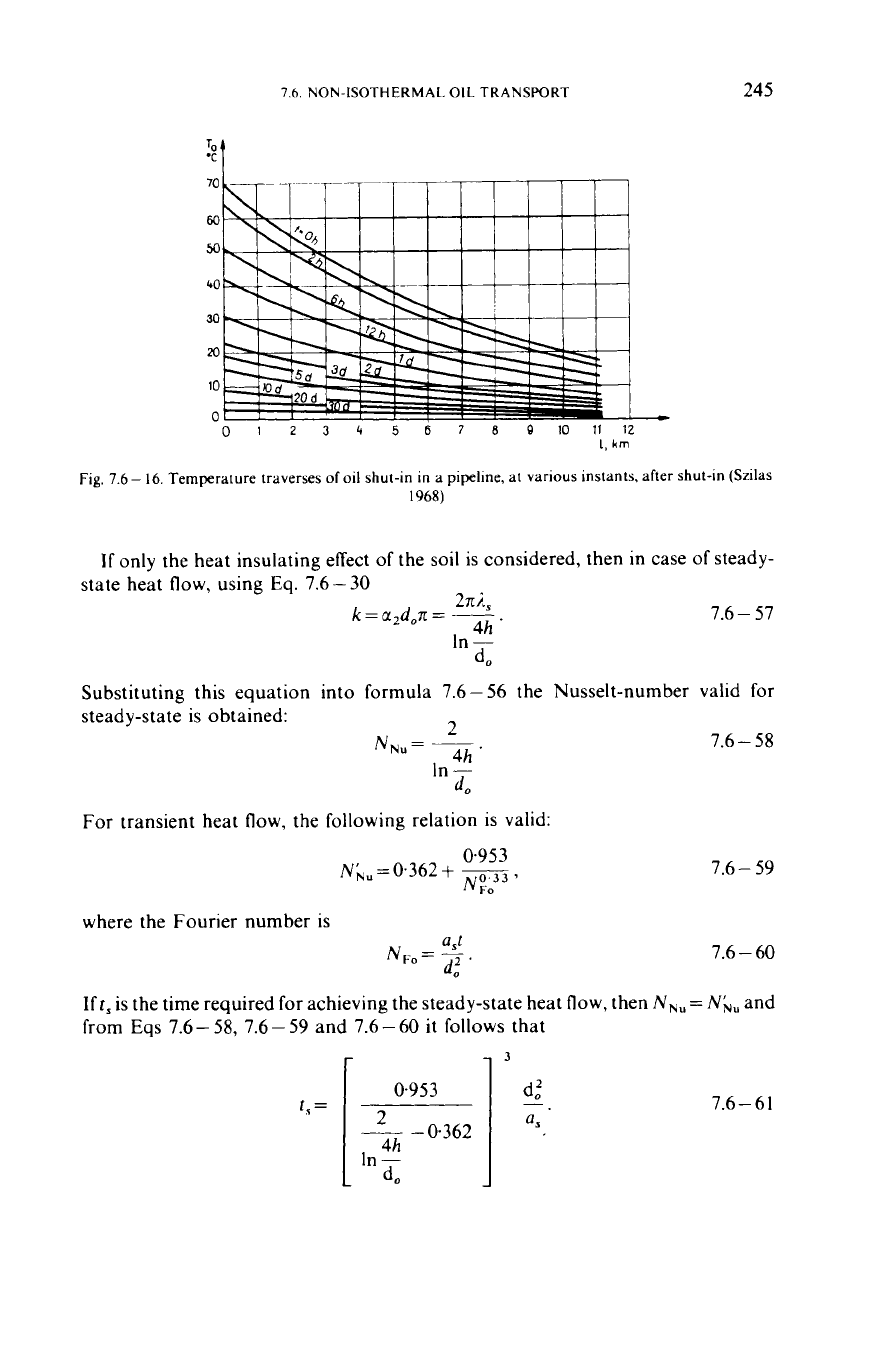
Using
Eq.
7.6
-
55
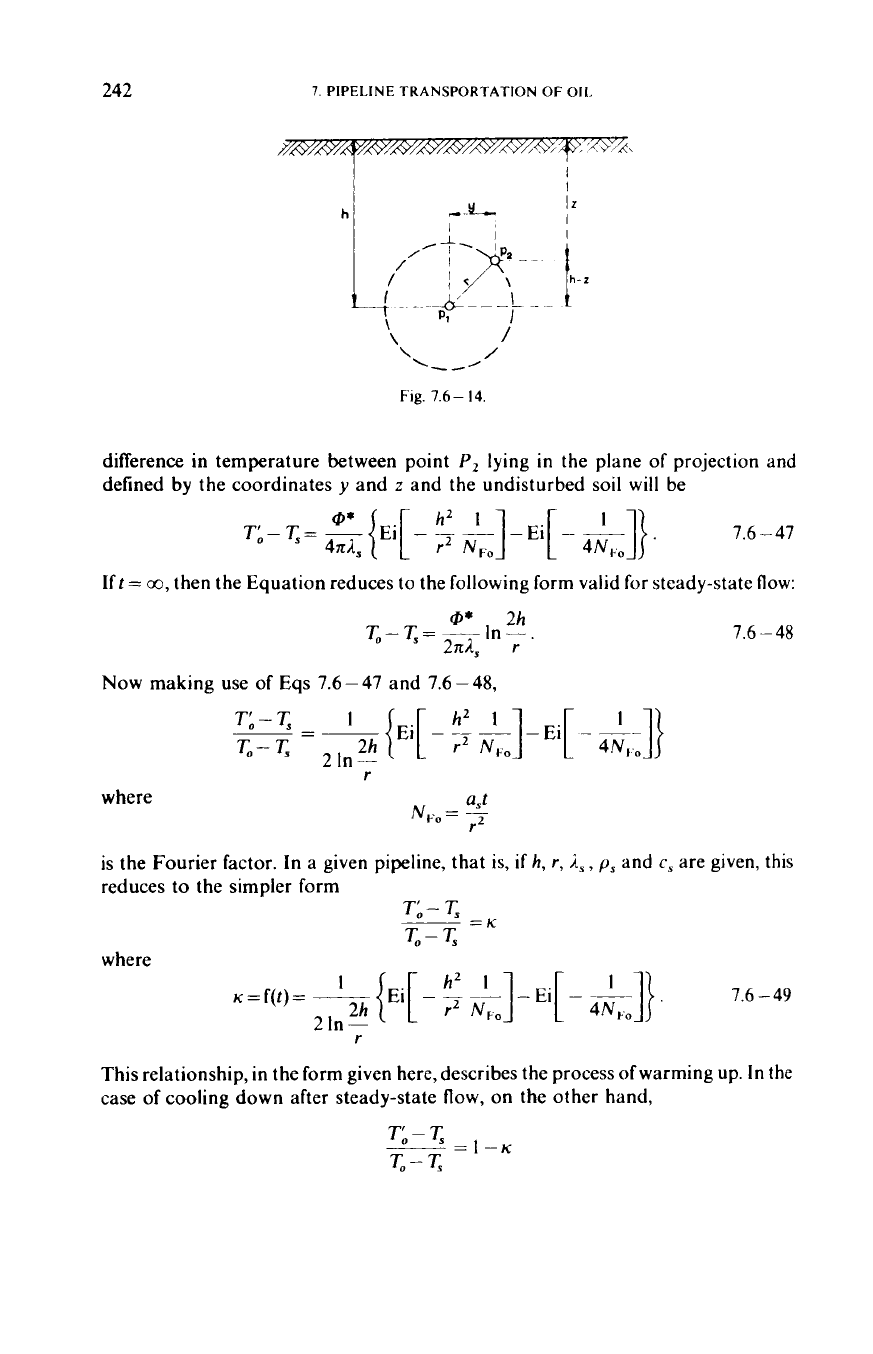
to establish cooling curves at various pipeline sections and
plotting the oil temperatures belonging to given cooling times
i
v. position along the
pipeline one obtains a family
of
Tb
=
f(l),
curves. The family shown in
Fig.
7.6
-
16
includes the curve
for
steady flow at
t
=
0,
calculated using
Eq.
7.6
-
15.
Oil
has been
assumed to flow
in
the pipeline characterized above, except that steel is merely
wrapped in tar paper against corrosion. The initial inflow temperature is
T,,
=
70
"C
and further,
qm
=
12.5 kg/s, and
1
=
1
1,200
m. Cooling is seen to be rather rapid
in
the
500
lroo
t,
h
0
I00
200
300
Fig.
7.6-
15.
Temperature
v.
time
of
oil
shut-in in an insulated pipeline (Szilas
1968)
first few hours, and to slow down rather considerably thereafter. The original
cooling rate is reduced to
44
percent after the first day, but the undisturbed soil
temperature is not attained even in 30 days.
Warming of a cold pipeline by hot oil flowing in
it
will be discussed largely after
Davenport and Conti (1971). Hot oil introduced into a cold line cools much faster, of
course, than
it
would in steady-state flow
in
a warmed-up pipe. The heat-transfer
factor valid
for
such situations may be several times the factor for the steady state.
Pumping time until steady heat flow sets in may be found in a fair approximation
for
an uninsulated pipeline buried in the ground by comparing steady-state and
transient Nusselt numbers.
Universally valid is that
7.6
-
56
where
k*
is expressed from
Eq.
7.6-
16.
7.6.
NON-ISOTHERMAL.
OIL
TRANSPORT
245
70
60
50
40
30
20
10
0
0
I
2
3
4
5
6
7
8
8
10
11
12
1,
km
Fig.
7.6-
16.
Temperature traverses
of oil
shut-in in a pipeline, at
various
instants. after shut-in (Szilas
1968)
If
only the heat insulating effect
of
the
soil
is considered, then in case
of
steady-
state heat
flow,
using Eq.
7.6
-
30
2Ti,
4h
.
d0
k
=
a2don
=
__
7.6
-
57
In
-
Substituting this equation into formula
7.6
-
56
the Nusselt-number valid
for
steady-state
is
obtained:
-,
For transient heat
flow,
the following relation
is
valid:
0.953
N’,,=0.362+
p-j=j,
FO
where the Fourier number is
7.6
-
58
7.6
-
59
7.6
-
60
If
ts
is the time required
for
achieving the steady-state heat
flow,
then
NN,
=
NL,,
and
from
Eqs
7.6
-
58,
7.6
-
59
and
7.6
-
60
it
follows
that
r
13
7.6-61
246
7.
PIPELINE TRANSPORTATION
OF
OIL
Example
7.6-5.
Let
us
calculate that how much time is required to attain the
Putting the above values into
Eq.
7.6-61
we get
steady-state heat flow,
if
do
=
0.292
m;
h
=
1.1
m;
a,
=
0.86
x
10
~ m'/s.
1,
=
3
0.953
1
0,292'
=
1.62
Ms
=
18.8
days.
In reality, the hypothesis of the infinite half-space
will
not model the actual heat
flow too accurately after the heat flow issuing from the pipeline has attained the
ground surface. Heat
loss
will exceed the calculated value by
10
to
15
percent
thereafter. The heat flow pattern
will
change, however, very slowly, and the time
it
takes to attain the steady state is infinite
in
principle. The accuracy of
2,
is not as
a
rule better than
10
percent. Accuracy is not, then, impaired any further
if
the above
relationship is considered to hold also for the steady state.
Flow in pipelines is not usually interrupted long enough for the oil
in
the pipe to
cool down to the undisturbed soil temperature.
On
restarting. then, the initial
temperature is higher than the undisturbed soil temperature, and
it
takes less time to
attain the steady or a near-steady state. Finding this time for an uninsulated pipeline
may be performed by the following consideration. We prepare a family of curves
similar to that in
Fig.
7.6
--
16
for the case under consideration. Each curve of
the
family will be represented
in
a fair approximation by a
7.6
-
15-type equation. These
equations will differ only
as
to the value of
k,
but even
k
will be constant all along a
given curve. Putting
qp
=
qm
,
and c
=
c,
,
one may write up for any curve
In
AT,
-
In
AT,
I
4m"o
k=
--
7.6
-
62
where
AT=
T-
q.
Knowing the duration of cooling one may pick out that curve from
Fig.
7.6
-
16
which will hold when flow is restarted.
It
is necessary to calculate the time
it
would
take for the oil flowing
in
the pipe to attain this state
if
pumping hot oil were started
through an entirely cold environment.
In
order to find it, we use Eq.
7.6-62
to
determine the
k
value corresponding to the actual cooling curve and then Eq.
7.6
-
56
to
determine the transient
N,,
;
Eq.
7.6
-
59
is then used to calculate
N,,
and
Eq.
7.6-60
to find the equivalent pumping time. This is the reduction
in
the time
needed to attain steady heat flow against the case when pumping is started at the
undisturbed soil temperature.
1.6
NON-ISOTHERMAL
OIL
TRANSPORT
247
7.6.6.
Startup pressure and
its
reduction
(a)
The
oil
is
Newtonian
A
pipeline may in principle be warmed up simply by pumping into
it
the high-
viscosity crude
to
be transported. This would, however, require long pumping, often
of
unjustified duration. Accordingly, the cooled-down pipe is usually flushed first
with hot light
oil
and the high-viscosity crude is not introduced until the line has
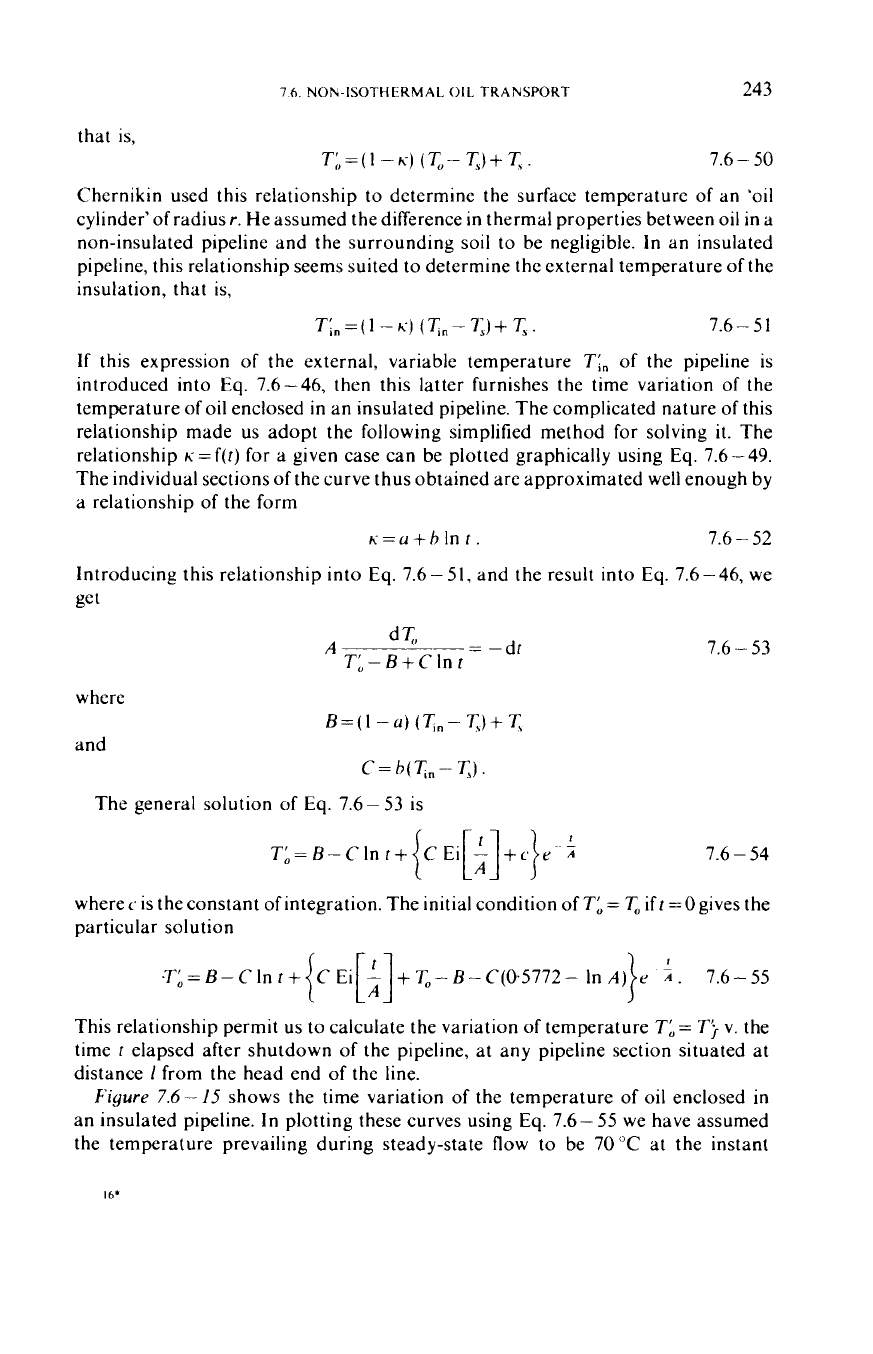
sufficiently warmed up. Pressure conditions in the warming-up pipeline can be
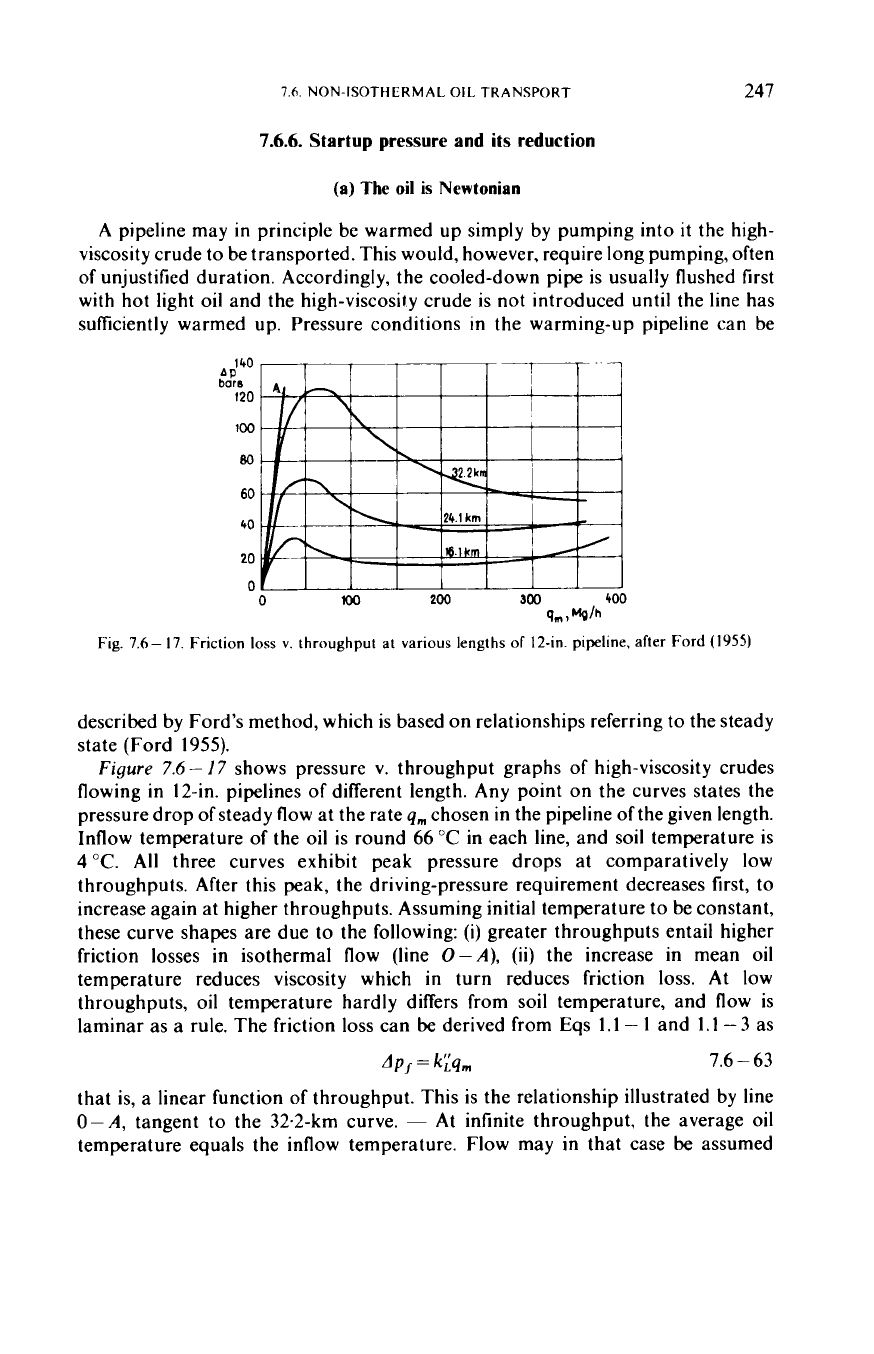
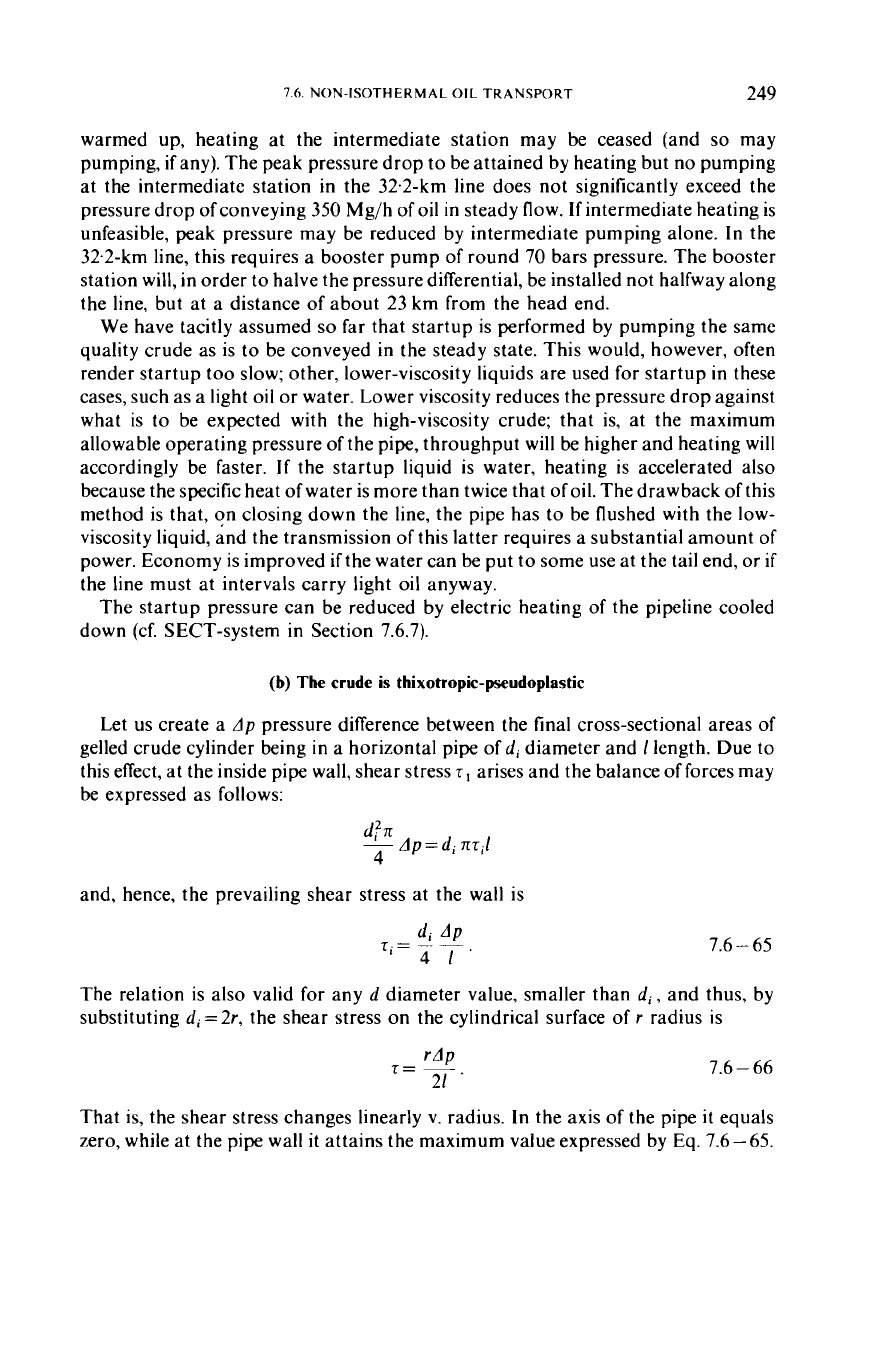
Fig. 7.6-
17.
Friction
loss
v. throughput at various lengths of
12-in.
pipeline, after Ford
(1955)
described by Ford's method, which
is
based on relationships referring
to
the steady
state (Ford
1955).
Figure 7.6
-
17
shows pressure
v.
throughput graphs
of
high-viscosity crudes
flowing in 12-in. pipelines
of
different length. Any point on the curves states the
pressure drop
of
steady
flow
at the rate
qm
chosen in the pipeline
of
the given length.
Inflow temperature
of
the
oil
is round
66
"C
in each line, and soil temperature is
4°C. All three curves exhibit peak pressure drops at comparatively low
throughputs. After this peak, the driving-pressure requirement decreases first, to
increase again at higher throughputs. Assuming initial temperature
to
be constant,
these curve shapes are due to the following:
(i)
greater throughputs entail higher
friction losses in isothermal flow (line
0-A),
(ii) the increase in mean
oil
temperature reduces viscosity which in turn reduces friction
loss.
At
low
throughputs,
oil
temperature hardly differs from
soil
temperature, and flow is
laminar as a rule. The friction
loss
can
be
derived from Eqs
1.1
-
1
and
1.1
-
3
as
AP,
=
kiqm
7.6
-
63
that is, a linear function
of
throughput. This is the relationship illustrated by line
0-A,
tangent to the 32.2-km curve.
-
At
infinite throughput, the average
oil
temperature equals the inflow temperature. Flow may in that case
be
assumed
248
7.
PIPELINE TRANSPORTATION
OF
OIL
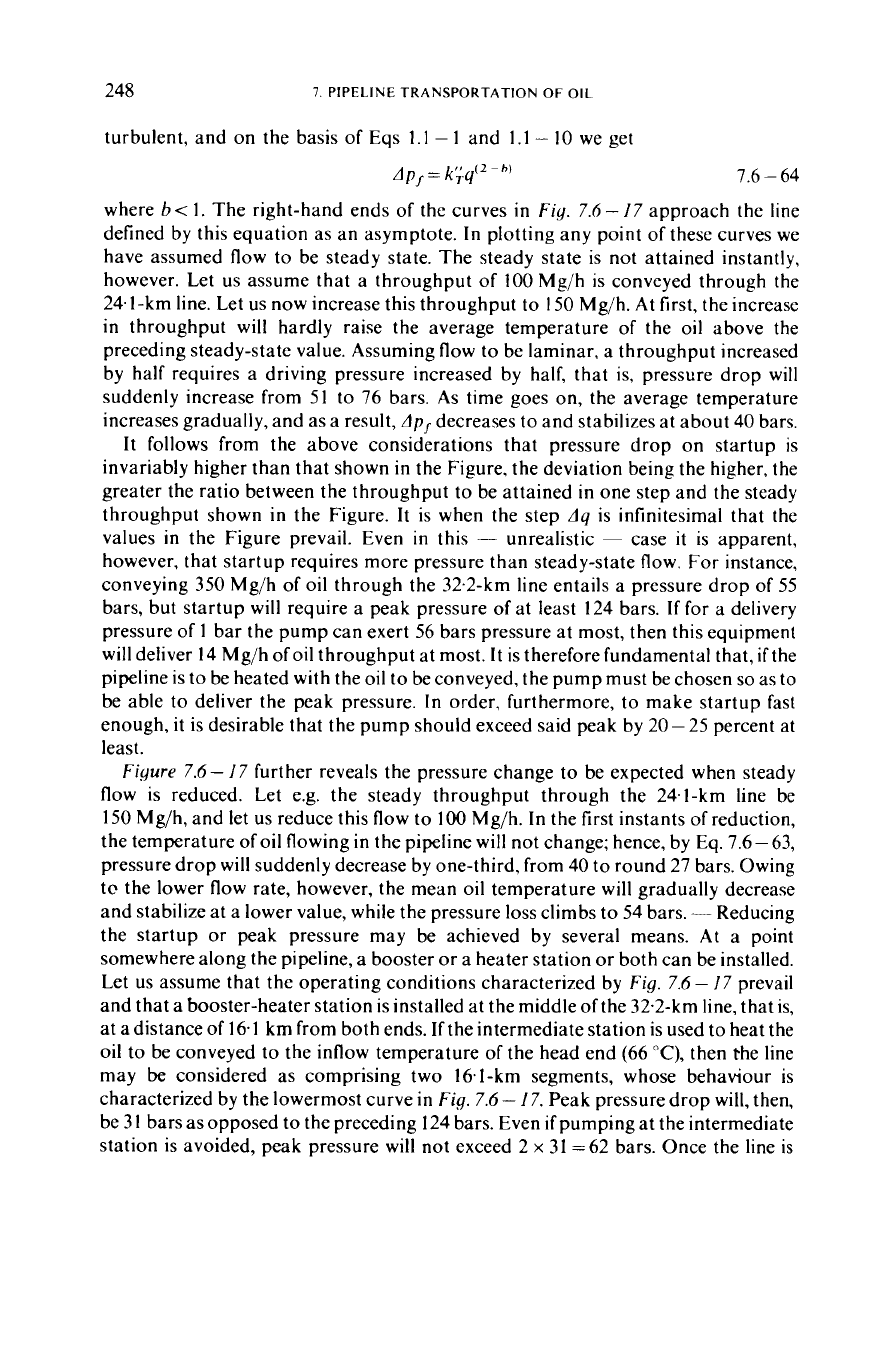
turbulent, and on the basis of Eqs
1.1
-
1
and
1.1
-
10 we get
Ap,=k';.q'2-h'
7.6
-
64
where
b<
1.
The right-hand ends of the curves
in
Fig.
7.6-
17 approach the line
defined by this equation as an asymptote.
In
plotting any point of these curves we
have assumed flow to be steady state. The steady state is not attained instantly,
however. Let us assume that a throughput of
100
Mg/h is conveyed through the
24.1-km line. Let us now increase this throughput to I50 Mg/h.
At
first, the increase
in
throughput will hardly raise the average temperature of the oil above the
preceding steady-state value. Assuming flow to be laminar. a throughput increased
by half requires a driving pressure increased by half, that is, pressure drop
will
suddenly increase from 51 to 76 bars.
As
time goes on, the average temperature
increases gradually, and as a result,
Ap,
decreases to and stabilizes at about 40 bars.
It
follows from the above considerations that pressure drop on startup is
invariably higher than that shown
in
the Figure, the deviation being the higher, the
greater the ratio between the throughput to be attained
in
one step and the steady
throughput shown in the Figure.
It
is when the step
Aq
is infinitesimal that the
values
in
the Figure prevail. Even
in
this
-
unrealistic ~ case
it
is apparent,
however, that startup requires more pressure than steady-state flow.
For
instance,
conveying 350 Mg/h of oil through the 32.2-km line entails a pressure drop of 55
bars, but startup
will
require a peak pressure of at least 124 bars.
If
for a delivery
pressure of
1
bar the pump can exert 56 bars pressure at most, then this equipment
will deliver 14 Mg/h ofoil throughput at most.
It
is therefore fundamental that,
ifthe
pipeline is to be heated with the oil to be conveyed, the pump must be chosen
so
as to
be able to deliver the peak pressure.
In
order, furthermore, to make startup fast
enough,
it
is desirable that the pump should exceed said peak by 20- 25 percent at
least.
Figure
7.6- I7
further reveals the pressure change to be expected when steady
flow is reduced. Let e.g. the steady throughput through the 24.1-km line be
150 Mg/h, and let us reduce this flow
to
100
Mg/h.
In
the first instants of reduction,
the temperature
of
oil flowing
in
the pipeline will not change; hence, by Eq. 7.6-63,
pressure drop will suddenly decrease by one-third, from 40 to round 27 bars. Owing
tc the lower flow rate, however, the mean oil temperature will gradually decrease
and stabilize at a lower value, while the pressure
loss
climbs to 54 bars.
-
Reducing
the startup or peak pressure may be achieved by several means.
At
a point
somewhere along the pipeline,
a
booster or a heater station or both can be installed.
Let us assume that the operating conditions characterized by
Fig.
7.6
-
I7
prevail
and that a booster-heater station is installed at the middle ofthe 32.2-km line, that is,
at a distance
of
16.1 km from both ends. Ifthe intermediate station is used to heat the
oil to be conveyed to the inflow temperature of the head end (66
"C),
then rhe line
may
be
considered
as
comprising two 16.1-km segments, whose behaviour is
characterized by the lowermost curve
in
Fig.
7.6
-
17.
Peak pressure drop will, then,
be
3
1
bars as opposed to the preceding 124 bars. Even
if
pumping at the intermediate
station is avoided, peak pressure
will
not exceed 2
x
31 =62 bars. Once the line is
7.6.
NON-ISOTHERMAL
OIL
TRANSPORT
249
warmed up, heating at the intermediate station may be ceased (and
so
may
pumping,
if
any). The peak pressure drop to be attained by heating but no pumping
at the intermediate station in the 32.2-km line does not significantly exceed the
pressure drop of conveying
350
Mg/h of oil in steady flow.
If
intermediate heating is
unfeasible, peak pressure may be reduced by intermediate pumping alone.
In
the
32.2-km line, this requires a booster pump of round 70 bars pressure. The booster
station will, in order to halve the pressure differential, be installed not halfway along
the line, but at a distance of about 23 km from the head end.
We have tacitly assumed
so
far that startup is performed by pumping the same
quality crude as is to be conveyed in the steady state. This would, however, often
render startup too slow; other, lower-viscosity liquids are used for startup
in
these
cases, such as a light oil
or
water. Lower viscosity reduces the pressure drop against
what is to be expected with the high-viscosity crude; that is, at the maximum
allowable operating pressure of the pipe, throughput will be higher and heating will
accordingly be faster.
If
the startup liquid is water, heating is accelerated also
because the specific heat ofwater is more than twice that of oil. The drawback of this
method is that, on closing down the line, the pipe has to be flushed with the low-
viscosity liquid, and the transmission of this latter requires a substantial amount of
power. Economy is improved
if
the water can be put to some use at the tail end, or
if
the line must at intervals carry light oil anyway.
The startup pressure can be reduced by electric heating of the pipeline cooled
down (cf. SECT-system in Section 7.6.7).
(b)
The
crude
is
thixotropic-pseudoplastic
Let
us
create a
Ap
pressure difference between the final cross-sectional areas of
gelled crude cylinder being in a horizontal pipe of
di
diameter and
1
length. Due to
this effect, at the inside pipe wall, shear stress
7,
arises and the balance of forces may
be expressed as follows:
and, hence, the prevailing shear stress at the wall is
di
AP
?.=
--
-
'
4
I'
7.6
-
65
The relation is also valid for any
d
diameter value, smaller than
di
,
and thus, by
substituting
di
=
2r, the shear stress on the cylindrical surface of
r
radius is
7.6
-
66
That
is,
the shear stress changes linearly
v.
radius. In the axis of the pipe
it
equals
zero, while at the pipe wall
it
attains the maximum value expressed by Eq. 7.6
-
65.