Stewart J. College Algebra: Concepts and Contexts
Подождите немного. Документ загружается.

T74 ALGEBRA TOOLKIT D
■
Working with Graphs
From the equation: We check whether these ordered pairs satisfy the
equation.
✓
Solution
ⴛ Not a solution
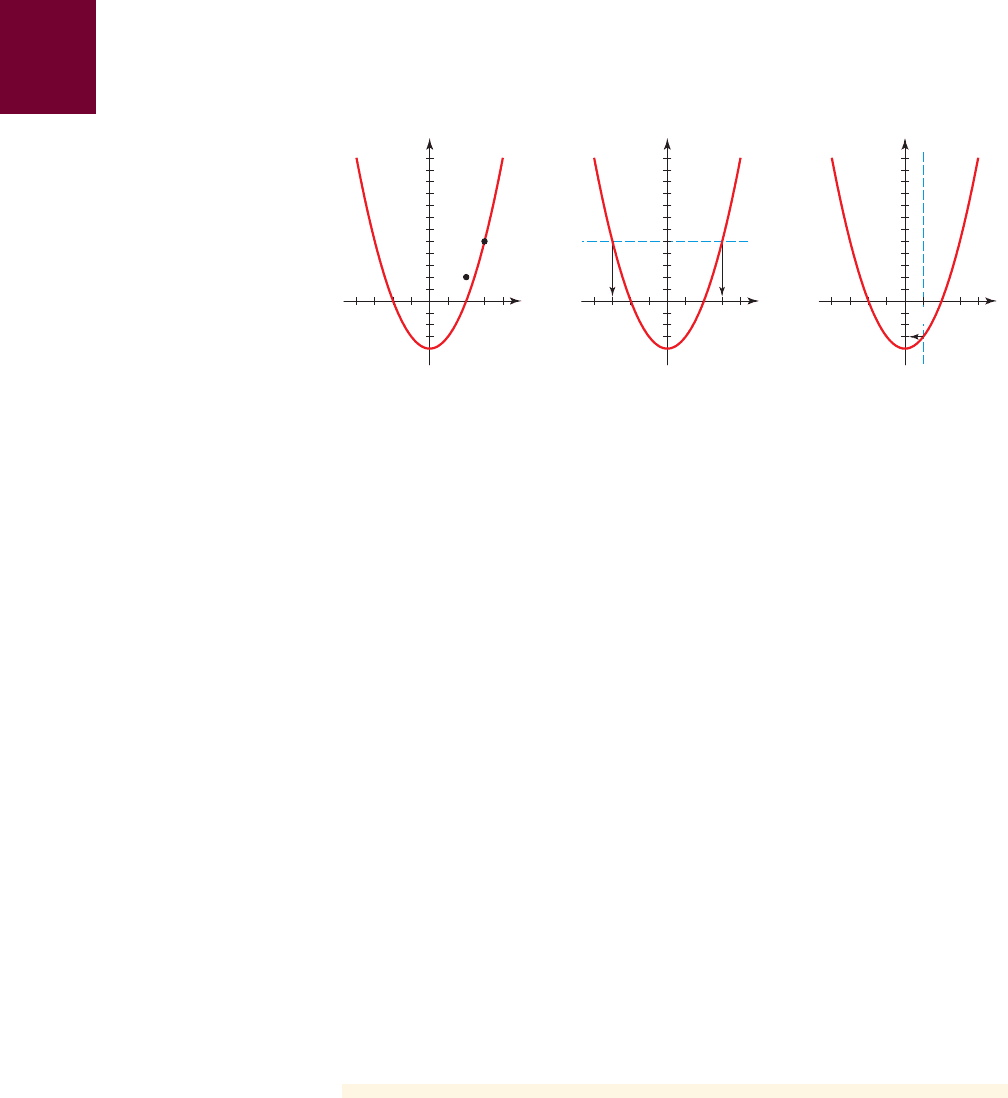
(b) From the graph: We can see that there are two points on the graph with
y-coordinate 5. The x-coordinates of these points are 3 and (see Figure 4(b)).
From the equation: We replace y by 5 and solve for x.
Equation
Replace y by 5
Add 4
Take square root, switch sides
So if y is 5, then x is 3 or .
(c) From the graph: We can see that there is one point on the graph with
x-coordinate 1 (see Figure 4(c)). The y-coordinate of this point is .
From the equation: We replace x by 1 and solve for y.
Equation
Replace x by 1
Calculate
So if x is 1, then y is .
■ NOW TRY EXERCISE 25 ■
Note the difference between an equation, a table of solutions, and a graph of the
equation.
■
The equation gives us a precise relationship between two variables.
■
A table of solutions contains only those solutions we have calculated
(usually just a few). From the equation itself we can obtain all the solutions
(infinitely many).
■
The graph gives us a “picture” of the relationship between the variables in
the equation that we cannot easily see from the equation alone. From the
graph we can “read” solutions of the equation.
- 3
y =-3
y = 1
2
- 4
y = x
2
- 4
- 3
- 3
x = ; 3
9 = x
2
5 = x
2
- 4
y = x
2
- 4
- 3
12, 2 2 2 = 2
2
- 4
13, 5 2 5 = 3
2
- 4
y
x
2
0
1
y
x
y=5
2
0
1
y
x
x=1
2
0
1
(b)(a) (c)
figure 4
SECTION D.2
■
Graphs of Two-Variable Equations T75
2
■ Finding Intercepts
The x-coordinates of the points where a graph of an equation intersects the x-axis
are the x-intercepts of the graph and are obtained by setting in the equation. The
y-coordinates of the points where a graph of an equation intersects the y-axis are
the y-intercepts of the graph and are obtained by setting in the equation.
The x- and y-Intercepts
x = 0
y = 0
So the equation, a table of solutions, and the graph all work together to help us un-
derstand how the variables are related.
Intercepts From the equation From the graph
x-intercepts: The Set and solve
x-coordinates of the for x
points where the graph
intersects the x-axis
y-intercepts: The Set and solve
y-coordinates of the for y
points where the graph
intersects the y-axis
x = 0
y = 0
y
x
0
y
x
0
example
4
Finding Intercepts
Find the x- and y-intercepts of the graph of the equation .
Solution
To find the x-intercepts from the equation, we set and solve for x.
Equation
Set
Add 2 and switch sides
Take the square root
The x-intercepts are and . To find the y-intercepts, we set and solve
for y.
Equation
Set
Simplify
The y-intercept is . The graph of this equation is sketched in Figure 5 with the
x- and y-intercepts labeled.
■ NOW TRY EXERCISE 31 ■
- 2
y =-2
x = 0 y = 0
2
- 2
y = x
2
- 2
x = 0- 1212
x = ; 12
x
2
= 2
y = 0 0 = x
2
- 2
y = x
2
- 2
y = 0
y = x
2
- 2
y
x
2_2
0
_2
2
y=≈-2
y-intercept
x-intercepts
figure 5
T76 ALGEBRA TOOLKIT D
■
Working with Graphs
2
■ Equations of Circles
So far, we have discussed how to find the graph of an equation in x and y. The con-
verse problem is to find an equation of a graph, that is, an equation that represents a
given curve in the xy-plane. As an example of this type of problem, let’s find the
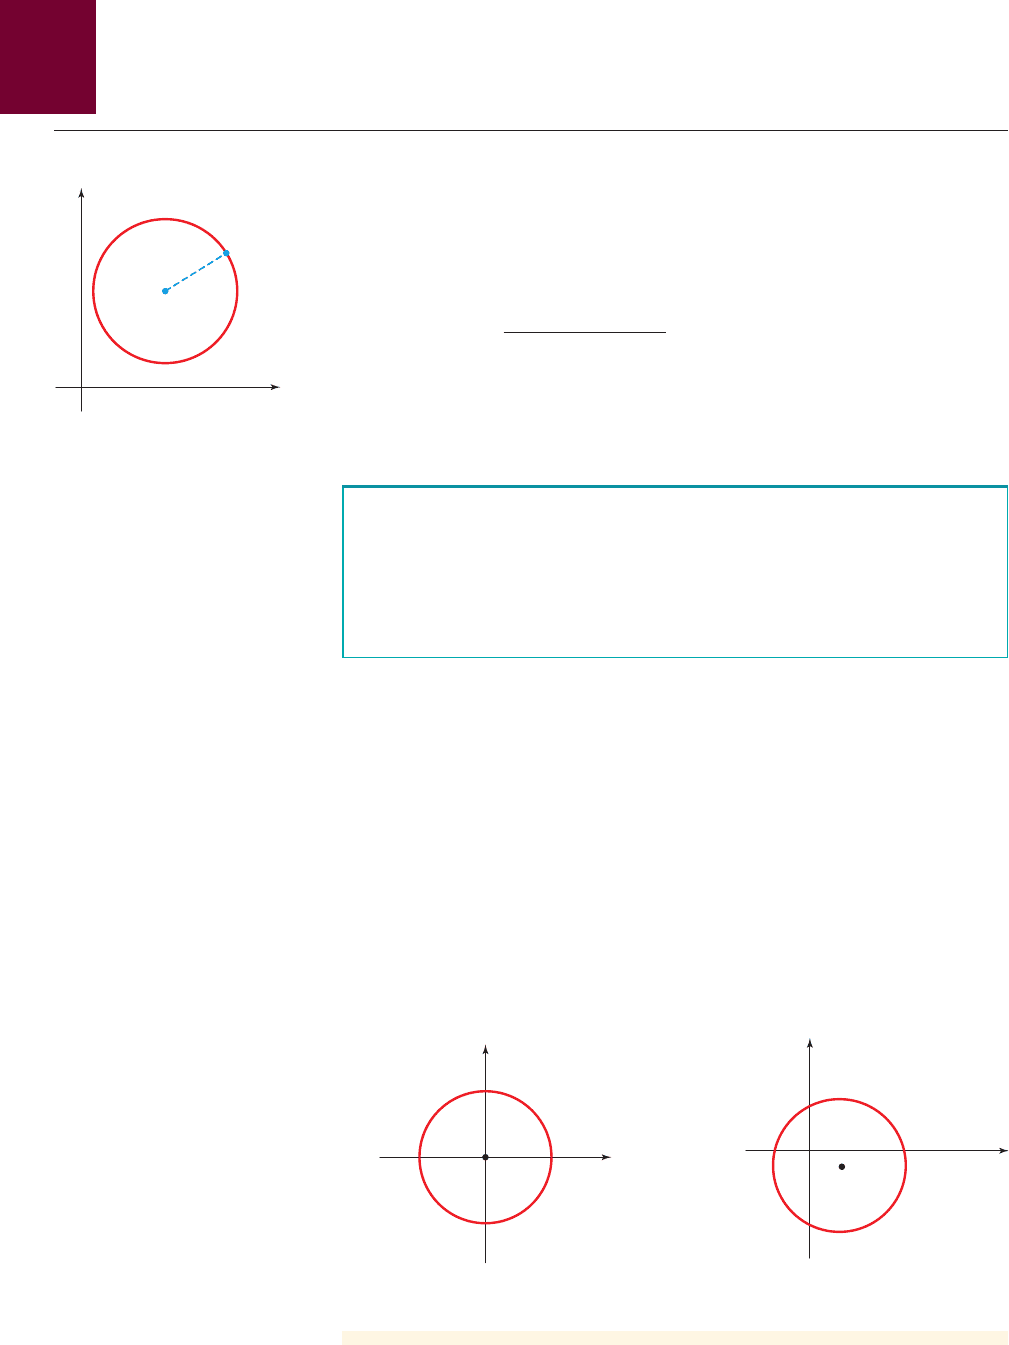
equation of a circle with radius r and center (h, k). By definition, the circle is the set
of all points P(x, y) whose distance from the center C(h, k) is r (see Figure 6). Thus,
P is on the circle if and only if . From the Distance Formula we have
Square each side
This is the equation of the circle.
Equation of a Circle
1x - h2
2
+ 1y - k2
2
= r
2
21x - h 2
2
+ 1y - k2
2
= r
d1P, C 2= r
example
5
Graphing a Circle
Graph each equation.
(a)
(b)
Solution
(a) Rewriting the equation as , we see that this is an equation of the
circle of radius 5 centered at the origin. Its graph is shown in Figure 7.
(b) Rewriting the equation as , we see that this is an
equation of the circle of radius 5 centered at . Its graph is shown in
Figure 8.
12, - 12
1x - 2 2
2
+ 1y - 1- 122
2
= 5
2
x
2
+ y
2
= 5
2
1x - 2 2
2
+ 1y + 12
2
= 25
x
2
+ y
2
= 25
r
y
x
0
C(h, k)
P(x, y)
figure 6
5
5
y
x
≈+¥=25
0
figure 7
(2, _1)
y
x
(x-2)™+(y+1)™=25
0
figure 8
An equation of the circle with center (h, k) and radius r is
If the center of the circle is the origin (0, 0), then the equation is
x
2
+ y
2
= r
2
1x - h 2
2
+ 1y - k2
2
= r
2
This form of the equation of a circle
is called the standard form.
■ NOW TRY EXERCISES 35 AND 39 ■

SECTION D.2
■
Graphs of Two-Variable Equations T77
example
6
Finding an Equation of a Circle
Find an equation of the circle with radius 3 and center .
Solution
Using the equation of a circle with , , and , we get
Equation of circle
Replace h by 2, k by , r by 3
This is the equation of the circle we want.
■ NOW TRY EXERCISE 41 ■
If we expand the equation of the circle in Example 6, we get
From this form of the equation we can’t quickly find the center and radius. To put
the equation back into standard form, we need to complete the square as described
in the next example.
x
2
- 4x + y
2
+ 2y = 4
- 1 1x - 22
2
+ 1y + 12
2
= 3
2
1x - h2
2
+ 1y - k2
2
= r
2
k =-1h = 2r = 3
12, - 12
example
7
Identifying an Equation of a Circle
Show that the equation represents a circle, and find the
center and radius of the circle.
Solution
We first group the x-terms and y-terms. Then we complete the square within each
grouping. That is, we complete the square for by adding , and we
complete the square for by adding .
Given equation
Group terms
Complete the squares
Factor and simplify
Comparing this equation with the standard equation of a circle, we see that ,
, and , so the given equation represents a circle with center and
radius .
■ NOW TRY EXERCISE 45 ■
13
1- 1, 32r
2
= 3k = 3
h =-1
1x + 12
2
+ 1y - 32
2
= 3
1x
2
+ 2x + 12+ 1y
2
- 6y + 92=-7 + 1 + 9
1x
2
+ 2x 2+ 1y
2
- 6y 2=-7
x
2
+ y
2
+ 2x - 6y + 7 = 0
3
1
2
#
1- 624
2
= 9y
2
- 6x
A
1
2
#
2B
2
= 1x
2
+ 2x
x
2
+ y
2
+ 2x - 6y + 7 = 0
D.2 Exercises
CONCEPTS
1. If the point (3, 2) is a solution of an equation in x and y, then the equation is satisfied
when we replace x by
_______ and y by _______. Is the point (3, 2) a solution of the
equation ?
2. If the point (1, 2) is on the graph of an equation in x and y, then the equation is satisfied
when we replace x by
_______ and y by _______. Is the point (1, 2) on the graph of
the equation ?2x - 5y = 8
2y = x + 1
T78 ALGEBRA TOOLKIT D
■
Working with Graphs
x y
0
3
1
2
3
4
5
6
x y
0
- 4
1
2
3
4
5
6
x y
- 3
9
- 2
- 1
0
1
2
3
x y
- 3 - 27
- 2
- 1
0
1
2
3
3. (a) To find the x-intercept(s) of the graph of an equation, we set _______ equal to 0 and
solve for
_______. So the x-intercept(s) of the graph of is _______.
(b) To find the y-intercept(s) of the graph of an equation, we set
_______ equal to 0
and solve for
_______. So the y-intercept(s) of is _______.
4. The graph of the equation is a circle with center (
____, ____)
and radius
_______.
5–8
■ An equation is given.
(a) Give a verbal description of the relationship between the variables in the equation.
(b) Determine whether the given point (x, y) is on the graph of the equation.
5. 6.
7. 8.
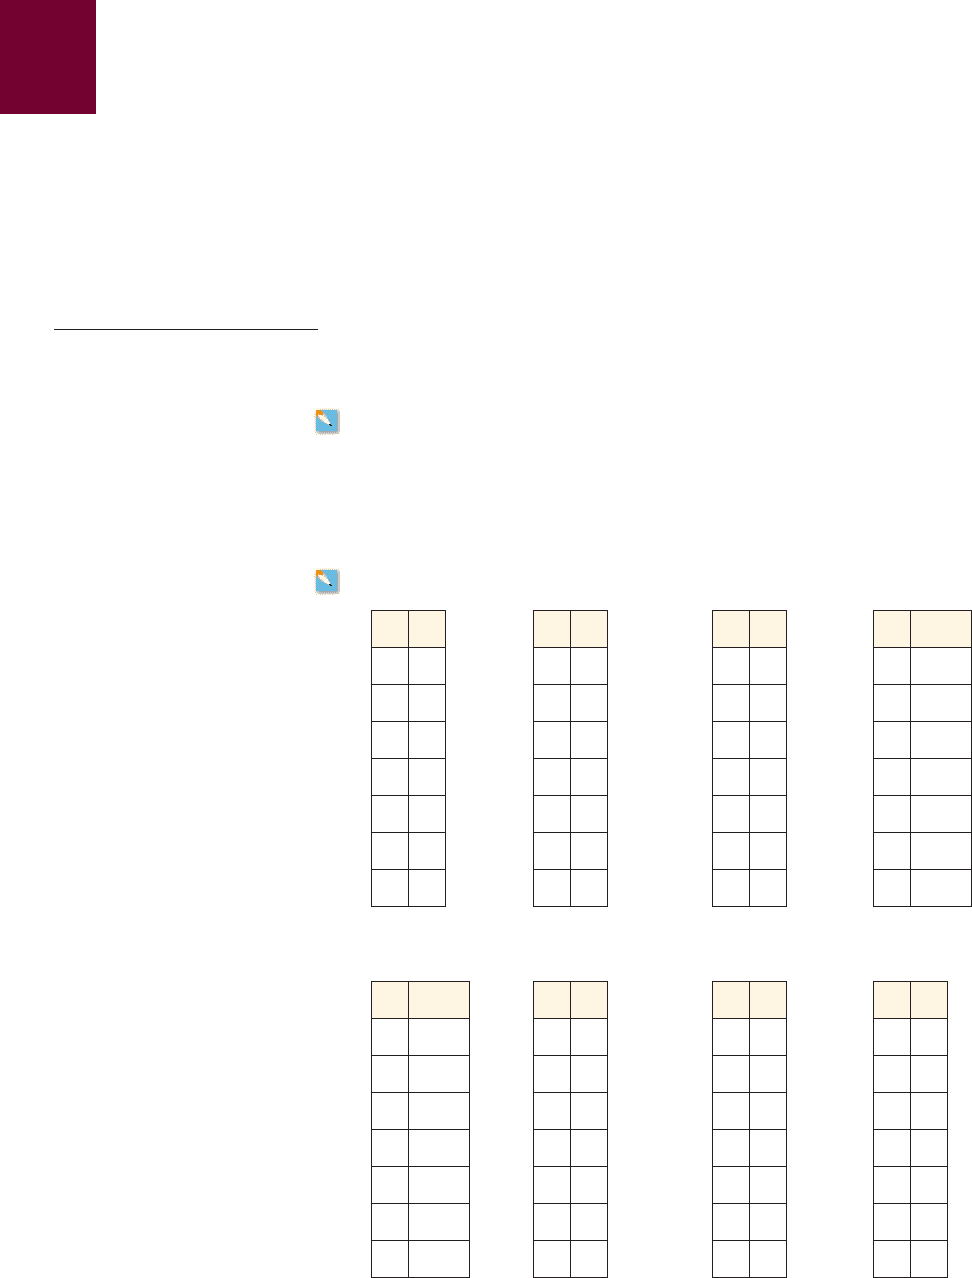
9–16
■ An equation is given.
(a) Complete the table of solutions.
(b) Draw a graph of the equation.
9. 10. 11. 12. y = x
3
y = x
2
y =-4 + 5xy = 3 - 2x
3x + y
2
- 2y = 0;1- 1, 32y
3
- 2x = 5;111, 32
x + y
2
= 6;13, - 32x - y = 7;13, 10 2
1x - 12
2
+ 1y - 22
2
= 9
2y = x + 1
2y = x + 1
SKILLS
x y
- 3 - 30
- 2
- 1
0
1
2
3
x y
- 3
12
- 2
- 1
0
1
2
3
x y
- 3
6
- 2
- 1
0
1
2
3
x y
0
3
1
2
3
4
5
6
13. 14. 15. 16. y = 0
3 - x 0y = 0 x 0+ 3y = x
2
+ 3y = x
3
- 3
SECTION D.2
■
Graphs of Two-Variable Equations T79
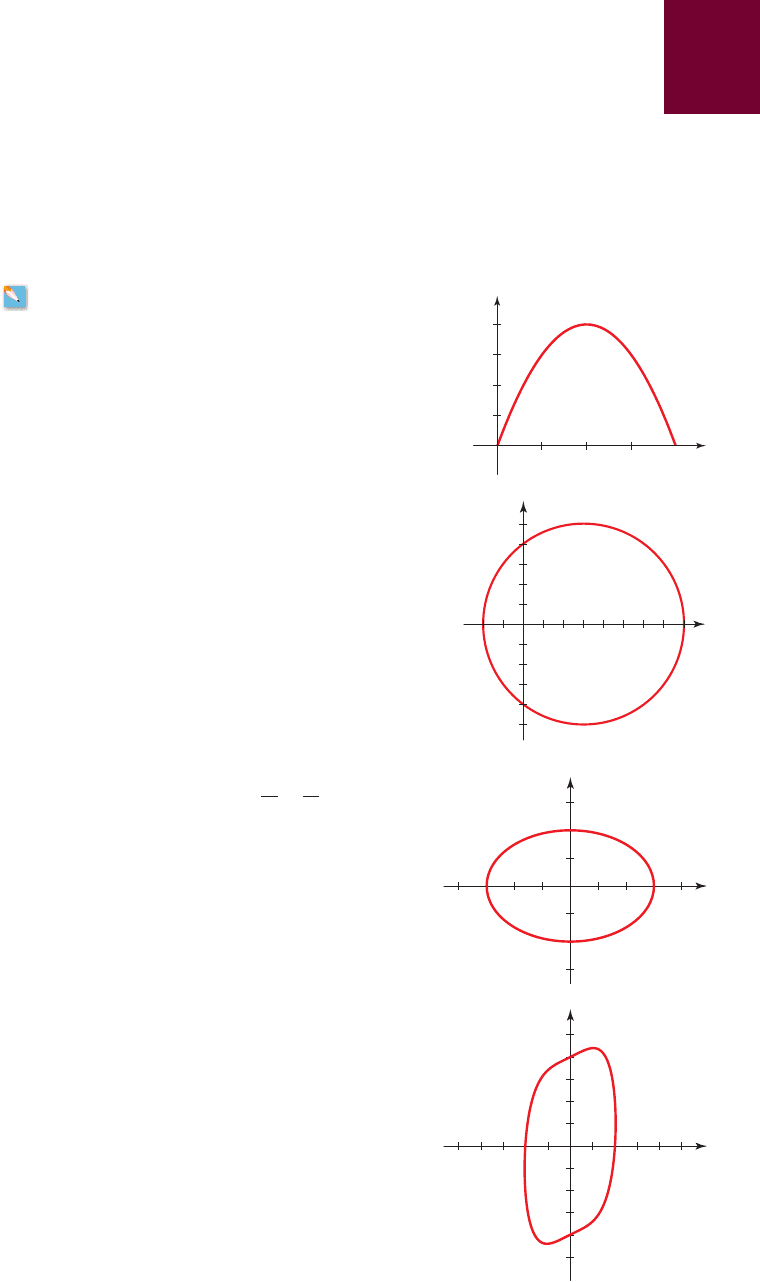
17–24 ■ Draw a graph of the equation.
17. 18.
19. 20.
21. 22.
23. 24.
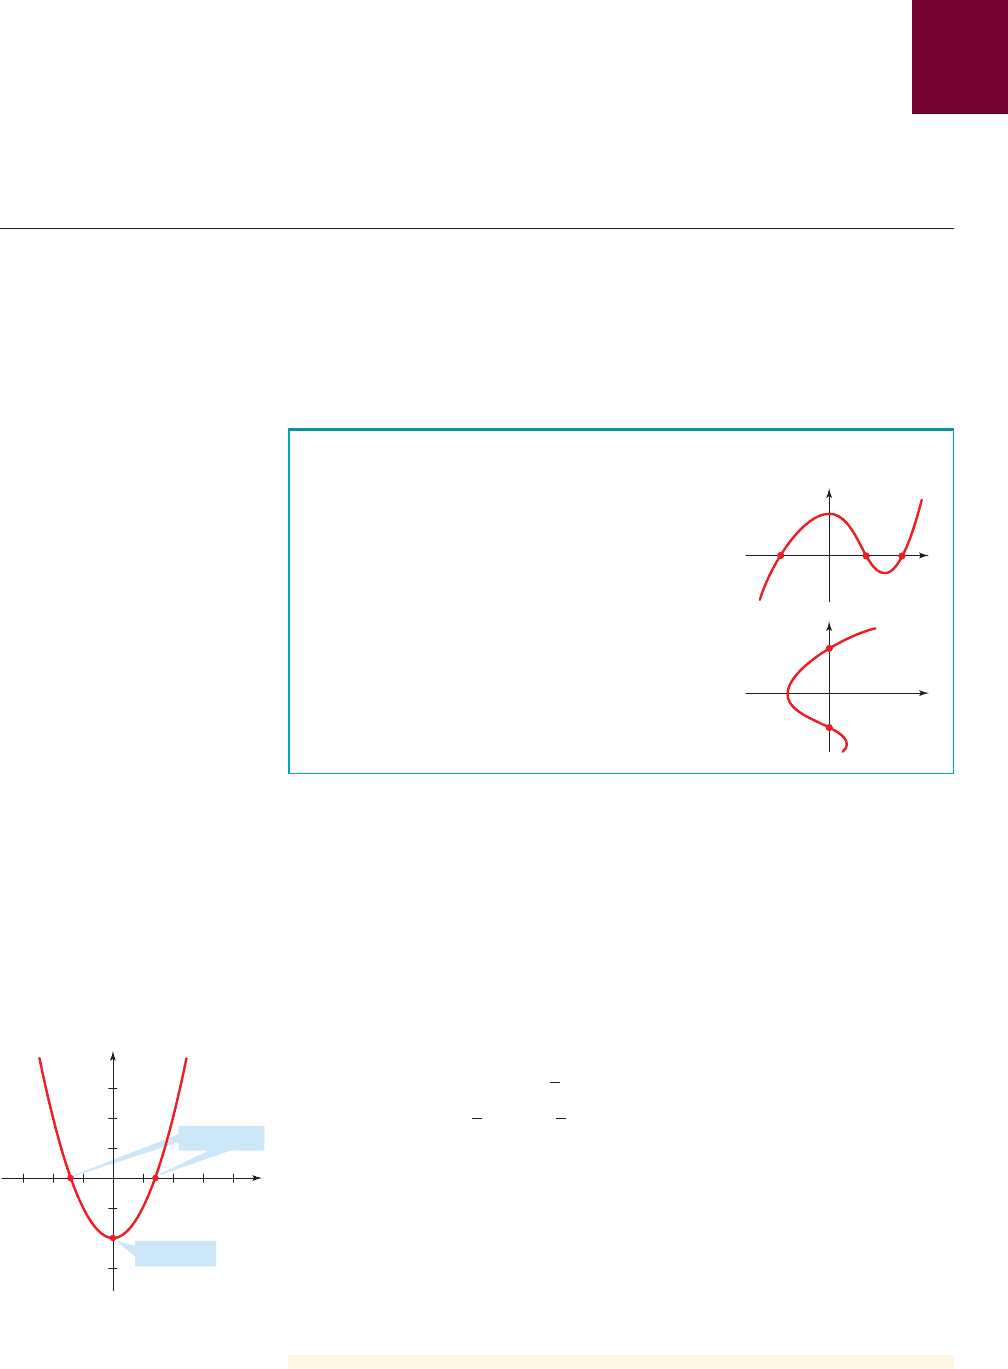
25. The graph of the equation is given for
values of x between 0 and 4. Use the graph to answer
the following questions.
(a) What is the value of y when ?
(b) For what value(s) of x is ?
(c) What are the x- and y-intercepts?
26. The graph of the equation is
given. Use the graph to answer the following
questions.
(a) For what value(s) of y is ?
(b) For what value(s) of x is ?
(c) For what value(s) of x is ?
(d) What are the x- and y-intercepts?
27. The graph of the equation is given.
Find the x- and y-intercepts as follows.
(a) From the graph
(b) From the equation
28. The graph of the equation
is given. Find the x- and y-intercepts as follows.
(a) From the graph
(b) From the equation
x
4
+ y
2
- xy = 16
x
2
9
+
y
2
4
= 1
y = 5
y = 3
x = 6
1x - 32
2
+ y
2
= 25
y = 3
x = 2
y = 4x - x
2
y = 0 x 0+ 1y = x
2
+ 1
y = 1x + 1 2
2
y = 2x - 6
y =-x
2
y = 2x
2
y = 2xy =-x
y
x
0
1
1
234
2
3
4
2
2
0
x
y
1
1
0
x
y
2
1
0
x
y
T80 ALGEBRA TOOLKIT D
■
Working with Graphs
29–34
■ Find the x- and y-intercepts of the graph of the equation.
29. 30.
31. 32.
33. 34.
35–40
■ Find the center and radius of the circle, and sketch its graph.
35. 36.
37. 38.
39. 40.
41–42
■ Find an equation of the circle that satisfies the given conditions.
41. Center 42. Center
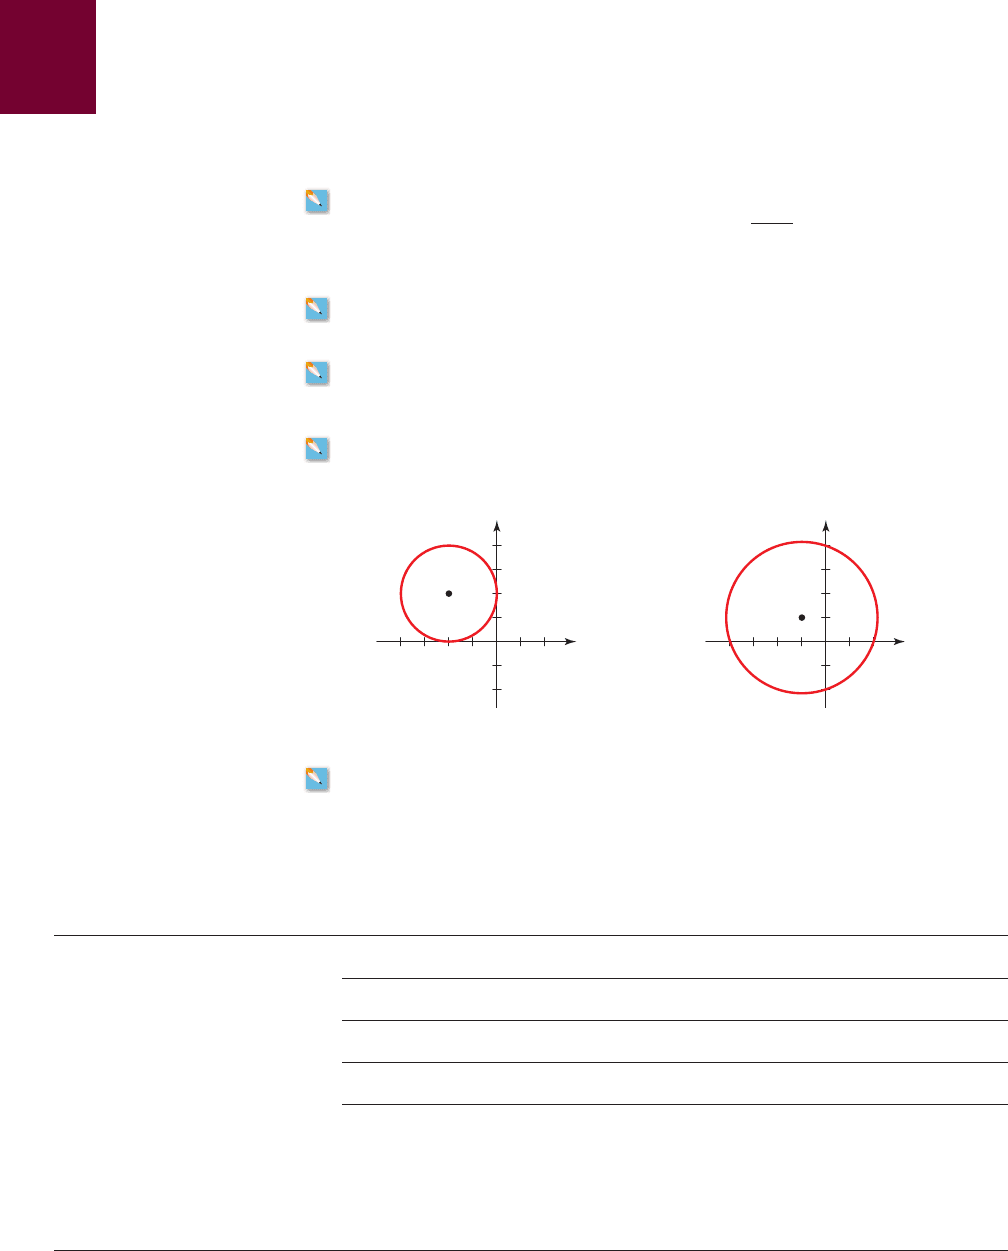
43–44
■ Find the equation of the circle shown in the figure.
43. 44.
1- 1, - 42;
radius 812, - 12;radius 3
1x + 12
2
+ 1y + 22
2
= 361x + 32
2
+ 1y - 42
2
= 25
x
2
+ 1y - 22
2
= 41x - 32
2
+ y
2
= 16
x
2
+ y
2
= 5x
2
+ y
2
= 9
y = 1x + 1
x
2
+ y
2
= 4
y - 2xy + 2x = 1y = x
2
- 9
y = x
2
- 5x + 6y = x - 3
x
y
0
2
2_2
x
y
0
2
2_2
45–48 ■ Show that the equation represents a circle, and find the center and radius of the circle.
45. 46.
47. 48. x
2
+ y
2
+ 6y + 2 = 0x
2
+ y
2
- 4x + 10y + 13 = 0
x
2
+ y
2
- 2x - 2y = 2x
2
+ y
2
- 2x + 4y + 1 = 0
2
D.3 Using a Graphing Calculator
■
Choosing a Viewing Rectangle
■
Two Graphs on the Same Screen
■
Avoiding Extraneous Lines
■
Graphing a Circle
Graphing calculators and computers provide us with the ability to quickly obtain the
graph of an equation. In this section we give a few guidelines to help us use graph-
ing devices effectively.
2
■ Choosing a Viewing Rectangle
A graphing device displays a rectangular portion of the graph of an equation in a dis-
play window or viewing screen, which we call a viewing rectangle. The default
screen often gives an incomplete or misleading picture of the graph, so we must
SECTION D.3
■
Using a Graphing Calculator T81
choose this rectangle carefully. To do this, we choose minimum and maximum val-
ues for x, called Xmin and Xmax, and minimum and maximum values for y, called
Ymin and Ymax. For example, to obtain the viewing rectangle in Figure 1, we choose
Xmin Ymin
Xmax Ymax
The calculator displays the portion of the graph for the x-values in the interval
and y-values in the interval , so we describe this as the
viewing rectangle.
The graphing device produces the graph of an equation in much the same way
as you would. It plots the points (x, y) for many values of x that are equally spaced
between
Xmin and Xmax. The machine then connects each point to the preceding
plotted point to form a representation of the graph of the equation. If the equation is
not defined for an x-value or if the corresponding y-value lies outside the viewing
rectangle, the device ignores this value and moves on to the next x-value. The next
example illustrates this process.
3- 10, 104
by3- 5, 304
3- 5, 3043- 10, 104
= 30= 10
=-5=-10
30
_5
_10
10
figure 1 The by
viewing rectangle.3- 5, 30 4
3- 10, 104
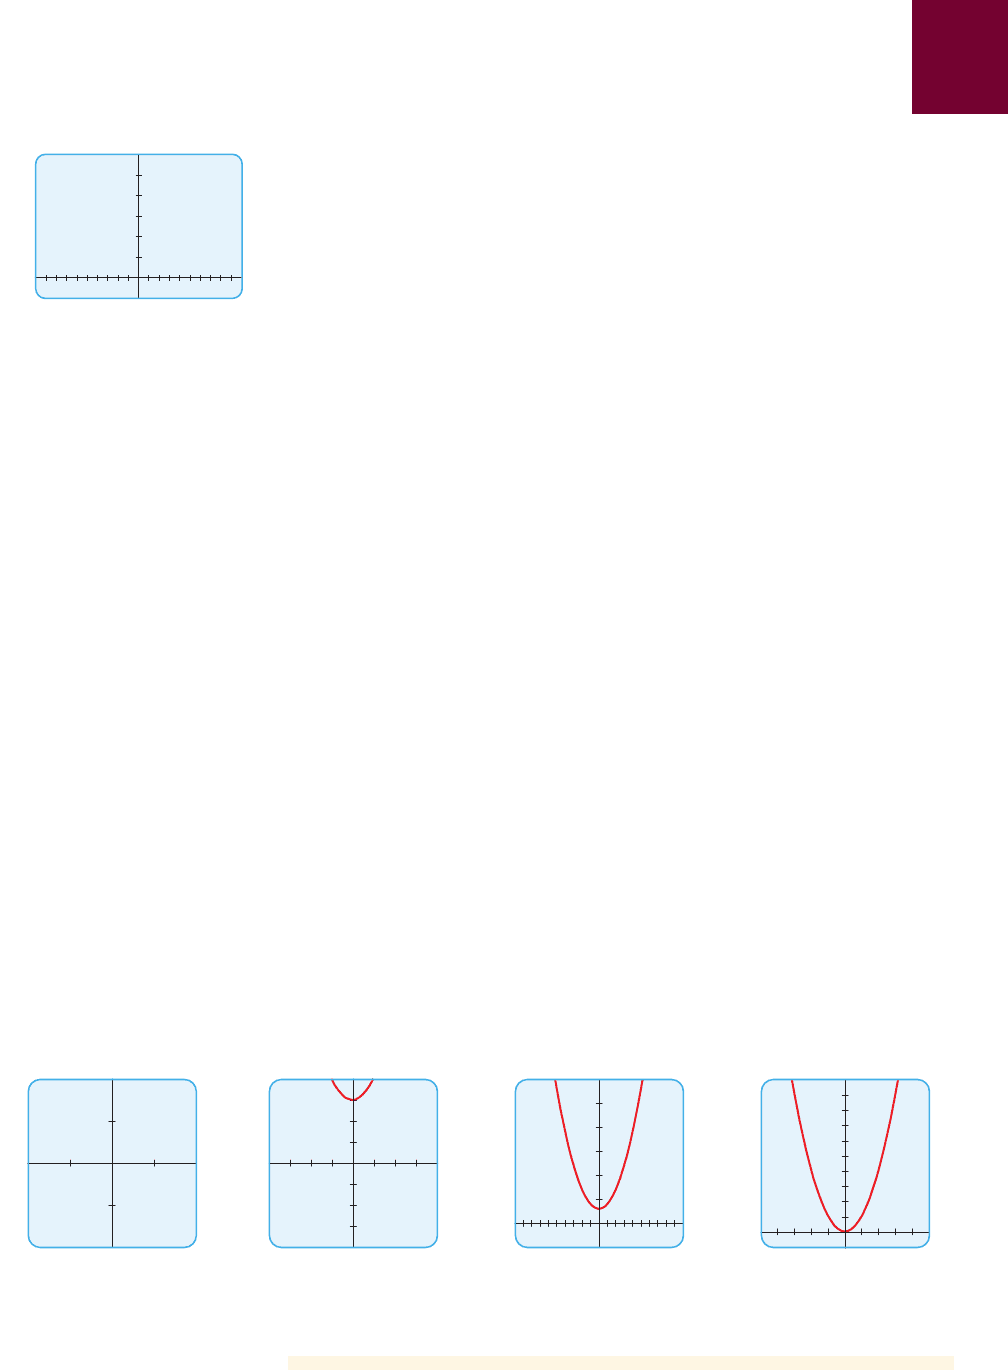
example
1
Choosing an Appropriate Viewing Rectangle
Graph the equation in an appropriate viewing rectangle.
Solution
Let’s experiment with different viewing rectangles. We start with the viewing rect-
angle by , so we set
Xmin Ymin
Xmax Ymax
The resulting graph in Figure 2(a) is blank! This is because , so
for all x. Thus, the graph lies entirely above the viewing rectangle, so this viewing
rectangle is not appropriate. If we enlarge the viewing rectangle to by
as in Figure 2(b), we begin to see a portion of the graph.
Now let’s try the viewing rectangle by . The graph in Figure 2(c)
seems to give a more complete view of the graph. If we enlarge the viewing rectangle
even further, as in Figure 2(d), the graph doesn’t show clearly that the y-intercept is 3.
So the viewing rectangle by gives an appropriate represen-
tation of the graph.
3- 5, 3043- 10, 104
3- 5, 3043- 10, 104
3- 4, 44
3- 4, 44
x
2
+ 3 Ú 3x
2
Ú 0
= 2= 2
=-2=-2
3- 2, 243- 2, 24
y = x
2
+ 3
(a) (b) (c) (d)
4
_4
_4 4
2
_2
_2 2
30
_5
_10 10
1000
_100
_50 50
figure 2 Graphs of y = x
2
+ 3
■ NOW TRY EXERCISES 3 AND 9 ■
T82 ALGEBRA TOOLKIT D
■
Working with Graphs
You can see from Example 1 that the choice of a viewing rectangle makes a big
difference in the appearance of a graph. If you want an overview of the essential fea-
tures of a graph, you must choose a relatively large viewing rectangle to obtain a
global view of the graph. If you want to investigate the details of a graph, you must
zoom in to a small viewing rectangle that shows just the feature of interest.
2
■ Two Graphs on the Same Screen
One of the most useful features of a graphing calculator is the ability to draw more
than one graph on the same screen. This allows us to more easily compare graphs
and to find where two graphs intersect. But there are pitfalls to avoid here also, as
the next example illustrates.
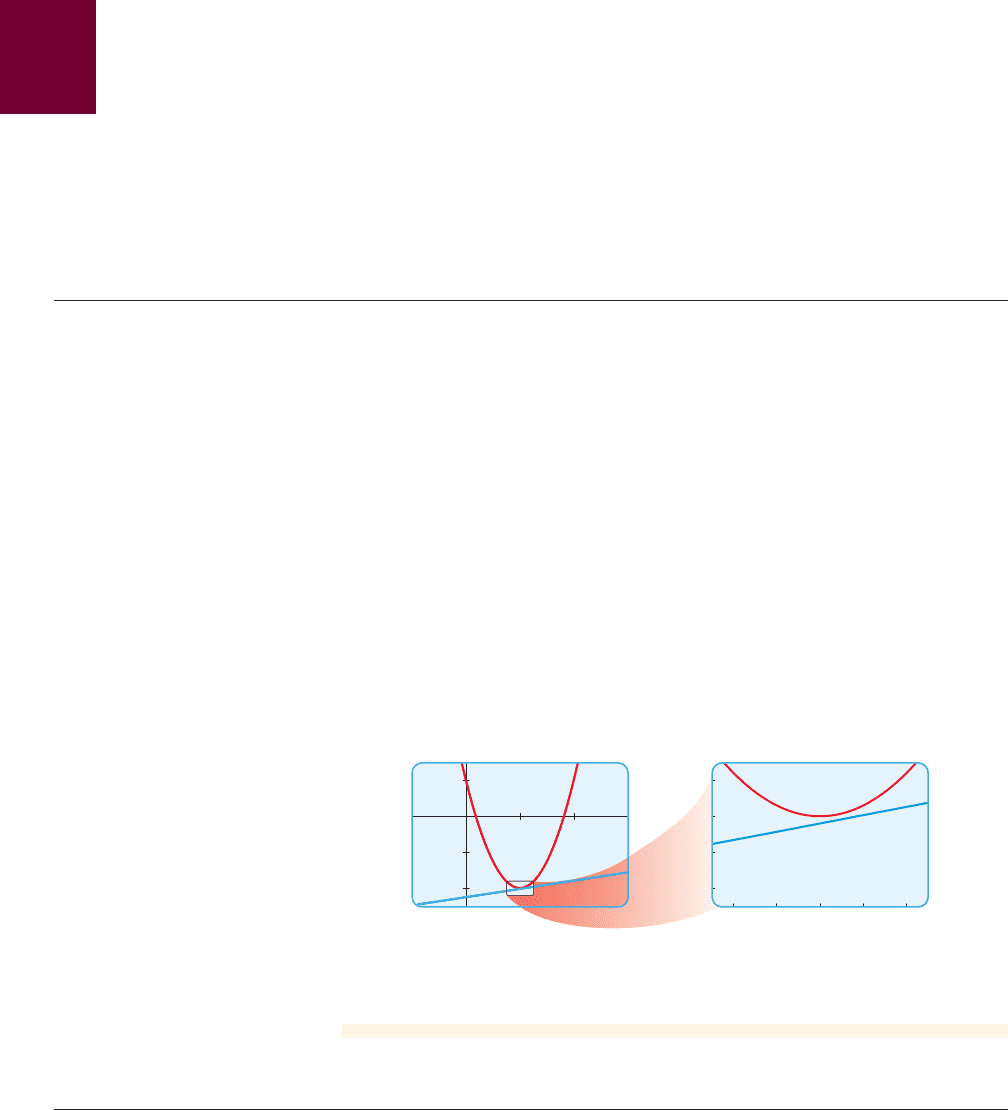
example
2
Two Graphs on the Same Screen
Graph the equations and together in the viewing
rectangle by . Do the graphs intersect in this viewing rectangle?
Solution
Figure 3(a) shows the essential features of both graphs. One is a parabola, and the
other is a line. It looks as if the graphs intersect near the point . However, if
we zoom in on the area around this point as shown in Figure 3(b), we see that al-
though the graphs almost touch, they do not actually intersect.
11, - 22
3- 2.5, 1.543- 1, 34
y = 0.23x - 2.25y = 3x
2
- 6x + 1
1.5
_2.5
_1 3
(
a
)
_1.85
_2.25
0.75 1.25
(
b
)
figure 3 Zooming in on part of the graph
■ NOW TRY EXERCISE 17 ■
2
■ Avoiding Extraneous Lines
We have already discovered one of the pitfalls of using graphing calculators and
computers: Examples 1 and 2 showed that the use of an inappropriate viewing
rectangle can give a misleading representation of the graph of an equation. We
also saw how to remedy the situation: We included the crucial parts of the graph
by changing to a larger viewing rectangle. Another pitfall is illustrated in the next
example.
SECTION D.3
■
Using a Graphing Calculator T83
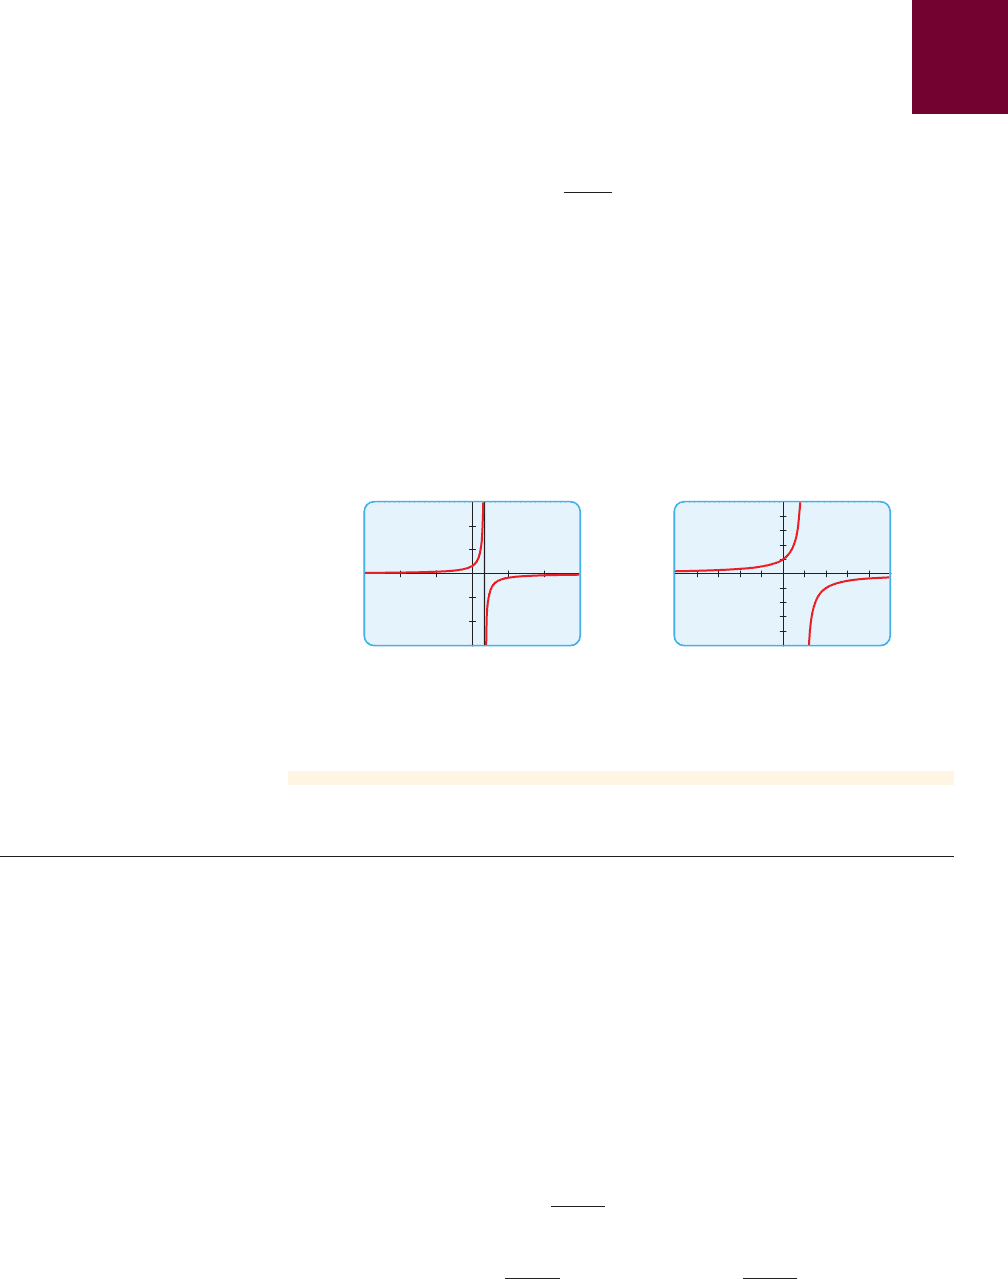
example
3
Avoiding Extraneous Lines in Graphs
Draw a graph of the equation .
Solution
Figure 4(a) shows the graph produced by a graphing calculator with viewing rectan-
gle by . In connecting successive points on the graph, the calculator
produced a steep line segment from the top to the bottom of the screen. That line seg-
ment should not be part of the graph. Notice that the right-hand side of the equation
is not defined when x is 1. Sometimes we can get rid of the extraneous
near-vertical line by experimenting with a change of scale. Here, for example, when
we change to the smaller viewing rectangle by , we obtain the much
better graph in Figure 4(b).
3- 5, 543- 5, 54
y = 1>11 - x2
3- 9, 943- 9, 94
y =
1
1 - x
5
_5
_5 5
9
_9
_9 9
(a) (b)
figure 4 Graphs of y = 1>11 - x2
■ NOW TRY EXERCISE 15 ■
2
■ Graphing a Circle
Most graphing calculators can only graph equations in which the variable y is iso-
lated on one side of the equal sign. The next example shows how to graph equations
that don’t have this property.
example
4
Graphing a Circle
Graph the circle .
Solution
We first solve for y to isolate it on one side of the equal sign.
Subtract
Take square root
Therefore, the circle is described by the graphs of two equations:
y = 21 - x
2
andy =-21 - x
2
y = ; 21 - x
2
x
2
y
2
= 1 - x
2
x
2
+ y
2
= 1