Russ J.C. Image Analysis of Food Microstructure
Подождите немного. Документ загружается.

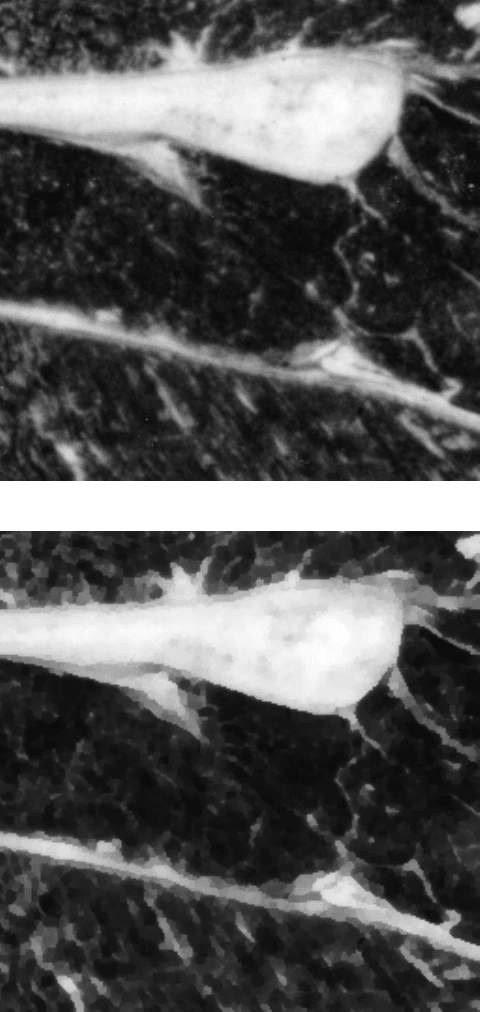
(a)
(b)
FIGURE 3.27
Application of a maximum likelihood filter to the beef image from Figure
3.6(a) (detail enlarged to show individual pixels): (a) original; (b) processed.
2241_C03.fm Page 155 Thursday, April 28, 2005 10:28 AM
Copyright © 2005 CRC Press LLC
TEXTURE
Many structures are not distinguished from each other or from the surrounding
background by a difference in brightness or color, nor by a distinct boundary line
of separation. Yet visually they may be easily distinguished by a texture. This use
of the word “texture” may initially be confusing to food scientists who use it to
describe physical and sensory aspects of food; it is used in image analysis as a way
to describe the visual appearance of irregularities or variations in the image, which
may be related to structure. Texture does not have a simple or unique mathematical
definition, but refers in general terms to a characteristic variability in brightness (or
color) that may exist at very local scales, or vary in a predictable way with distance
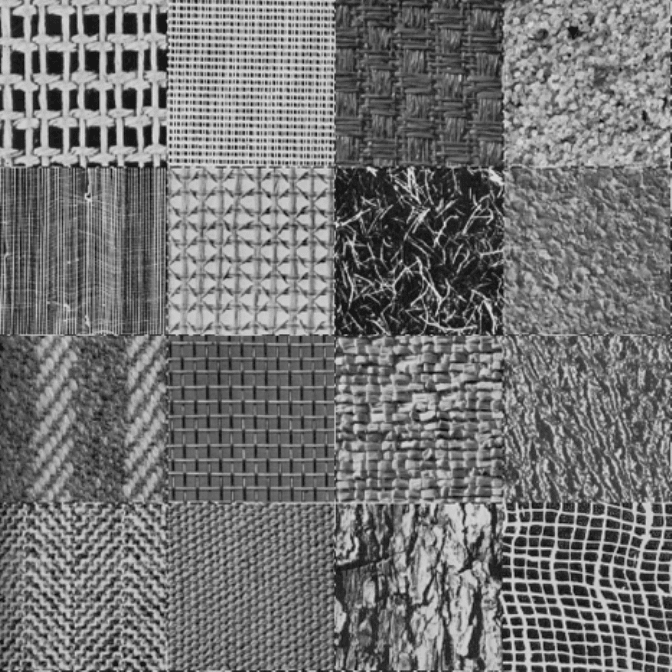
or direction. Examples of a few visually different textures are shown in Figure 3.28.
These come from a book (P. Brodatz,
Textures: A Photographic Album for Artists
and Designers
, Dover Publications, New York, 1966) that presented a variety of
visual textures, which have subsequently been widely distributed via the Internet
and are used in many image processing examples of texture recognition.
Just as there are many different ways that texture can occur, so there are different
image processing tools that respond to it. Once the human viewer has determined
that texture is the distinguishing characteristic corresponding to the structural dif-
ferences that are to be enhanced or measured, selecting the appropriate tool to apply
to the image is often a matter of experience or trial-and-error. The goal is typically
to convert the textural difference to a difference in brightness that can be thresholded.
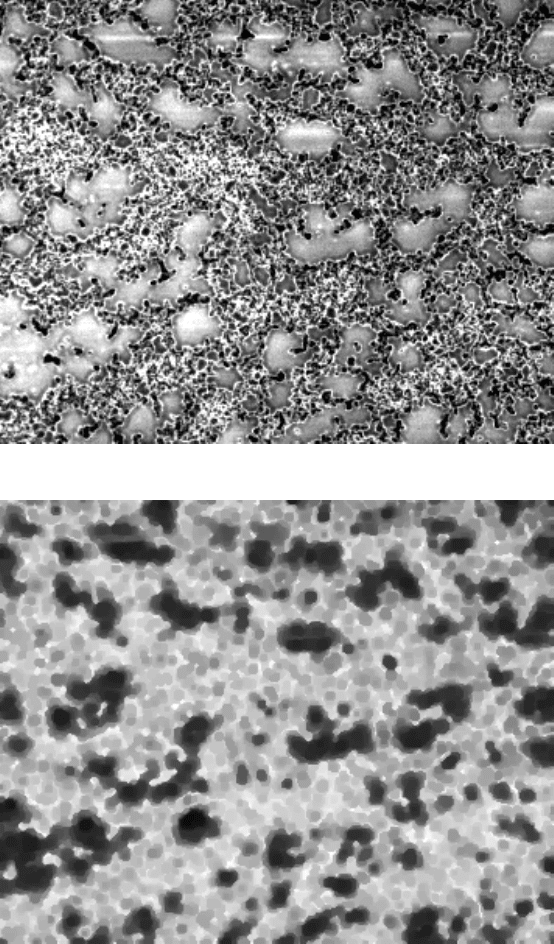
Figure 3.29 illustrates one of the simplest texture filters. The original image is
a light micrograph of a thin section of fat in cheese, showing considerable variation
in brightness from side to side (the result of varying slice thickness). Visually, the
smooth areas (fat) are easily distinguished from the highly textured protein network
around them, but there is no unique brightness value associated with the fat regions,
and they cannot be thresholded to separate them from the background for measure-
ment. The range operator, which was used above as an edge detector, can also be
useful for detecting texture. Instead of using a very small neighborhood to localize
the edge, a large enough region must be used to encompass the scale of the texture
(so that both light and dark regions will be covered). In the example, a neighborhood
radius of at least 2.5 pixels is sufficient.
Many of the texture-detecting filters were originally developed for the applica-
tion of identifying different fields of planted crops in aerial photographs or satellite
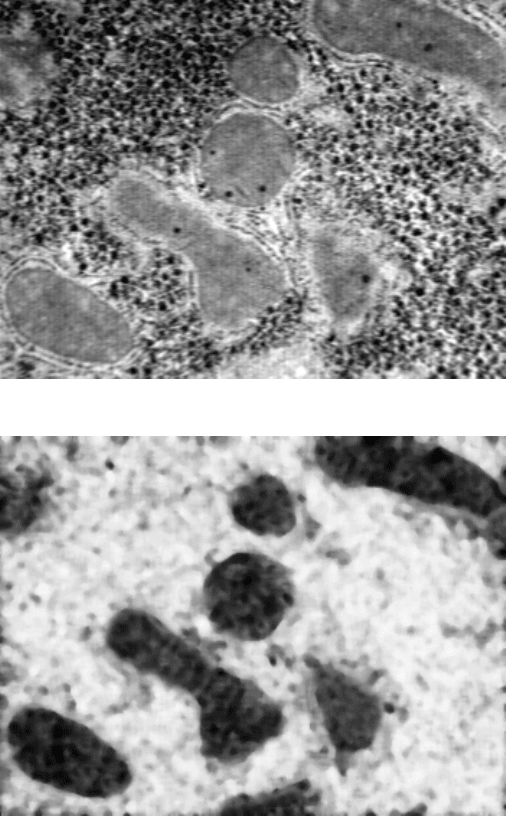
images, but they work equally well when applied to microscope images. In Figure
3.30 a calculation of the local entropy isolates the mitochondria in a TEM image of
liver tissue.
Probably the most calculation-intensive texture operator in widespread use deter-
mines the local fractal dimension of the image brightness. This requires, for every
pixel in the image, constructing a plot of the range (difference between brightest
and darkest pixels) as a function of the radius of the neighborhood, out to a radius
of about 7 pixels. Plotted on log-log axes, this often shows a linear increase in
contrast with neighborhood size. Performing least-squares regression to determine
2241_C03.fm Page 156 Thursday, April 28, 2005 10:28 AM
Copyright © 2005 CRC Press LLC
the slope and intercept of the relationship measures the fractal parameters of the
image contrast (for a range image, as would be acquired from an AFM, it is the
actual surface fractal dimension; for an image in which the brightness is a function
of slope, as in the SEM, it is equal to the actual surface dimension plus a constant).
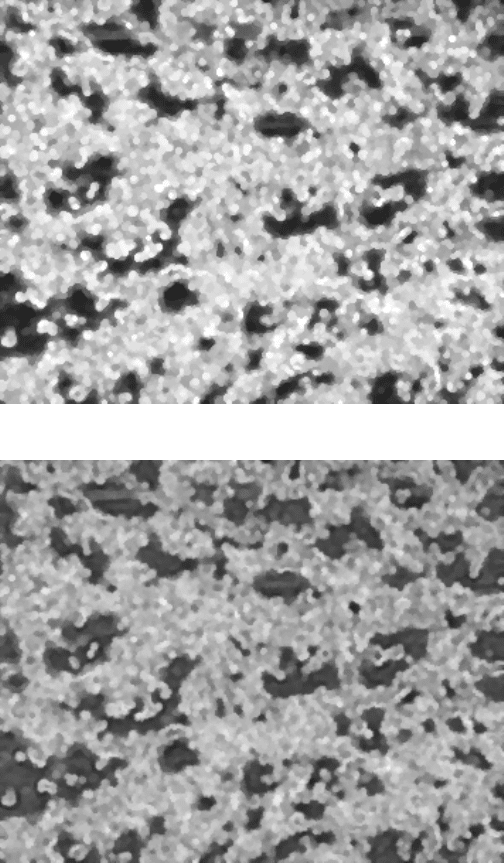
As shown in the example of Figure 3.31, these parameters also convert the
original image in which texture is the distinguishing feature to one in which bright-
ness can be used for thresholding. The fractal texture has the advantage that it does
not depend on any specific distance scale to encompass the bright and dark pixels
that make up the texture. It is also particularly useful because so many structures in
the real world are naturally fractal that human vision has apparently evolved to
recognize that characteristic, and many visually discerned textures have a fractal
mathematical relationship.
FIGURE 3.28
A selection of the Brodatz textures, which are characterized by variations in
brightness with distance and direction.
2241_C03.fm Page 157 Thursday, April 28, 2005 10:28 AM
Copyright © 2005 CRC Press LLC
(a)
(b)
FIGURE 3.29
Thresholding the fat in cheese: (a) original image; (b) texture converted to a
brightness difference using the range operator; (c) the fat regions outlined (using an automatic
thresholding procedure as described subsequently).
2241_C03.fm Page 158 Thursday, April 28, 2005 10:28 AM
Copyright © 2005 CRC Press LLC
Since fractal geometry has been mentioned in this context, it is an appropriate
place to insert a brief digression on the measurement of fractal dimension for
surfaces. These frequently arise in food products, especially ones that consist of an
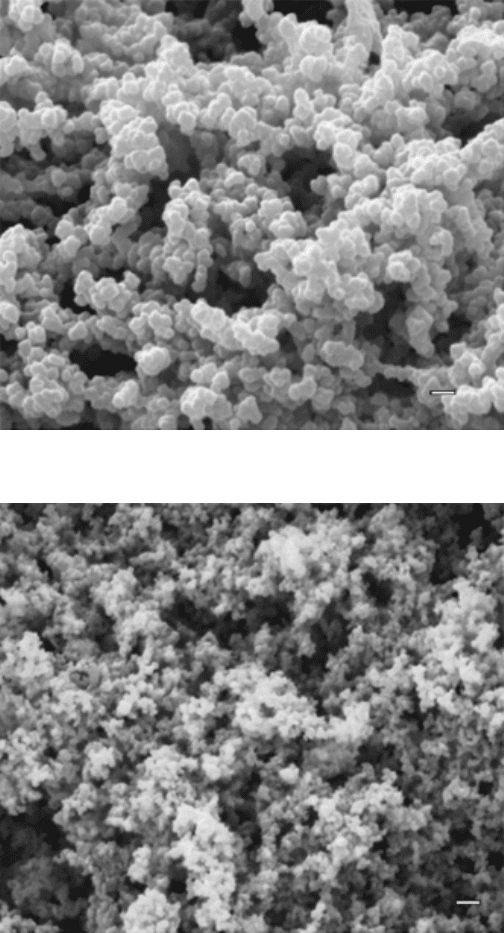
aggregation of similar particles or components. For example, the images in Figure
3.32 show the surface of particulate whey protein isolate gels made with different
pH values. Visually, they have network structures of different complexity. This can
be measured by determining the surface fractal dimension (we will see in later
chapters other ways to measure the fractal dimension).
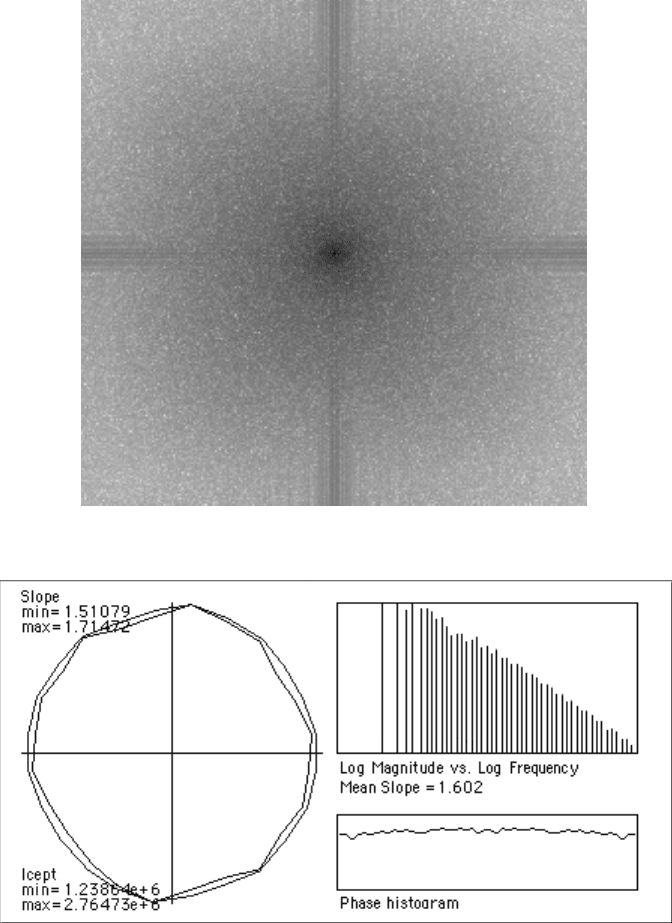
The most efficient way to determine a fractal dimension for a surface is to
calculate the Fourier transform power spectrum, and to plot (on the usual log-log
axes) the amplitude as a function of frequency. As shown in Figure 3.33, the plot is
a straight line for a fractal, and the dimension is proportional to the slope. If the
surface is not isotropic, the dimension or the intercept of the plot will vary with
direction and can be used for measurement as well.
(c)
FIGURE 3.29 (continued)
2241_C03.fm Page 159 Thursday, April 28, 2005 10:28 AM
Copyright © 2005 CRC Press LLC
(a)
(b)
FIGURE 3.30
A TEM image of liver tissue (a) and the result of calculating the entropy
within a neighborhood with radius of 4 pixels and representing it with a grey scale value (b).
2241_C03.fm Page 160 Thursday, April 28, 2005 10:28 AM
Copyright © 2005 CRC Press LLC
(a)
(b)
FIGURE 3.31
The slope (a) and intercept (b) from calculation of the fractal texture in the
image in Figure 3.29(a).
2241_C03.fm Page 161 Thursday, April 28, 2005 10:28 AM
Copyright © 2005 CRC Press LLC
(a)
(b)
FIGURE 3.32 Surface images of particulate whey protein isolate gel networks showing a
change in fractal dimension vs. pH. (a) pH 5.4, fractal dimension 2.17; (b) pH 5.63, fractal
dimension 2.45. (Courtesy of Allen Foegeding, North Carolina State University, Department
of Food Science. Magnification bars are 0.5 µm)
2241_C03.fm Page 162 Thursday, April 28, 2005 10:28 AM
Copyright © 2005 CRC Press LLC
(a)
(b)
FIGURE 3.33 Analysis of the fractal gel structure shown in Figure 3.32a: (a) the Fourier
transform power spectrum; (b) its analysis, showing the phase values which must be random-
ized and a plot of the log magnitude vs. log frequency which must be linear. The slope of
the plot is proportional to fractal dimension; the slope and intercept of the plot are uniform
in all directions, as shown, for an isotropic surface.
2241_C03.fm Page 163 Thursday, April 28, 2005 10:28 AM
Copyright © 2005 CRC Press LLC
DIRECTIONALITY
Many structures are composed of multiple identical components, which have
the same composition, brightness, and texture, but different orientations. This is true
for woven or fiber materials, muscles, and some types of packaging. Figure 3.34
shows an egg shell membrane. Visually, the fibers seem to be oriented in all directions
and there is no obvious predominant direction. The Sobel vector of the brightness
gradient can be used to convert the local orientation to a grey scale value at each
pixel, which in turn can be used to measure direction information. Previously, the
magnitude of the vector was used to delineate boundaries. Now, the angle as shown
in Figure 3.23 is measured and values from 0 to 360 degrees are assigned grey scale
values of 0 to 255. A histogram of the processed image shows that the fibers are
not isotropic, but that more of them are oriented in a near-horizontal direction in
this region.
This method can also be used with features that are not straight. Figure 3.35
shows an example of collagen fibers, which seem not to be random, but to have a
predominant orientation in the vertical direction. The direction of the brightness
gradient calculated from the Sobel operator measures orientation at each pixel
location, so for a curved feature each portion of the fiber is measured and the
histogram reflects the amount of fiber length that is oriented in each direction.
Note that the brightness gradient vector points at right angles to the orientation
of the fiber, but half of the pixels have vectors that point toward one side of the fiber
and half toward the other. Consequently the resulting histogram plots show two
peaks, 128 grey scale values or 180 degrees apart. It is possible to convert the grey
scale values in the image to remove the 180 degree duplication, by assigning a color
look up table (CLUT) that varies from black to white over the first 128 values, and
then repeats that for the second 128 values. This simplifies some thresholding
procedures as will be shown below.
The images in the preceding examples are entirely filled with fibers. This is not
always the case. Figure 3.36 shows discrete fibers, and again the question is whether
they are isotropically oriented or have a preferential directionality. The measurement
is performed in the same way, but the image processing requires an extra step. A
duplicate of the image is thresholded to select only the fibers and not the background.
This image is then used as a mask to select only the pixels within the fibers for
measurement. The random orientation values that are present in the non-fiber area
represent gradient vectors whose magnitude is very small, but which still show up
in the orientation image and must be excluded from the measurement procedure.
The thresholded binary image of the fibers is combined with the direction values
keeping whichever pixel is brighter, which replaces the black pixels of the fibers
with the direction information.
The 0 to 360 degree range of the orientation values is often represented in color
images by the 0 to 360 degree values for hue. Like most false-color or pseudocolor
displays, this makes a pretty image (Figure 3.37) and helps to communicate one
piece of information to the viewer (the orientation of the fiber), but adds no new
information to the measurement process.
2241_C03.fm Page 164 Thursday, April 28, 2005 10:28 AM
Copyright © 2005 CRC Press LLC
