Pump Handbook by Igor J. Karassik, Joseph P. Messina, Paul Cooper, Charles C. Heald - 3rd edition
Подождите немного. Документ загружается.

9.16.1 HYDRAULIC TRANSPORT OF SOLIDS 9.323
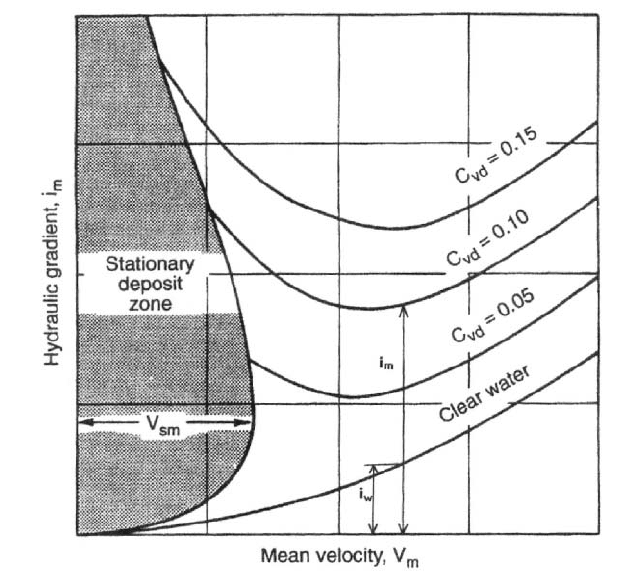
FIGURE 1 Definition sketch
Newitt et al. (1955) divided slurry flows into three types. These include the equivalent-
fluid type and the partially stratified type, which have been previously described. The
remaining type is known as fully stratified. In this case, either the particle fall velocity is
large or the particle size is a significant fraction of the pipe diameter. These factors pre-
clude any support of the solids by the fluid turbulence, so that the submerged weight of all
the particles must be carried to the pipe by granular contacts. Calculations (outlined on
the section on settling slurries) and experiments show that pressure gradients can be very
high for this type of flow. As a result, it is not suitable for long-distance or medium-distance
transport; but it has found some applications for short hauls.
HOMOGENEOUS SLURRIES ___________________________________________
Equivalent-Fluid Calculations
As mentioned in the previous section, pseudo-
homogeneous flow (for example aqueous slurries of silt or fine sand) shares with truly
homogeneous flow the property that the pressure gradient increases with througput veloc-
ity in a fluid-like fashion. An increase of this type can be expressed, at least to a reason-
able approximation, by the statement that the pressure drop for turbulent flow of a
homogeneous or pseudo-homogeneous mixture is proportional to that obtained for an
equal discharge of carrier fluid alone.
Before this statement can be put into mathematical form, it is necessary to consider
various ways of expressing the pressure drop due to friction. The change of pressure per
9.324 CHAPTER NINE
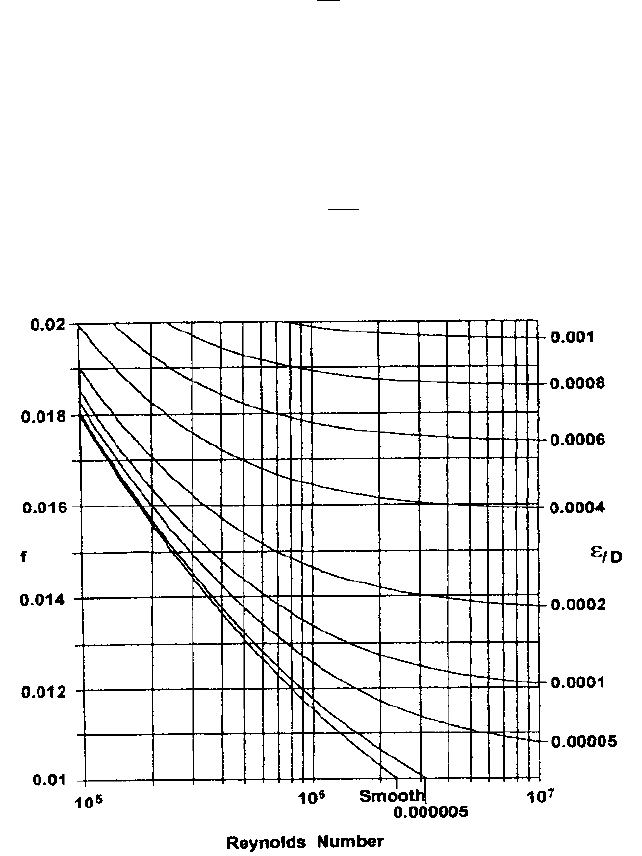
FIGURE 2 Friction factor in normal operating range
unit length of pipe, p/x, is not commonly employed in practice, in part because it
includes the effect of differences in elevation as well as friction losses. For liquids, espe-
cially water, the hydraulic gradient, i, is normally used. This quantity is the slope of the
hydraulic grade line, which is based on the levels to which the fluid would rise in a series
of imaginary tubes tapped into the pipeline. As the slope of the hydraulic grade line, the
hydraulic gradient represents the drop in level per unit length of pipe. For water (density
r
w
) flowing in a horizontal pipe, i is related to the pressure gradient as follows
(1)
where g is gravitational acceleration.
As water forms the carrier liquid in the majority of slurry flows, it is convenient to use it
as a standard for comparison of frictional pressure losses.Thus, throughout this chapter the
usual expression for frictional losses is in terms of i (height of water per unit length of pipe).
The value for i for clear-water flow is written i
w
, and that for a mixture (i.e. frictional loss in
height of water per unit length) is written i
m
. The statement made previously for homoge-
neous and pseudo-homogeneous flows amounts to a direct proportionality between i
m
and i
w
.
Calculation of i
w
uses the Stanton-Moody friction factor, f, in the equation
(2)
For turbulent flow, the friction factor depends on both the Reynolds number (Re rV
m
D/m)
and the relative roughness /D. These two quantities can be entered on Figure 2, which is
i
w
f
V
2
2gD
i a
¢p
¢x
b>r
w
g

9.16.1 HYDRAULIC TRANSPORT OF SOLIDS 9.325
used to obtain f. For example, with Re 1.5 10
6
and /D 0.0001, f 0.013 (a typical
value). As f is approximately constant for turbulent flow in a given pipe, Eq. 2 shows that
the hydraulic gradient varies roughly as V
2
(or as Q
2
).
In non-slurry applications, if a liquid other than water is conveyed, the hydraulic gra-
dient concept is applied by substituting the density of this liquid for that of water in Eq.
1, so that the hydraulic gradient is expressed in height of flowing liquid per unit length.
In considering, say, a pseudo-homogeneous slurry of fine sand, it may be of interest to com-
pare its behavior to that of a liquid with density equal to that of the flowing mixture r
m
,
which is given by
(3)
Here S
s
is the relative density of the solids (compared to water) and C
v
is the volumetric
concentration of solids.
Substituting r
m
for r
w
in Eq. 1 gives the mixture-height gradient (i.e. measured in
height of mixture rather than of water). For clarity, a different symbol must be used, and
j is employed for this purpose. For a mixture flowing in a horizontal pipe:
(4)
Although j is expressed in height of mixture per unit length of pipe, actual measurements
based on columns of mixture in vertical tubes would not be feasible, and j would have to
be obtained indirectly from pressure measurements. It can be seen from Eqs. 1 and 4 that
the ratio of i to j equals the relative density of the mixture S
m
(i.e. r
m
/r
w
).
The equivalent-fluid model of slurry flow assumes that the solids have little effect on
friction factor, and that the mixture acts as a liquid as far as the relative-density effect is
concerned. The resulting hydraulic gradient for homogeneous mixture flow, i
mh
, is equiva-
lent to the product of S
m
and i
w
. Although the equivalent-fluid model has been widely
employed in the past, it is not generally supported by the experimental evidence. For
example, sand-water experiments by Carstens & Addie (1981) show that for some pseudo-
homogeneous flows i
mh
does not exceed i
w
at all. An appropriate equation for the hydraulic
gradient is:
(5)
Setting the coefficient A¿ equal to unity gives the relative-density effect of an equivalent-
fluid model, whereas A¿ 0 gives the behavior observed by Carstens & Addie (1981). Inter-
mediate types can be represented by values of A¿ between zero and unity. Equation 5 will
be referred to as the “homogeneous flow” equation, with the specific case of A¿ 1.0 called
the “equivalent fluid” model.
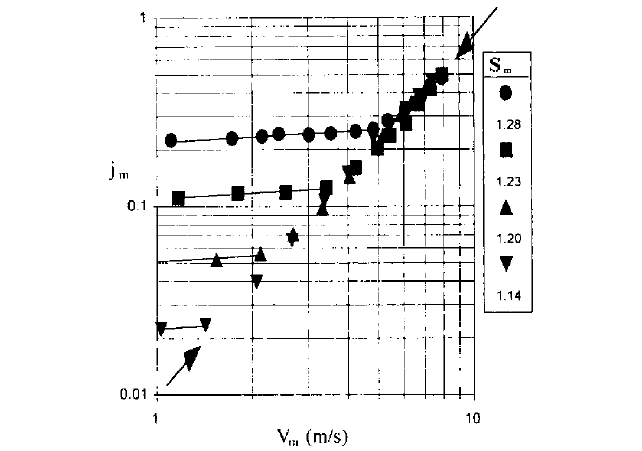
Modeling Non-Newtonian Flows In pipeline transport of non-Newtonian materials,
the variation of pressure drop with velocity is typically rather flat for laminar flow, while
it is much steeper for turbulent flow. Figure 3 shows these features. This figure is a plot,
on logarithmic axes, of hydraulic gradient j
m
(i.e. frictional losses in height of equivalent
fluid per unit length of pipe) versus mean velocity V
m
(volumetric discharge/cross-sectional
area). The data shown on this plot refer to various concentrations of a red mud tested at
the GIW Hydraulic Laboratory in a pipeline with internal diameter of 3.19 in. (81 mm).
The plotted data are for mixtures with relative densities from 1.14 to 1.28. Note that
where laminar flow occurs the slope of the lines (referred to the logarithmic coordinates)
is rather small and does not vary significantly with particle concentration. However, the
vertical position of the laminar lines increases strongly with increasing concentration.
Conversely, for turbulent flow, concentration has very little effect; all the points fall close
to a single line with slope (for logarithmic coordinates) close to 2.0. This behavior implies
that the friction factor f has a near-constant value for the observed turbulent flows. Note
that the transitions between laminar and turbulent flow are rather abrupt.
Rheograms, i.e. curves of shear stress versus strain rate, are obtained from tests under
laminar conditions, using either rotary viscometers or tube viscometers. The latter are
i
mh
31 A¿1S
m
124i
w
j a
¢p
¢x
b>r
m
g
r
m
r
w
11 1S
s
12C
v
2
9.326 CHAPTER NINE
FIGURE 3 Friction gradients of a red-mud slurry
preferable, as they are geometrically similar to the pipeline configuration. For a Newtonian
fluid of viscosity m, shear stress t is related to strain rate du/dy by the classic expression
(6)
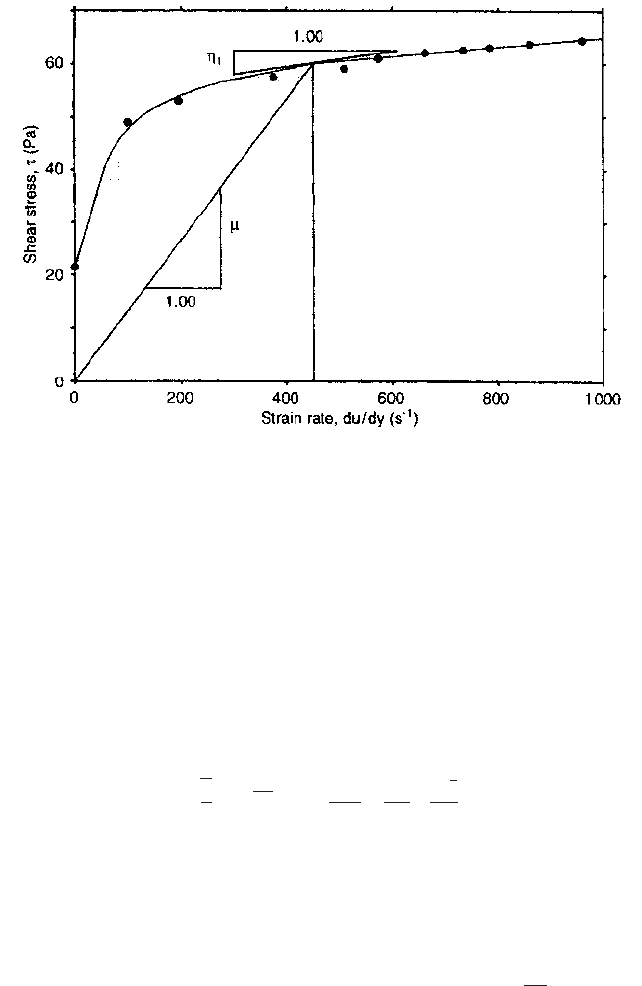
Rheograms for non-Newtonian materials are not so simple. For example, Figure 4
shows a rheogram for a fine-particle slurry. This rheogram does not pass through the ori-
gin (the strain rate remains zero until a certain yield stress t
y
is exceeded) and is not
straight (although in this case the behavior is approximately linear at large values of
strain rate). The definition of viscosity given by Eq. 6 can be retained, although this vis-
cosity no longer represents the slope of the rheogram itself, but rather that of the secant
line shown on the figure. Hence m as defined by Eq. 6 can also be called the “secant” vis-
cosity. The tangent to the rheogram, though less meaningful physically, is often referred to.
This “tangent” viscosity will be denoted h
t
. Both m and h
t
vary with position, and hence
they both depend on du/dy (or, alternatively, on t). The stippling of Figure 4 indicates the
area beneath the leftward portion of the rheogram. The area ratio a (which will be used
below) is the ratio between the stippled area and the traingular area below the secant line.
As with m and h
t
, both the area beneath the rheogram and the area ratio a depend on
du/dy (or on t).
It is common practice to represent rheograms by simple mathematical functions (i.e.
functions having only two or three parameters). For materials exhibiting a yield stress, the
most common engineering choice is the Bingham model, a straight line given by
(7)
Here the Bingham viscosity h
B
is the tangent viscosity given by the slope of the fit line, and
the Bingham yield stress t
B
is the intercept of the fit line with the shear-stress axis. For
the data of Figure 4, t
B
is larger than the observed stress at zero strain rate, a situation
that is commonly encountered.
t t
B
h
B
1du>dy2
t m1du>dy2
9.16.1 HYDRAULIC TRANSPORT OF SOLIDS 9.327
FIGURE 4 Rheogram for phosphate slimes tested at GIW Hydraulic Laboratory (after Wilson, 1986).
[Pa 0.000145 = lb/in
2
]
The dimensionless ratio t/t
B
(denoted u and called the stress ratio) is a useful parame-
ter when dealing with Bingham physics. For example, in laminar flow, the secant viscos-
ity (“apparent viscosity”) m is related to the stress ratio by the equation
(8)
This equation indicates a gradual decrease of m with increasing stress ratio.Another para-
meter appropriate for Bingham plastics is the Hedström number, He
(9)
where r is the mixture density.
The friction factor for laminar flow of a Bingham plastic can be expressed in terms of
these parameters as
(10)
As noted previously, turbulent flows of non-Newtonians are often characterized by a
roughly constant value of friction factor, in contrast with the large variations typical of
laminar flow. An old way of estimating f for turbulent flow, proposed by Hedström (1952),
is to use the Bingham viscosity h
B
in place of m in the relationship for Newtonian turbu-
lent flow. This approach should be considered as only a rough approximation. A better
method is to begin with, say, the smooth-wall Newtonian equation
(11)
where /n denotes the natural logarithm and the shear velocity U
*
, i.e. , is evaluated
at the pipe wall. For turbulent pipe-flow tests of a non-Newtonian material, all quantities
except m will be available for each test run. Therefore, in each case Eq. 11 can be solved for
2t>r
V
m
2.5U
*
/n1rDU
*
>m2
B
8
f
2He
#
a1
4u
1
3
u
4
3
b
#
2u
8
He D
2
rt
B
>h
B
2
m>h
B
u>1u 12
9.328 CHAPTER NINE
the viscosity, which is now denoted m
eq
, the equivalent turbulent-flow viscosity. This vis-
cosity is not constant (as would be the case for a Newtonian fluid, or for Hedström’s pos-
tulate, i.e. m
eq
h
B
) but varies with wall shear stress, and hence with shear velocity, as
described by Wilson et al. (1997).
If turbulent-flow tests are available, scale-up to prototype size can be accomplished
directly (as shown in the following section). Otherwise, m
eq
can be predicted on the basis of
the laminar-flow rheogram. The prediction method follows the model of Wilson & Thomas
(1985), which in turn is based on a proposal of Lumley (1973, 1978) regarding the viscous
sub-layer. Increasing the size of the dissipative micro-eddies leads to an increase in the
thickness of this sub-layer. The thickened sub-layer, in turn, produces a higher mean veloc-
ity for the same wall shear stress. The model uses the ratio of the integrals under the non-
Newtonian and Newtonian rheograms (denoted by a, and defined earlier in connection
with Figure 4) to estimate the size increase of the turbulent micro-eddies. It is found that
both the micro-eddy size and the thickness of the viscous sub-layer should be multiplied
by a factor equal to a.This results in a simple expression for the equivalent turbulent-flow
viscosity. For a Bingham plastic a can be expressed in terms of the stress ratio as (u 1)/u,
and the expression for m
eq
becomes
(12)
A plot of this function (Wilson, 1997) shows that, as u increases above 1.0, m
eq
/h
B
begins
by dropping below unity, descends to a minimum (0.216 at u 1.32) and then rises grad-
ually toward unity. The resulting expression for turbulent-flow friction factor depends
only on the parameters He and u. The equivalent expression for laminar flow (Eq. 10)
involves the same two parameters. The intercept of turbulent and laminar lines occurs
where these two equations give the same value of f. At this intercept it is possible to elim-
inate u using an iterative technique, thus producing a plot of f (at intercept) versus Hed-
ström number. On logarithmic coordinates the plot is not far from a straight line in the
region , and a power-law approximation can be used in this range,
as follows:
(13)
Experimental evidence from pipe-flow tests of fine-particle slurries typically shows
abrupt laminar-turbulent transitions, followed in the turbulent range by a plateau of vir-
tually constant friction factor. Equation 13 gives a valuable tool for predicing f for this
plateau. This friction factor falls below the traditional curve of Hedström, by which the
equivalent turbulent-flow viscosity is equated to the Bingham tangent viscosity, h
B
.
This technique can be extended to predict the transition between laminar and turbu-
lent flow. For a Newtonian fluid, with a single rheological parameter (m), the transition is
defined by a specific value of a single dimensionless ratio (the Reynolds number rV
m
D/m).
A second rheological parameter, required for a non-Newtonian material such as a Bing-
ham plastic, introduces the need for a second dimensionless ratio. In this case the two
ratios are the “Bingham” Reynolds number, i.e. Re
B
rV
m
D/h
B
and Hedström number
which has been previously defined. As pointed out by D. G. Thomas (1963) the laminar-
turbulent transition must now be defined by a functional relationship linking Re
B
at tran-
sition with He.
Following the method used in obtaining Eq. 13, the laminar and turbulent relations
can be equated at the intercept and f (as well as u) can be eliminated to obtain a plot of Re
B
at intercept versus He. It was found that the result could be closely approximated by the
simple relationship that Re
B
equals . On cancelling common quantities, it is seen
that the flow velocity at transition, say V
T
, is given by:
(14)
The approach of D. G. Thomas (1963) produced a similar form in the limit, but with a coef-
ficient of 19 rather than 25.
V
T
252t
B
>r
252He
f 0.08771He2
0.113
200 2He 10000
m
eq
>h
B
31u 12> 1 u 124exp1 4.64>u2

9.16.1 HYDRAULIC TRANSPORT OF SOLIDS 9.329
Scale-up of Laminar and Turbulent Flows The laminar flow of any given fluid can be
scaled from one pipe size to another by use of the Rabinowitsch-Mooney technique pro-
vided that the flow remains laminar in both pipes (turbulent flow will be dealt with sep-
arately below). The basis of the Rabinowitsch-Mooney technique is the plot of wall shear
stress t
0
versus 8V
m
/D. Rabinowitsch (1929) and Mooney (1931) proved that for steady uni-
form laminar flows in a pipe t
0
and 8V
m
/D are linked in a functional relationship. In other
words, for a given material the values of both t
0
and 8V
m
/D can be determined from exper-
iments in a single pipe. The experimentally determined plot or function linking these two
variables can then be applied to all laminar flows of the material in question, whatever
the pipe diameter.
The application of the method is based on a logarithmic plot of t
0
versus 8V
m
/D
obtained from a pipe of internal diameter D
1
. For some other pipe, of diameter D
2
, the pres-
sure gradient dp/dx can be obtained from the plotted values of t
0
by multiplying them by
(4/D
2
). Since the factors by which each of the coordinates are multiplied depend only on D
2
,
a simple re-scaling of the axes of the figure based on D
1
gives a plot of dp/dx versus V
m
for
a pipe of diameter D
2
. For plots on logarithmic coordinates, this type of scaling amounts to
a pair of linear translations, which do not affect the shape of the plot. In this regard it
should be noted that a Newtonian fluid shows a slope of unity on a logarithmic plot of pres-
sure gradient versus mean velocity, whereas the slopes of logarithmic plots for non-
Newtonian laminar flow (such as those on Figure 3) are much flatter.
An alternative way of dealing with scale-up to a larger pipe is to transform the data
from the experimental pipe (diameter D
1
) to the prototype (diameter D
2
) on a point-by-
point basis.This process is similar to using the affinity laws for scaling head and discharge
data for a centrifugal pump. For the pipe, the analogous quantities are the frictional gra-
dient i
m
(ft of water/ft or m of water/m) and the mean velocity V
m
. With the subscripts 1
and 2 denoting experimental and prototype conditions, respectively, the scaling relations
(affinity laws) for laminar flows in pipes are:
(15)
and
(16)
If it is foreseen that flow in the prototype pipeline may be turbulent, it is important to
extend the small-scale experimental tests into the turbulent-flow region, and then to scale
these test results up to prototype size. For turbulent scaling, as for the laminar case, the
quantity that remains unchanged is the wall shear stress t
0
. As in laminar flow, the wall
shear stress fully determines the stress distribution within the pipe. For example, with a
material having a yield stress t
y
a specified value of t
0
is sufficient to give the fraction of
the pipe area where t t
y
, a factor which can affect the mean velocity (Wilson & Thomas,
1985; Thomas & Wilson, 1987). Likewise, a given value of t
0
, and hence of U
*
, determines
conditions within the viscous sub-layer and hence establishes both m and the area ratio a.
The result is that t
0
(or U
*
) is sufficient to determine the equivalent turbulent-flow vis-
cosity. For each value of t
0
two scaling laws apply to turbulent pipe flow. The first, for pres-
sure gradient, is the same as that established for laminar flow, i.e. Eq. 15. The second
scaling law, for mean velocity, is given by
(17)
As with Eqs. 15 and 16 for laminar flow, the combined use of Eqs. 15 and 17 allow scale-
up of data for turbulent non-Newtonian flow from one pipe size to another. Wilson (1986)
gives an example where scaled-up values from a small pipe are compared to measured
data in a larger pipe, with very satisfactory agreement. Equation 17 is also valid for cases
where m is constant, i.e. for Newtonian fluids, and for turbulent flow of dilute polymer solu-
tions exhibiting drag reduction (Wilson, 1989).
1V
m
2
2
1V
m
2
1
2.5U
*
/n1D
2
>D
1
2
1V
m
2
2
1V
m
2
1
a
D
2
D
1
b
1i
m
2
2
1i
m
2
1
a
D
1
D
2
b

9.330 CHAPTER NINE
TABLE 1 Data for phosphate slimes slurry in 8 in. (203 mm) pipe
V
m
t
0
U
*
Run ft/s m/s 8V
m
/D(s
1
) i
m
lb/ft
2
Pa ft/s m/s
1 1.7 0.53 21.0 0.1004 1.04 49.9 0.69 0.210
2 5.0 1.52 60.1 0.1130 1.17 56.2 0.73 0.223
3 6.6 2.00 78.8 0.1150 1.19 57.2 0.74 0.225
4 8.5 2.59 102.1 0.1189 1.24 59.1 0.75 0.229
5 10.6 3.24 127.9 0.1218 1.27 60.1 0.76 0.231
6 12.5 3.81 150.3 0.1237 1.29 61.5 0.77 0.233
7 14.5 4.43 174.7 0.1273 1.32 63.4 0.78 0.237
8 16.8 5.12 202.0 0.1348 1.40 67.0 0.80 0.243
9 18.5 5.64 222.6 0.1472 1.53 73.2 0.83 0.254
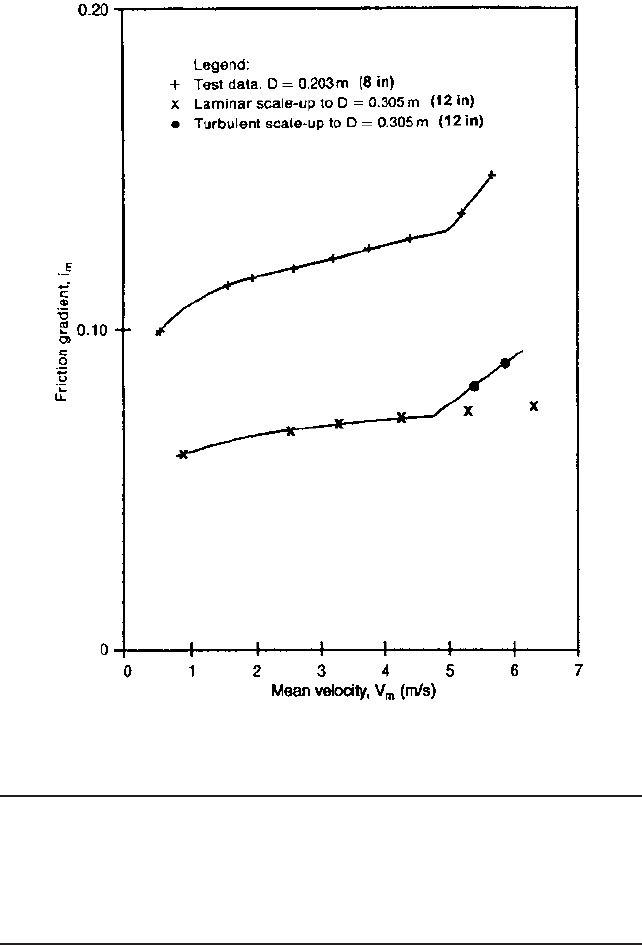
EXAMPLE 1 A clay-water slurry of phosphate slimes is to be pumped over a horizontal
distance of 2300 ft. (700 m), using a pipe of internal diameter 12 in. (305 mm). The
slurry will be taken from a pond in which the relative density of the mixture is 1
#
13.
Tests have been carried out with this material using a pipe of internal diameter 8 in.
(203 mm). Test data for i
m
and V
m
appear in Table 1 together with values of 8V
m
/D and
t
0
(the wall shear stress equals r
w
gi
m
D/4). Figure 5 shows the values of i
m
plotted ver-
sus V
m
for the test pipe.
The preliminary design of the pumping system calls for a discharge Q
m
of 4770 gpm
(0.30 m
3
/s) in the prototype pipe. However, this value is not yet definite, and Q
m
values
of 3180 gpm (0.20 m
3
/s) and 6360 gpm (0.40 m
3
/s) are also to be considered.
a. Find the values of i
m
for the three values of Q
m
just noted. First, the pipe area
(0.785 ft
2
or 0.0731 m
2
) is used to obtain the required velocities, i.e. 9.0, 13.5 and
18.0 ft/s (2.74, 4.11 and 5.48 m/s).
The next step is to scale the data points from the test pipe to the prototype pipe.
For the laminar-flow points the appropriate scaling laws are given by Eqs. 15 and
16, which show that i
m
scales inversely with the diameter ratio while V
m
scales
directly with this ratio. Points from test runs 1 to 7 have been scaled on this basis
and the first six are shown on Figure 5. For test runs 8 and 9 the flow is turbulent.
The hydraulic gradient can still be scaled by Eq. 15, but V
m
must now be scaled by
Eq. 17. This requires evaluation of U
*
, i.e. . For example, run 8 with t
0
0.01
lb/ft
2
(67.0 Pa) has U
*
= 0.8 ft/s (0.243 m/s), for which Eq. 17 gives a scaled-up value
of V
m
equal to 17.6 ft/s (5.37 m/s).
The laminar-turbulent transition point is obtained by projecting the turbulent line
back to intercept the laminar line. For the data in the test pipe this intercept
occurred to the right of point 7, at a velocity of about 16 ft/s (say 5 m/s). For the pro-
totype pipe the intercept lies between points 4 and 5, with a slightly lower veloc-
ity. Note that the scaled values for points 5 to 7 are not physically meaningful,
because the equivalent flows in the prototype pipe are turbulent, not laminar.
Figure 5 shows that conditions will be laminar for the two lower flows to be inves-
tigated, and turbulent for the highest flow. The values of i
m
can be taken directly
from the figure, and are listed in Table 2.
The flat curve for laminar flow, plotted on Figure 5, shows a very small rise in i
m
as Q
m
goes from 7.1 to 10.6 ft
3
/s (0.20 to 0.30 m
3
/s). On the other hand, the equal
increase of Q
m
from 10.6 to 14.1 ft
3
/s (0.30 to 0.40 m
3
/s) requires a much larger
increment in i
m
, as a result of the shift from laminar to turbulent flow.
b. Suppose now that testing had stopped after run 6, so that no turbulent-data flow
points were available.
1t
0
>r
9.16.1 HYDRAULIC TRANSPORT OF SOLIDS 9.331
FIGURE 5 Test data and scale-up for Example 1. [m/s 3.28 = ft/s]
TABLE 2 Hydraulic gradients and pump heads from scaled-up values
Q
m
(m
3
/s) 0.20 0.30 0.40
Q
m
(US gpm) 3180 4760 6360
V
m
(m/s) 2.74 4.11 5.48
V
m
(ft/s) 9.0 13.5 18.0
i
m
0.0760 0.0795 0.0915
Pump Head (m water) 53.2 55.6 64.0
Pump Head (ft water) 174 183 210
In this case the laminar line would be scaled as before, but the transition to tur-
bulent flow must be predicted from the parameters of the laminar-flow rheogram.
It was found that all laminar points except the lowest one can be considered as
9.332 CHAPTER NINE
obeying a Bingham formulation of the rheogram, with t
y
0.0076 lb/in
2
(52.7 Pa)
and h
B
0.020 Pa
#
s. Substitution of these quantities into Eq. 14 yields V
T
17.7
ft/s (5.4 m/s) which is somewhat above the observed transition.The similar expres-
sion of D. G. Thomas (1963) gives V
T
of 13.4 ft/s (4.1 m/s), significantly below the
observed transition point. The use of Eq. 13 to evaluate turbulent friction produces
a turbulent line that passes through the transition point predicted by Eq. 14.
SETTLING SLURRIES _________________________________________________
Velocity at Limit of Stationary Deposition
The deposition limit will be discussed in
this section, and the modelling of fully-stratified coarse-particle flow at velocities above
the deposition limit in the following section.
The results of a detailed force-balance computer model for the limit of stationary depo-
sition showed that the throughput velocity V
m
at this limit is concentration-dependent,
having small values at low concentration, rising to a maximum (denoted V
sm
) at some
intermediate concentration (which depends on pipe size and particle size and density) and
then dropping off again as the delivered solids concentration approaches the loose-poured
value, C
vb
. This behavior was shown on Figure 1. It should be noted that the velocities used
here are obtained simply by dividing the mixture flow rate (Q
m
) by the pipe area (pD
2
/4).
The computer output is unwieldy for a designer concerned with many alternative pro-
posals. Moreover, the conservative designer may be content to know only the maximum
velocity at the limit of deposition, V
sm
, since maintaining the operating velocity above this
value ensures that deposition will not occur. The value of V
sm
depends on internal pipe
diameter, particle diameter and relative density, and the effect of these variables is
expressed concisely by a nomographic chart which was developed at Queen’s University
(Wilson & Judge, 1978; Wilson, 1979) with the help of the late Professor F. M. Wood’s
expertise in nomography (Wood, 1935). This chart, reproduced here as Figure 6, is recom-
mended as a practical design aid.
It should be noted, by way of explanation of the chart, that the left-hand panel deals
with sand-weight materials (S
s
2.65). The internal pipe diameter appears on the left ver-
tical axis, with V
sm
on the central vertical axis. The particle diameter is plotted on a curve
known, on the basis of its shape, as the “demi McDonald.” This shape illustrates that for
large particles, but not for small ones, the shear stress at the interface between the upper
and lower layers increases with increasing particle size. Thus, for coarse-particle transport
the velocity at the limit of deposition (i.e. the velocity beyond which no bed can remain sta-
tionary) will decrease with increasing particle size.This finding, which is amply supported
by experimental evidence, shows how the fully-stratified mode of transport can display
behavior quite different from that of the heterogeneous mode.
To demonstrate the particle size effect consider particles of S
s
2.65 in a pipe 12 inches
(0.30 m) in diameter. This diameter is located on the vertical scale on the left-hand side of
the chart, and connected by straight-edge to any desired particle size on the curved scale.
V
sm
is then obtained by projected to the central vertical scale. For instance, a particle size
of 0.025 in. (0.6 mm) gives V
sm
of almost 13 ft/s (4 m/s), which is the largest value found for
this pipe diameter and solids density. For a larger particle of, say 0.2 in. (5 mm), the
deposition-limit velocity is diminished to about 9 ft/s (2.7 m/s).
When operating with centrifugal pumps it may be difficult to take advantage of the
decrease of V
sm
with increasing particle size. The question is one of obtaining a stable
intercept of pump and pipeline characteristics, and will be discussed later in this section.
For applications where control of particle size is limited, the conservative designer may
wish simply to assume particles of “Murphian” size, i.e. those which give the largest value
of V
sm
for the pipe under consideration. In this case, it should be noted that the values of
V
sm
obtained from Figure 6 tend to be conservatively high, especially for large pipe diam-
eters. Thus, these values can sometimes be used as operating velocities.
A particularly useful feature of nomographic presentation of results is that it gives an
immediate indication of the sensitivity of the output to variations in the input. Thus on
Figure 6 it is seen that the value of V
sm
for sandweight solids in a 12 in. (0.30 m) pipe is