Potter T.D., Colman B.R. (co-chief editors). The handbook of weather, climate, and water: dynamics, climate physical meteorology, weather systems, and measurements
Подождите немного. Документ загружается.


The ambiguous range can be increased by slowing the PRT. This is frequently
done to measure storms at great range. A PRT of 2 ms increases the range to 300 km.
But this may complicate velocity processing as discussed in the next section. Newer
techniques incl ude the addition of phase offsets to the transmitted pulses so that the
true range to the scatterers can be retrieved.
So-called second-trip echoes can be detected by trained observers since they have
elongated and unrealistic shapes. In the case of random phase magnetron radars, the
Doppler velocities in the second-trip echoes will be incoherent, not smoothly vary-
ing as in correctly ranged echoes.
Velocity Ambiguity: The Nyquist Interval For a given transmitted wave-
length and PRT, there is a maximum velocity that can be ambiguously measured.
This is because Doppler radars do not actually measure the Doppler shift of returned
radiation. Referring back to Figure 7, the fractional portion of the path length from
radar to target back to the radar is measured. It is usually assumed that this path
length changes by less than one full wavelength during the PRT. But, this may not be
so. Consider a 10-cm radar with a PRT of 1 ms. If a raindrop is embedded in a strong
wind, say 40 m=s away from the radar, then it will move 4 cm during the PRT. This
means that the round-trip path length will increase by 8 cm, say from 10
9
to
10
9
þ 0.8 wavelengths. Ambiguity arises because it is difficult to distinguish
between a 8 cm increase in path length and a 2-cm decrease since each will result
in the same fractional portion difference, namely 0.8 wavelengths [i.e.,
frac(10
9
þ 0.8) ¼frac(10
9
7 0.2) ¼0.8]. The Nyquist interval is the range of
velocities that will produce path length changes between
1
2
wavelength and can
be calculated as Nyquist Interval ¼l=(4 PRT). Thus, in the above case, the
Nyquist interval would be 0.1 m=(4 0.001) ¼25 m=s.
The Nyquist interval can be increased by decreasing the PRT, essentially giving
the raindrops less time to change the round-trip path length. Note, however, that this
would increase data contamination from storms beyond the now shortened ambig-
uous range. There is a trade-off between maximizing Nyquist interval and maximiz-
Figure 8 Illustration of range ambiguity phenomena. Energy scattered back from raindrops
at 156-km range arrives at the radar simultaneously with energy from the next transmitted
pulse scattered back from raindrops at 6-km range. See ftp site for color image.
906
RADAR TECHNOLOGIES IN SUPPORT OF FORECASTING AND RESEARCH
ing ambiguous range. Some research radars use techniques called dual PRT or
staggered PRT whereby alternating (or other patterns) of long and short PRTs are
used to gain a least-common-multiple effect and much larger effective Nyquist
intervals.
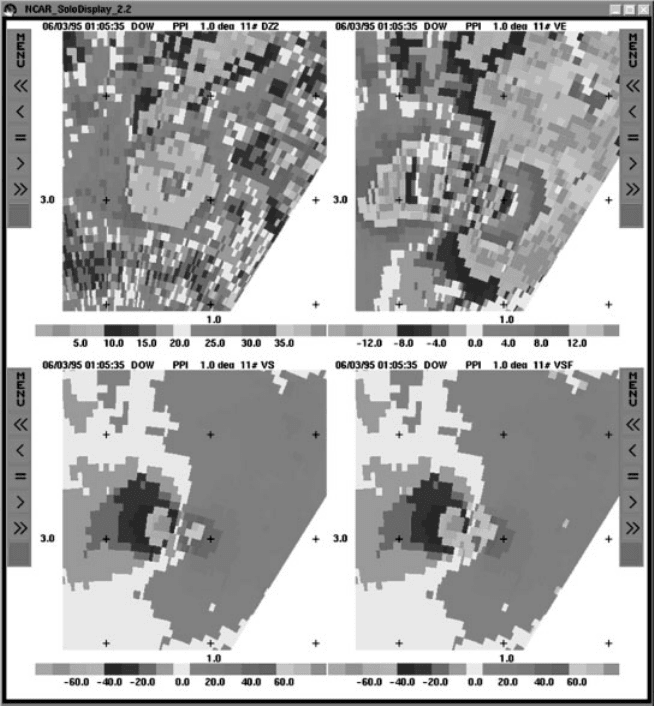
Data from regions exhibiting velocities greater in magnitude than the ambiguous
velocity are considered to be folded or aliased and need to be corrected, or unfolded,
or dealiased, to produce correct values (Fig. 9). This can be a difficult process and
can be conducted either automatically or manually.
Figure 9 (see color insert) Illustration of dealiasing and cleaning of radar data. (Top left)
Reflectivity in tor nado showing ring debris. (Top right) Raw Doppler velocity with aliasing.
(Bottom left) Velocity after dealiasing. Strong away and strong toward velocities adjacent to
each other imply rotation, in this case over 70 m=s. (Bottom right) Velocity after values with
high spectral width or contaminated by echoes from the ground (ground clutter) have been
removed. Data is from DOW mobile radar in the Dimmitt, Texas, Tornado on June 2, 1995,
from a range of 3 km. See ftp site for color image.
2 BASIC RADAR OPERATION 907
Scanning Techniques and Displays Most radars scan the sky in a very
similar way most of the time. They point the antenna just above the horizon, say 0.5
in elevation, then scan horizontally (in azimuth), until 360
is covered. Then the
radar is moved to a higher elevation, say 1.0
or 1.5
, and the process is repeated.
This continues for several to many scans. Using this method, several coaxial cones of
data are collected. These can be loaded (interpolated) onto three-dimensional grids
or displayed as is to observe the low and mid=high levels of the atmosphere. There
are infinite variations on this theme, including interleaving scans, fast and slow
scans, repeated scans at different PRTs, scanning less than 360
sectors, etc. When a
single scan is displayed, it is usually called a plan position indicator (PPI).
Sometimes, mostly during research applications, a radar will keep azimuthal
angle constant and move in elevation, taking a vertical cross section through the
atmosphere. These can be very useful when observing the vertical structure of
thunderstorms, the melting layer, the boundary layer, and other phenomena. These
types of scans are called range height indicators (RHI).
Since PPI scans have a polar, conical, geometry, lower near the radar and higher
as the beams travel outward, it is often useful to use a computer to load the data from
several scans into a Cartesian grid and display data from several different scans as
they pass through a roughly constant altitude above Earth’s surface, say 1 or 5 km
above ground level (agl). These reconstructions are called const ant altitude plan
position indicators (CAPPIs). Since the data at a given altitude can originate from
several scans, there can be ringlike interpolation artifacts in these displays.
Scanning strategy strongly influences the nature of the collected data. Operational
radars typically scan fairly slowly through 360
, using many scans, requiring about
5 to 6 min for each rotation. This provides excellent overall coverage, but can miss
the rapidly evolving weather such as tornadoes and microbursts. In specialized
research applications, much more rapid scanning, through limited regions of the
sky, is often employed.
New radar technology is being developed that may someday permit very rapid
scanning of the entire sky as discussed below.
3 RADAR OBSERVATIONS OF SELECTED PHENOMENA
There are literally thousands of examples of weather phenomena observed by
weather radars. Only a few will be illustrated here in Figure 10 to show some the
range of phenomena that can be observed and the typical nature of the data. The
interpretation of the data from weather radar is a complete study unto itself and
could occupy far more space than is appropriate in this short overview.
4 GOAL: TRUE WIND VECTORS
Radial velocities provide much qualitative infor mation about weather phenomena.
However, the true wind field is a three-dimensional wind field comprised of three -
908 RADAR TECHNOLOGIES IN SUPPORT OF FORECASTING AND RESEARCH
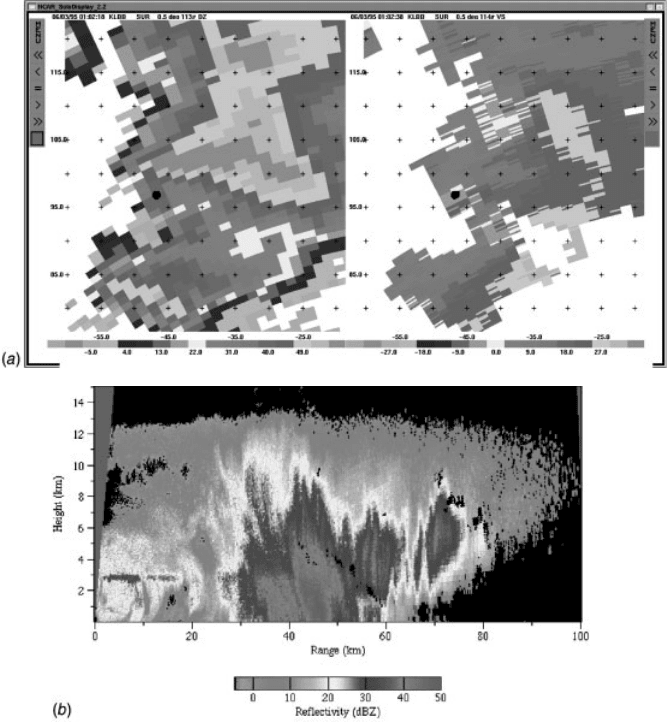
Figure 10 (see color insert) (a) A tornadic supercell thunderstorm observed by a WSR-88D
operational radar. Reflectivity ( left) and Doppler velocity (right) are shown. Classic hook echo
extends from the western side of the supercell. An intense circulation, suggested by the strong
away and toward velocities near the hook, is the mesocyclone associated with a tornado that
was occurring. (b, c) Reflectivity and Doppler velocity in a vertical cross section (RHI)
through a portion of a squall line. The high reflectivity core and lower reflectivity extending to
12 km are visible. Strong toward and away Doppler velocities are associated with the up and
down drafts of the cell, as indicated by arrows. Data from the MIT radar in Albuqurque, New
Mexico. (Courtesy of MIT Wea. Rad. Lab. D. Boccippio.) (d) Reflectivity (lower) and Doppler
velocity (upper) in a winter storm. Reflectivity is somewhat amorphous but is enhanced in a
ring corresponding to the melting layer. In the melting layer, large, wet slow-moving particles
cause high reflectivity. The velocity pattern provides a vertical sounding of the atmosphere.
Winds are from the NNW at low levels (near the radar), but from the southwest aloft (away
from the radar as the beams diverge from Earth’s surface). Cold advection is implied. Data
from the MIT radar in Cambridge, Massachusetts. (Courtesy of MIT Wea. Rad. Lab. D.
Boccippio.) See ftp site for color image.
4 GOAL: TRUE WIND VECTORS 909
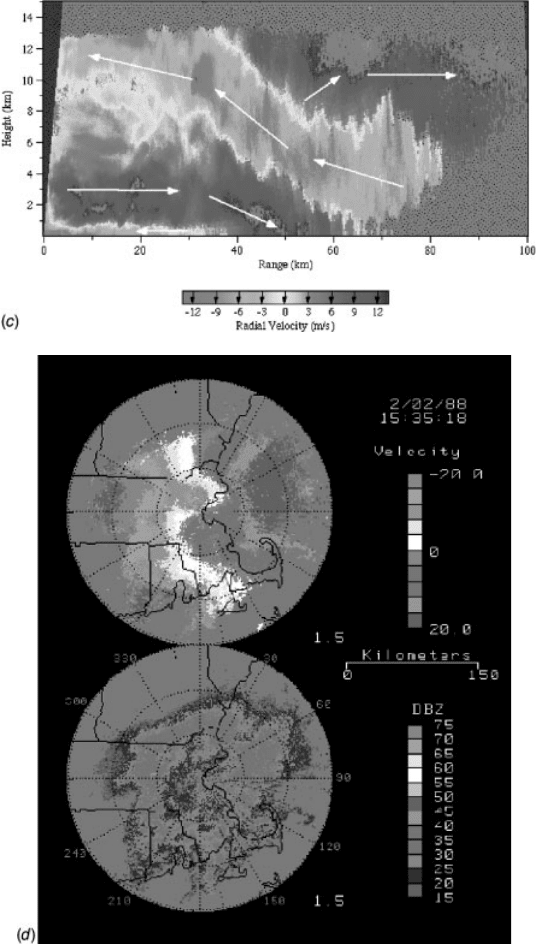
Figure 10 (continued )
910 RADAR TECHNOLOGIES IN SUPPORT OF FORECASTING AND RESEARCH
dimensional vectors, evolving in time. Physical equations used in research and in
forecasting models operate on these vector wind fields, which really contain the
physics of the phenomena. So there is great value in estimating or measuring the
full vector wind field and several techniques have been developed.
Single-Doppler Retrievals
One class of techniques for obtaining the vector wind field is called single-Doppler
wind field retrievals. These techniques use various physical assumptions to convert
data from a single radar into vector wind fields. One simple method assumes that the
reflectivity field is a passive tracer that moves with the wind. In simple terms the Z
field is examined at different times, and the wind field necessary to move the Z
features from one place to another is calculated. Of course, evolving systems compli-
cate these analyses. Another assumes that the wind field is composed of certain
simple mathematical components. These are extensions of what radar meteorologists
do visually when they look at the zero line of the Doppler velocity and assume that
the wind is moving perpendicularly to it. Several sophisticated and combination
methods are in development.
These techniques are very useful since they work with just one radar, but they are
limited by the validity of the physical assumptions. Some also only work in cases of
high reflectivity or velocity gradients, others only when precipitation covers much of
the surveyed volume.
Cur rently, these techni ques are being developed in the research environment, but
it is hoped that they will be used to introduce wind fields into operational computer
forecasting models in the future.
Dual and Multiple Dopp ler
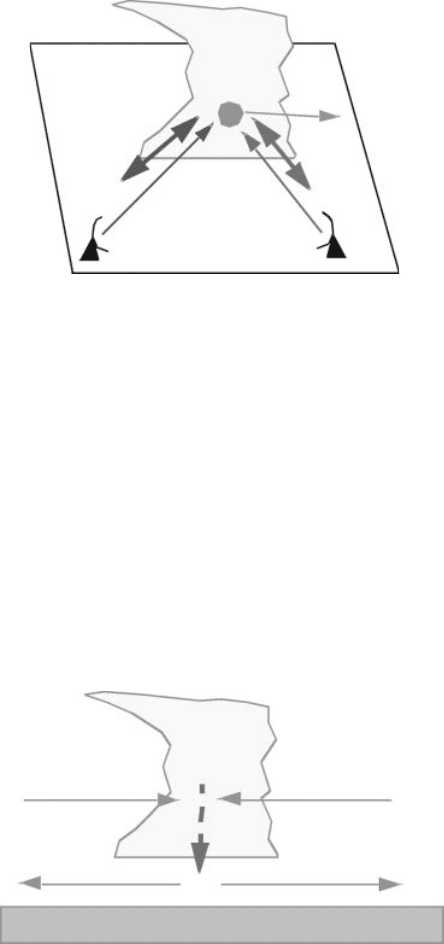
In some research experiments, two or more radars can be deployed. Each radar can
survey a target region from a different vantage point. A simple mathematical calcu-
lation ca n convert the two or more Doppler velocity measurements into a wind
vector (Fig. 11). This technique is very powerful and has been a favorite of research
meteorologists. It is not used frequently in operational forecasting because few
permanent radars are close enough for dual-Doppler calculations to be useful. The
large spacing of the U.S. WSR-88D network makes dual-Doppler calculations, while
possible, not very useful due to the large beamwidths at the typical 200-km ranges to
weather targets.
Typically, but not always, the horizontal components of the vector wind are
calculated directly from the radar measurements. The vertical compo nent is calcu-
lated by integrating the equation of mass conservation. Essentially, this says that if
there is strong divergence in the boundary layer as in, say, a microburst, the air must
have come from above, implying downward vertical motion (Fig. 12). Strong
convergence near the ground implies an updraf t. Similarly, strong divergence at
storm top indicates an updraft from below, etc. Unfortunately, the vertical motions
calculated in this manner result from the integration of quantities that are derivatives
4 GOAL: TRUE WIND VECTORS 911
of actual measurements. Both the integration and differential processes are prone to
errors. The resultant vertical wind estimates can be substantially incorrect. Accurate
determination of vertical motions from radar data is probably the largest unsolved
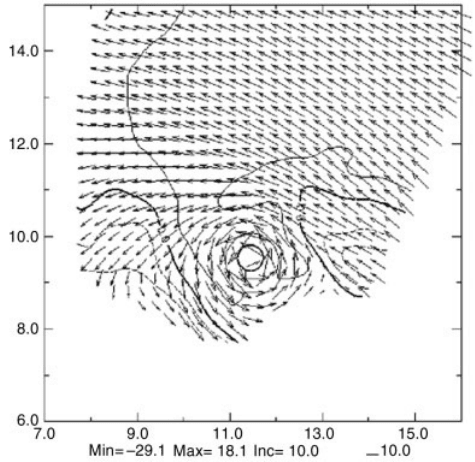
problem in radar meteorology today. An example of a dual-Doppler recons truction
of the vector wind field near and in a tornado is shown in Figure 13.
Rarely, three or more radars are in close enough proximity that the vertical
component of the raindrop motion vector can be calculated directly. This method
is called triple-Doppler and is exclusively a research technique.
There are two major limitations to multiple-Doppler techniques. The first is that
radars are very expensive. Multiple-Doppler data is only affordable in a small frac-
Figure 11 Dual-Doppler network with radars measuring motion of raindrops from different
vantage points. The different Doppler radial winds (red and green) are combined mathema-
tically to produce the horizontal projection of the true raindrop motion vector (blue). See ftp
site for color image.
Figure 12 Since the vertical component of motion is rarely measured directly, the equation
of mass continuity is usually used (sometimes in very complex formulations) to derive the
vertical component of air motion. The physics of the method is very straightforward. If
divergence is observed at low levels (right), then air must be coming from above to replace the
departing air, implying a downdraft. See ftp site for color image.
912
RADAR TECHNOLOGIES IN SUPPORT OF FORECASTING AND RESEARCH
tion of short-term research experiments and rarely in operational applications. The
second is that the observations of weather targets by the different radars may occur at
different times, sometimes a few minutes apart. Rapid evolution of some of the most
interesting phenomena between these observations will contaminate the calculated
vector wind fields.
A common expression among multiple-Doppler users is ‘‘you always get a
vector,’’ meaning that the technique always produces a result, but the result can
be quite bogus. Multiple-Doppler and single-Doppler reconstructions should
always be viewed with a sceptical eye.
Bistatic Radars
When the transmitted radar beam interacts with raindrops, only some of the
reemitted energy travels back toward the transmitter. Most is scattered in other
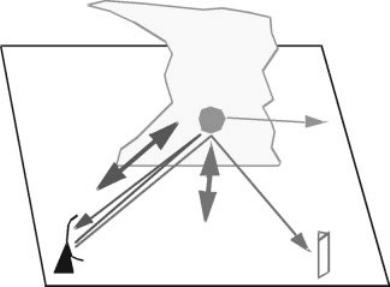
directions. The bistatic radar technique involves placing small passive radar recei-
vers (Fig. 14) at various places to measure this stray radiation. The data from the
bistatic receivers is combined with that from the transmitter using a variation on
standard multiple-Doppler formulations.
The biggest advantage of the bistatic technique is the comparatively low cost of
the bistatic receivers, less than 10% that of a WSR -88D. Several to many receivers
Figure 13 Dual-Doppler analysis showing horizontal component of the vector wind field in
a tornado. Contours are Z with the small circle representing the low Z ‘‘eye’’ of the tornado.
The axes are labeled in kilometers. Peak winds are about 60 m=s. (Courtesy Y. Richardson.)
4 GOAL: TRUE WIND VECTORS 913
can result in more accurate data at a low cost. Another advantage is that the observa-
tions of individual weather targets are made simultaneously since there is only one
source of radar illumination. Rapidly evolving weather can be well resolved. Thus
two of the major limitations of traditional dual-Doppler networks are avoided.
Cur rently there are several research bistatic networks. Data from one are illu-
strated in Figure 15. It is anticipated that operational networks and operational
computerized forecast models will use bistatic data in the future.
5 DATA ASSIMILATION INTO COMPUTER MODELS
Computerized weather forecasting models require accurate initializations to produce
meaningful predictions. A major thrust of current modeling research involves how to
best introduce radar data into these initializations, particularly into mesoscale simu-
lations. Some models have successfully ingested both reflectivity and single-
Doppler-retrieved wind fields, but none are yet used operationally.
6 NEW AND NONCONVENTIONAL TECHNOLOGIES
Dual and Multiple Polarization Radars
Most radars emit microwaves with just one polarization. This means that when they
cause charge to move in raindrops as discussed above, the charge moves one direc-
tion then the opposite (say left, then right), but the charge distrib utions in other
directions (say up and down) are largely unaffected. The intensity of microwaves
Figure 14 Bistatic dual-Doppler network with receive-only radar (red) measuring a different
component (red arrow) of the raindrop motion vector (blue arrow) than the transmitter (green
arrow). The components are combined mathematically in a fashion similar to that used in
traditional dual-Doppler radar networks to calculate the horizontal projection of the raindrop
motion vector (blue arrow). See ftp site for color image.
914
RADAR TECHNOLOGIES IN SUPPORT OF FORECASTING AND RESEARCH

emitted by a drop is proportional to D
6
. But, large raindrops are hamburger bun
shaped, ice particles have many shapes, and hail and insects can be very irregular.
The intensity of the emitted microwaves is proportional to the D
6
in the direction of
polarization of the radar.
It is possible to obtain information about the shape of the rain or ice particles by
transmitting both horizontally and vertically polarized radiation. (There are other
exotic techniques too, like using circularly polarized radiation, or radiation polarized
at intermediate values between H and V.) If the beam hits a large hamburger-shaped
drop, more horizontal energy will return than vertical energy (Fig. 16). The sixth
power dependence means that small differences in D
h
and D
v
can cause large
Figure 15 Bistatic dual-Doppler horizontal wind field. The transmitter (T) and passive,
receive-only radar (R) are located 35 km distant. Z field is shaded. Data from NCAR CASES
experiment in Kansas in 1997. See ftp site for color image.
Figure 16 Oblate, hamburger-shaped raindrops scatter much more horizontally polarized
energy than vertically polarized energy. See ftp site for color image.
6 NEW AND NONCONVENTIONAL TECHN OLOGIES 915
