Potter T.D., Colman B.R. (co-chief editors). The handbook of weather, climate, and water: dynamics, climate physical meteorology, weather systems, and measurements
Подождите немного. Документ загружается.

this type of light during the daytime. The angle of the cloud hits were displayed
automatically at the observers console.
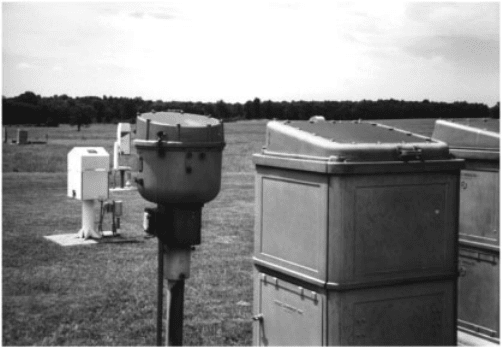
The next version of cloud height indicators was the rotating beam ceilometer. As
the name implies, the beam of light rotated, and the vertically looking detector
measured any cloud hits directly overhead. See Figure 16. The angle of the cloud
hits was displayed either on a scope or on a recorder chart. Height measurements
were limited to heights no greater than 10 times the baseline. Above this ratio, the
value of the tangent function increased too quickly to ensure the accuracy of a
measurement.
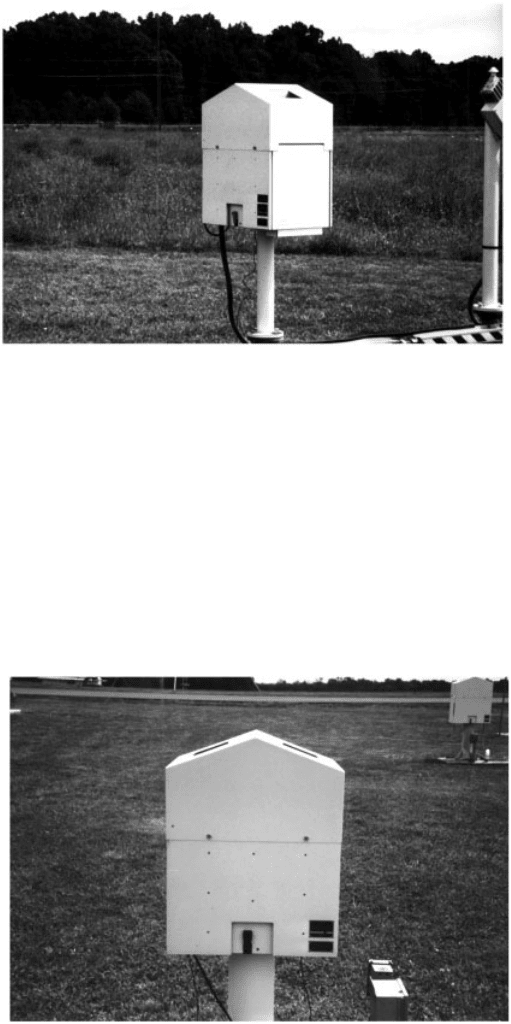
The latest cloud height indicator is one that was put into use in 1985. This sensor
sends laser pulses vertically into the atmosphere. The pulse rate varies with
the temperature to maintain a constant power output. The time inter val between
the pulse transmission and the reflected reception determines the height of the
clouds. The reporting limit of this instrument had been 3800 m (12,000 ft). Indicators
are now available with a range of 7600 m (25,000 ft). See Figures 17 and 18.
9 VISIBILITY
In the 1940s, attempts were made to automate visibility observations for aircraft
carriers. Because of motion problems, these attempts were not fully successful. Work
continued in this area and, in 1952 a system became operational at the Newark, New
Jersey, airport. This airport was located in the meadowlands adjacent to Newark Bay
and experienced dense fogs. An interesting aside was the effect of the fog on
the adjoining New Jersey Turnpike. Large propellers were installed at the top of
poles by local authorities along the turnpike to disperse the fog, but the attempts
were unsuccessful.
Figure 16 Fixed-beam ceilometer (cylindrical shaped) and rotating-beam ceilometer
detector on right. See ftp site for color image.
736
INSTRUMENT DEVELOPMENT IN THE NATIONAL WEATHER SERVICE
Runway visibility measurements were important to aviation for landings and
takeoffs. A fixed intensit y visible beam of light was transmitted horizontally
toward a receiver along a baseline of 500 ft. The height of the sensors was at 5 m
(14 ft) above the centerline of the runway, the average height of an aircraft cockpit of
that time period. The particulates in the air attenuated the light beam. The photons
arriving at the receiver photodiode generated a small current, and an extinction
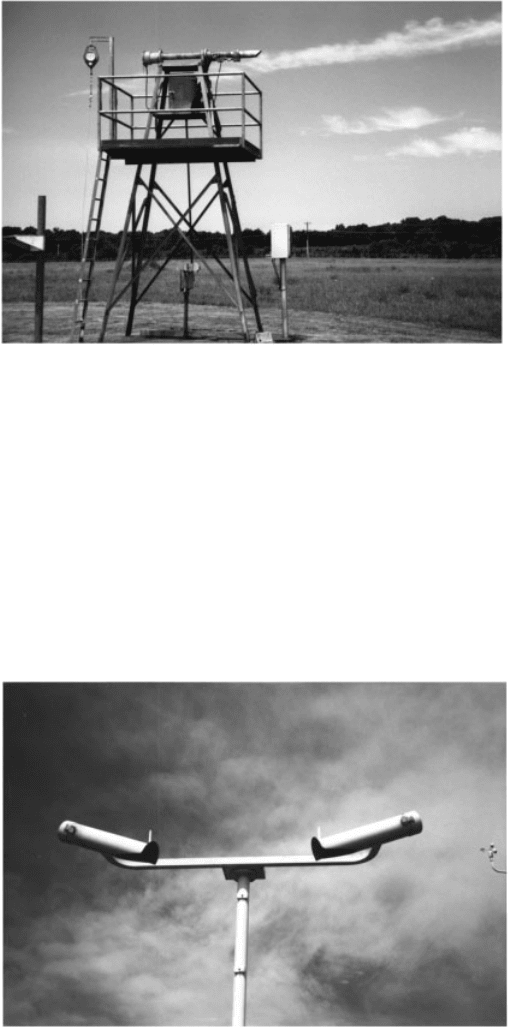
coefficient was determined. This system was called a transmissometer. See
Figure 19. The transmissometer readings were converted to meteorological visibility
at this time. In 1955, Runway Visual Range (RVR) was implemented. In addition to
the transmissometer reading, this system took into account the light setting or
Figure 17 Laser beam ceilometer. See ftp site for color image.
Figure 18 Laser beam ceilometer showing transmitter and receptor windows. See ftp site for
color image.
9 VISIBILITY 737
intensity of the runway edge lights and whether it was day or night by the use of a
photometer. Daytime readings were based on the attenuation of contrast, while
nighttime readings were based on the attenuation of flux density. The derived
visibility was expressed in increments of 200 ft below 4000 ft and increments of
500 ft above 4000 ft. The initial range of values was from 1000 ft to 6000þft.
Transmissometer baselines were lowered to 250 ft at certain airports to permit
RVR readings down to 600 ft.
A forward scatter visibility sensor was developed in the 1970s. A beam of light is
emitted from a projector and is scattered forward by any particulates in the air to a
receiver. See Figure 20. The axis of the projector and the receiver are placed a few
Figure 19 Transmissometer. See ftp site for color image.
Figure 20 Forward scatter visibility sensor showing projector and receiver. See ftp site for
color image.
738
INSTRUMENT DEVELOPMENT IN THE NATIONAL WEATHER SERVICE
degrees apart to prevent any direct detection of the beam of light. The light source is
visible xenon light pulsed twice per second. The sampling volume is 0.75 ft
3
.An
extinction coefficient is determined and a sensor equivalent visibility is determined
with day=night input from a photometer. Experiments were conducted using infrared
light, but it was found to be inferior to visible light, especially with cer tain
atmospheric par ticles such as haze.
10 CALIBRATION, MAINTENANCE, AND QUALITY
CONTROL OF INSTRUMENTS
Obtaining quality meteorological sensors and locating them according to siting and
monitoring standards are only the first steps in establishing a quality data acquisition
network. Provisions need to be made for maintenance, calibration, and quality
control.
Sensors are usually calibrated initially at the factory but sometimes need to be
recalibrated at the site because of shipping and site peculiarities. The sensors also
need to be recalibrated from time to time because of mechanical and electrical
drifting. Recalibration intervals vary with each type of sensor. Data network
managers need to know what initial calibration was done, when the sensors need
periodic calibration, and have procedures in place to ensure proper calibration.
Sensors fail and maintenance philosophies vary. They range from on-site repair to
replacing the failed sensor, to abandonment. Another consideration is the availability
and location of maintenance, the required response time and the cost.
Sensors produce data, but procedures need to be in place to determine if the data
produced are within the sensor specifications. Users will usually detect grossly bad
data. However, a lack of knowledge about local climatology or subtle changes
occurring with time or particular weather events, where a number of different
weather conditions are possible, may result in bad data going undetected. A moni-
tor(s) needs to quality control the data from a network to ensure its quality. If the
equipment is malfunctioning, this person needs to notify the appropriate mainte-
nance personnel.
When a network is new, the above issues may not seem important, but with the
passage of time, they become the most important issues threatening data quality,
continuity, and availability.
11 TELEMETRY AN D AUTOMATION
The sensors described previously are part of the surface and hydrologic data
networks. The most familiar parts of this network are located at airports throughout
the country. Observations from these networks were usually transmitted by teletype-
writer. These observations from a large-scale network were essential for forecasting
and making specific point observations. They fell short, however, in providing
sufficient data for the hydrologic, marine, agriculture, climatic, and fire weather
11 TELEMETRY AND AUTOMATION 739
programs. In the early years of the NWS, data from these off-airport networks were
taken manually and relayed to a weather office either by telephone or by radio .
Sometimes data took hours to reach a forecast center. There was the time interval
between the observation and the phone call. More time delays were caused by busy
phones at a collection center and the time needed to relay the report to a forecast
center by phone, radio, or teletypewriter. In every step, there was a chance for human
error.
In 1945, a three-station experimental network was deployed south of Miami to
report pressure, wind speed, and direction every 3 h. The data were transmitted by a
radio powered by batteries that were charged by a wind generator. Data were deci-
phered by the position of an information pulse between two reference pulses.
During these early years of automation, the emphasis in systems development
was on telemetering hydrometeorological parameters. Systems were designed that
would permit data to be transmitted from a remote sensor to a collecting office by
hardwire, telephone line, or radio . See Figure 21. Sensors were designed with cams,
coded discs, weighing mechanisms, potentiometers, shaft encoders, and other appa-
ratus that would transform analog data into an electrical signal. In general, these
signals had to be manually decoded at a collection center by counting beeps.
In the 1960s, the transistor era, plans were made to automate at least part of this
network for three reason s. The first was to make it possible to obtain data from sites
where observers were unavailable. Second, data were needed to be available at any
time to make forecasts and warnings timelier. The third reason was to reduce the
workload at weather offices. During weather emergencies, many hours were required
to manually collect data by telephone.
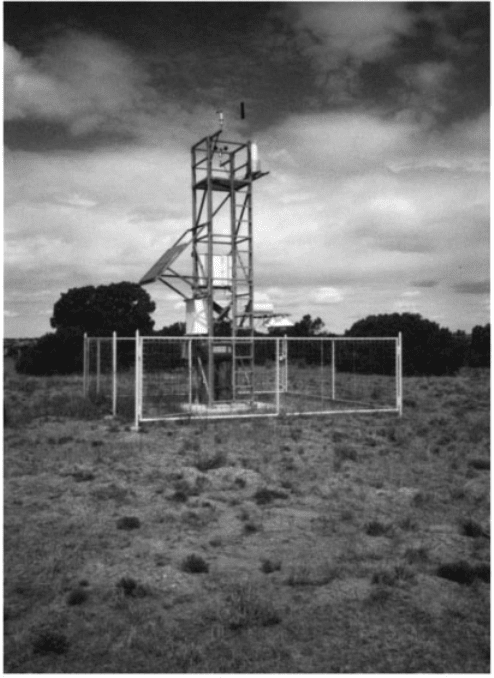
An automated hydrometeorological observing system was developed using solid-
state electronics. Data were collected via telephone from remote instr uments
connected to a collection device and powered by battery and solar cells. See
Figure 22. The remote system transmitted a fixed-format, variable-length message
coded in Ameri can Standard Code for Information Interchange (ASCII) format. In
this same time period, the Geostationary Operational Environmental Satellites
(GOES) with communications relay facilities became available. Now data could
be made accessible from areas where no or unreliable telephone service was
available.
With time, further improvements were made. Automatic event reporting sensors
replaced sensors reporting only on a fixed schedule to improve sampling for small
areas and short events. These data are also being used to provide ground truth for
satellite imagery and Doppler radar. This was a big step from when the beam from
the old WSR-57 radars was stopped above a rain gauge equipped with a transponder.
The amount of precipitation in the gauge was displayed as blips on the radar screen.
Almost any analog or digital sensor can now be interfaced to a microprocessor-
based data collection system. The first level of processing converts raw sensor data
to engineering units. The second level is used to determine such things as
maximums, minimums, means, variances, standard deviations, wind roses,
histograms, and hydrographs. Simple or sophisticated algorithms allow transmis-
sions to be sent following an out-of-limits reading on a specific sensor.
740 INSTRUMENT DEVELOPMENT IN THE NATIONAL WEATHER SERVICE
Systems such as the GOES Data Collection System also afford effective data
sharing among agencies rather than what agencies would encounter using their own
independent systems. The data from the approximately 14,000 remote sites in this
coordinated network, not only provide data for forecasting and warning needs but
are also cost-effective to the taxpayer when interagency duplication is avoided. See
Figure 23.
12 IMPORTANCE OF STANDARDIZATION AND CONTINUITY
Users of meteorological data can only validly compare those data that have been
collected by standard methods. This conformity makes it possible to determine
meteorological patterns and how they are changing with time. Good standards
Figure 21 Early remote automated meteorological observing system (RAMOS), late 1960s.
See ftp site for color image.
12 IMPORTANCE OF STANDARDIZATION AND CONTINUITY 741
evolve from a process that involves many of the users with their various interests.
When the needs of participants such as academia, government, and the private sector
are considered, the results will be a consensus and consequently accepted and used.
Changes in instrument types, modifications, and relocations are inevitable
because of economic and scientific reasons or for changes in individual user
missions. These changes need to be documented or data discontinuities will occur.
Users need to know the resolution, accuracy, and the temporal and spatial specifics
of each data site. This is becoming more important with the many studies being
conducted on the state of the environment and determining changes in it. There is
increasing cooperation among data providers within certain disciplines, but generally
there is a lack of understandi ng across these disciplines with regard to data stan-
dards, quality, and continuity. See Figures 24 and 25. Without this cooperation, we
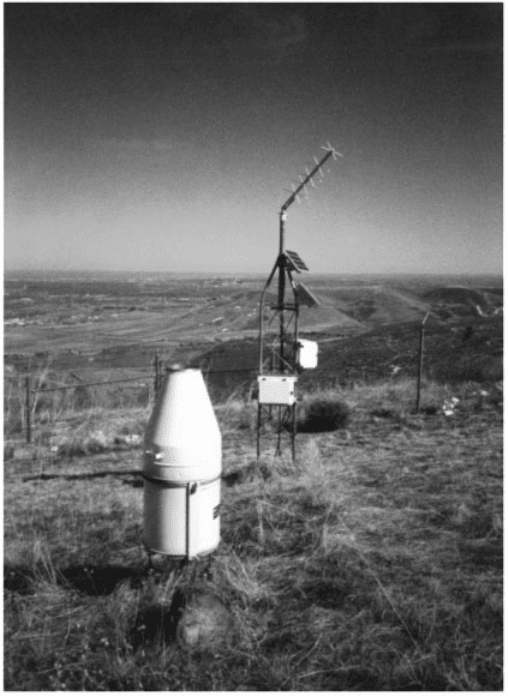
Figure 22 Automated hydrologic observing system (AHOS) with GOES radio transmitter
and antenna in background. See ftp site for color image.
742
INSTRUMENT DEVELOPMENT IN THE NATIONAL WEATHER SERVICE
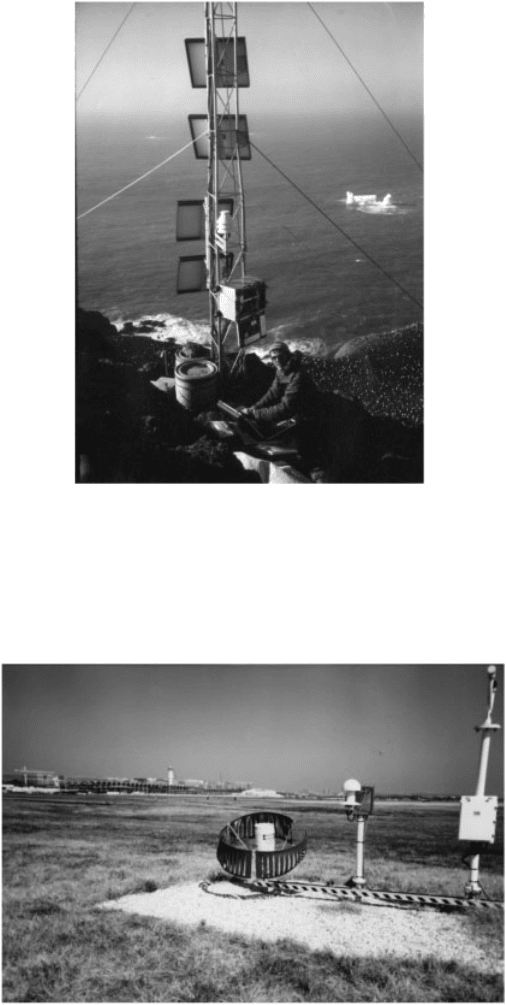
Figure 23 Interagency automatic remote collector (ARC) using satellite communications on
Macaroni Ridge in Antarctica. Weather data are used in penguin breeding studies. Hundreds
of penguins in lower right background. See ftp site for color image.
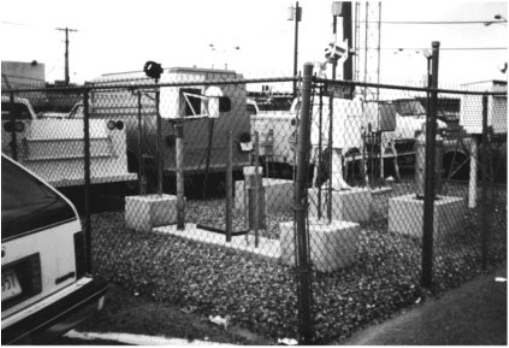
Figure 24 Sensors located too close to a jet takeoff area. Windscreen around the rain gauge
is damaged from jet blast. Blast also causes temperature to rise and wind gusts to increase. See
ftp site for color image.
12 IMPORTANCE OF STANDARDIZATION AND CONTINUITY 743
will not be able to determine whether we are measuring changes in the environment
or just variations in the data system.
BIBLIOGRAPHY
Cornick, J. C., and T. B. McKee (1993). A Comparison of Ceiling and Visibility Observations
for NWS Manned Observation Sites and ASOS Sites, Atmospheric Science Paper #529,
Colorado State University, Fort Collins, CO.
Federal Aviation Agency and Department of Commerce (1965). Aviation Weather for Pilots
and Flight Operations Personnel, Washington, DC, U.S. Government Printing Office.
Flanders, A. F., and J. W. Schiesl (1972). Hydrologic data collection via geostationary satellite,
IEEE Trans. Geosci. Electro. GE-10(1).
Kettering, C. A. (1965). Automatic Meteorological Observing System, Weather Bureau
Technical Note 12-METENG-16.
National Weather Service (1995). Federal Meteorological Handbook No. 1, Surface Observa-
tions, FCMH-1, Washington, DC, U.S. Government Printing Office.
Schiesl, J. W. (1958). Measurement of Dynamic Strain, Needle Research Repor t, Singer
Manufacturing Company, Elizabethport, NJ.
Schiesl, J. W. (1976). Automatic Hydrologic Observing System, Paper presented at the
International Seminar on Organization and Operation of Hydrologic Services, July 1976.
Ottawa.
U.S. Depar tment of Commerce, National Oceanic and Atmospheric Administration (1994).
Federal Standard for Siting Meteorological Sensors at Airports, FCM-S4-1994.
U.S. Depar tment of Commerce, National Oceanic and Atmospheric Administration (1997).
National Geostationary Operational Environmental Satellite (GOES) Data Collection
System (DCS) Operations Plan, FCM-P28-1997.
Figure 25 Sensors poorly exposed in a parking lot. See ftp site for color image.
744
INSTRUMENT DEVELOPMENT IN THE NATIONAL WEATHER SERVICE
U.S. Department of Commerce, Weather Bureau (1963a). Manual of Barometry, Washington,
DC, U.S. Government Printing Office.
U.S. Department of Commerce, Weather Bureau (1963b). History of Weather Bureau Wind
Measurements, Washington, DC, U.S. Government Printing Office.
BIBLIOGRAPHY 745
