McKinney J.D., Warnick C.C. Microhydropower Handbook Volume 1
Подождите немного. Документ загружается.

..:
_. ..- -._. . . - - _ _
- Pipe diameter (inj
1 5 10 50 1mJ
L
A.
I
v
---. .-.d
1.0 to 10 10 to '100 L:iL- .:
Flow (cfs)
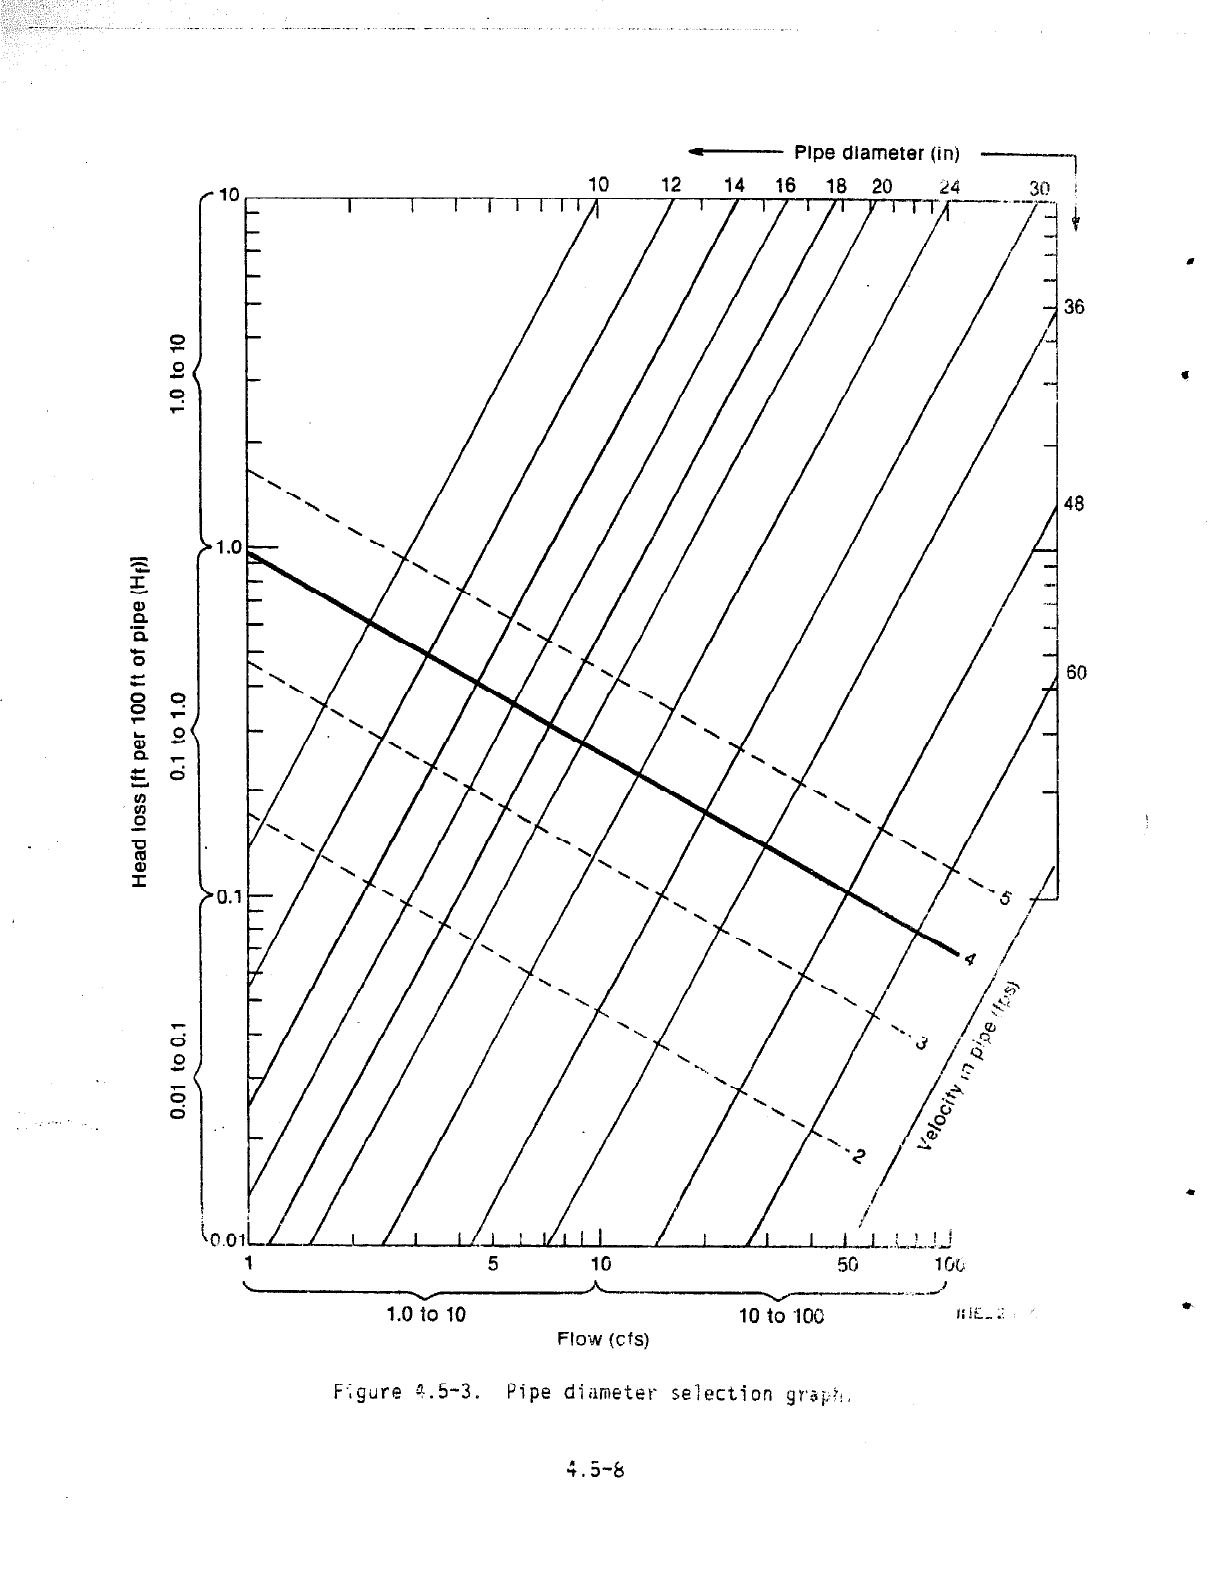
F;gure 4.5-3.
Pipe diameter- selection grsF"+.
4.5-b
.
selection.
A range of fltn values is shown at the bottom of each graph.
If the design flow is between 0.1 cfs to 10.0 cfs, use the first graph, and
if it is from 10.1 cfs to 100 cfs, use the second graph. Consult the
. manufacturer if the design flow is more than 100 cfs.
1.
On the appropriate graph, find your design flow.
L
NOTE: The graph is on log paper. The range of flow values
is marked tith brackets (i.e., 0.1 cfs to 1.0 cfs). As
examples, fxow readings ,of 0.32 cfs and 7.2 cfs are shown
with small arrows at the bottom of the graph on Figure 4.5-2
2.
Draw a vertical line up from the design flow value to the recom-
mended velocity iine (the 4 fps line running diagonally line from
the upper left amner to right center). The intersect point with
4 fps will be bucketed by two pipe diameter lines (diagonal lines
running from the upper right to the lower left). Either of the
bracketing penstock sizes can be used, but it is recommended that
the larger size be selected to keep velocity (and head loss) low.
Lower velocity vi11 also result in less water hammer. A penstock
head loss of 5 ti 10% of the pool-to-pool head can be a reasonable
design starting *Point.
.
l\..-/
The actual veloci;ty of water in the penstock will be the point at
which the vertial line representing flow intersects the selected
pipe size line imnd will probably be slightly lower than 4 fps if
the larger pipe size is chosen.
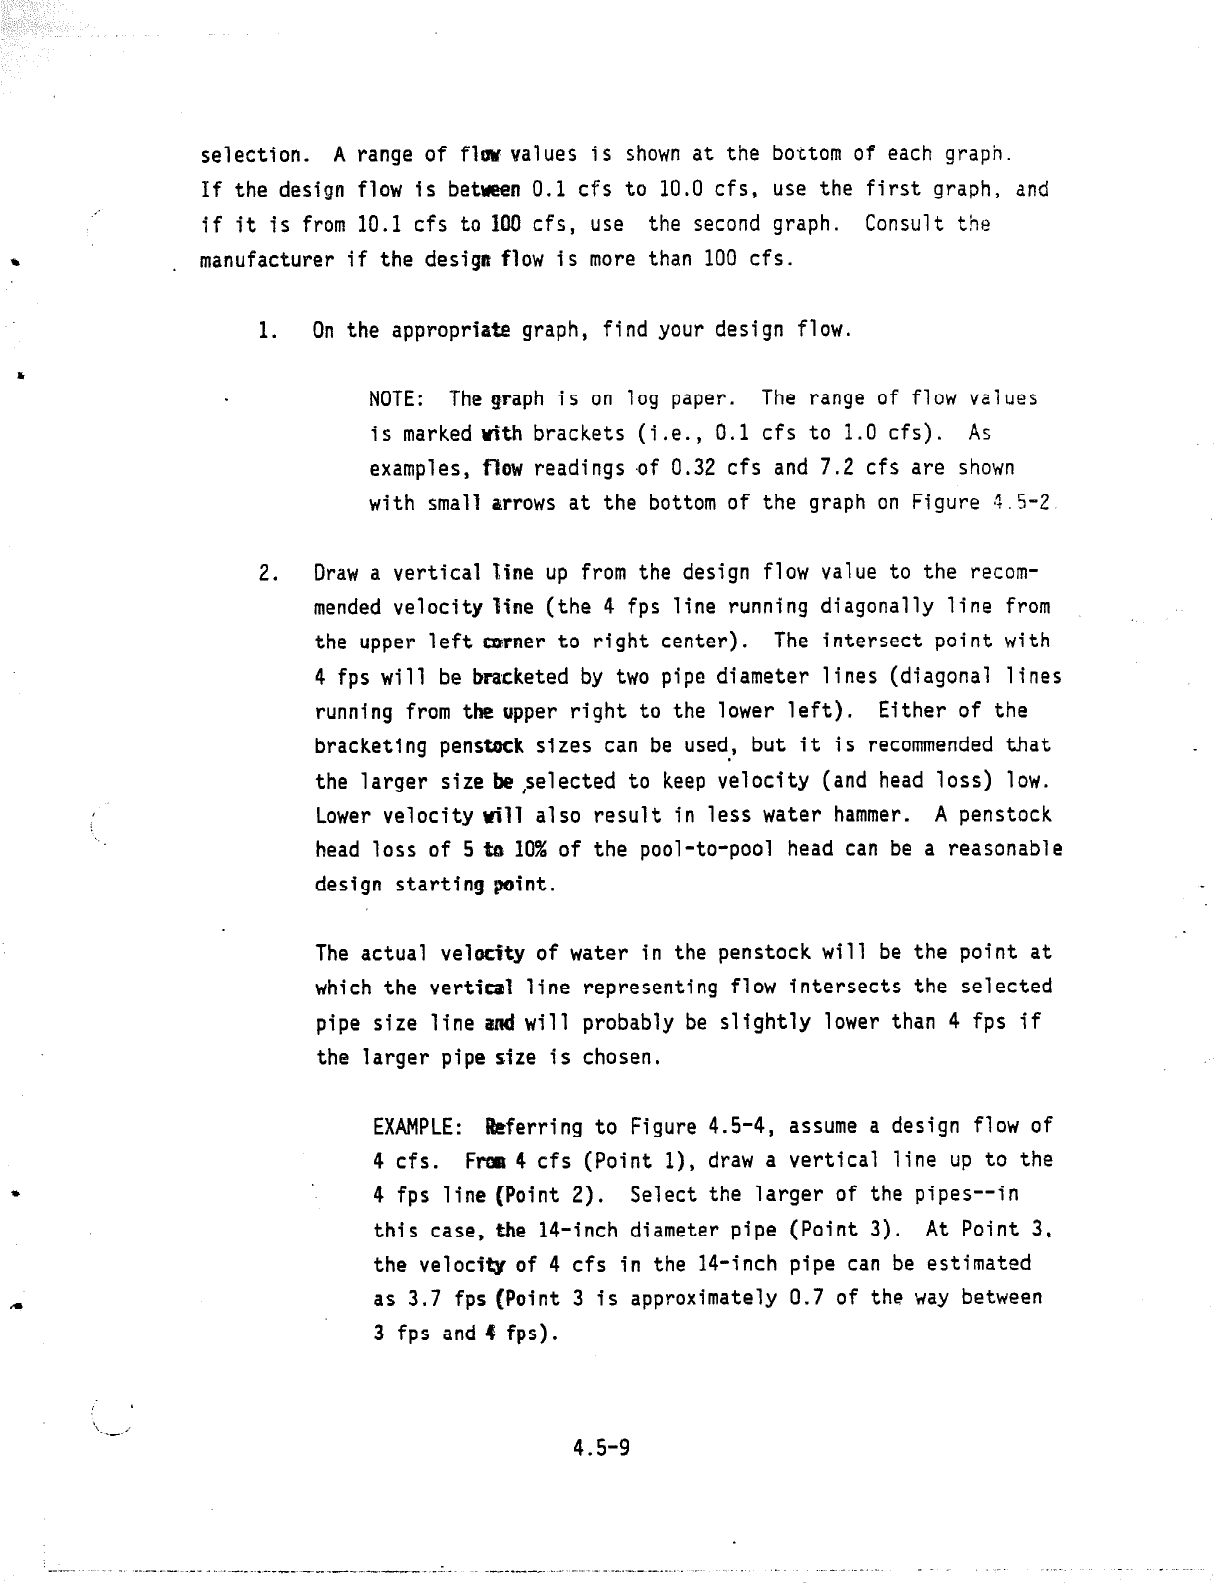
EXAMPLE: Referring to Figure 4.5-4, assume a design flow of
4 cfs.
Frvra 4 cfs (Point l), draw a vertical line up to the
4 fps line [Point 2).
Select the larger of the pipes--in
this case, the 14-inch diameter pipe (Point 3). At Point 3,
the velocity of 4 cfs in the 14-inch pipe can be estimated
as 3.7 fps [Point 3 is approximately 0.7 of the way between
3 fps and 4 fps).
4.5-9
_._-. _ ..__. -~.__ . ___.._.___ ___c___.____ .I.
._______. . ..__._.. ---
- Pipe diameter (in.)---1
4
6
8
10 12
Flow (cfs)
rd%ZL 2 -*
14
16
18
20
24
FicJure 4.5-d.
Pipe diarwier sclectior ?xad:~l;ie.
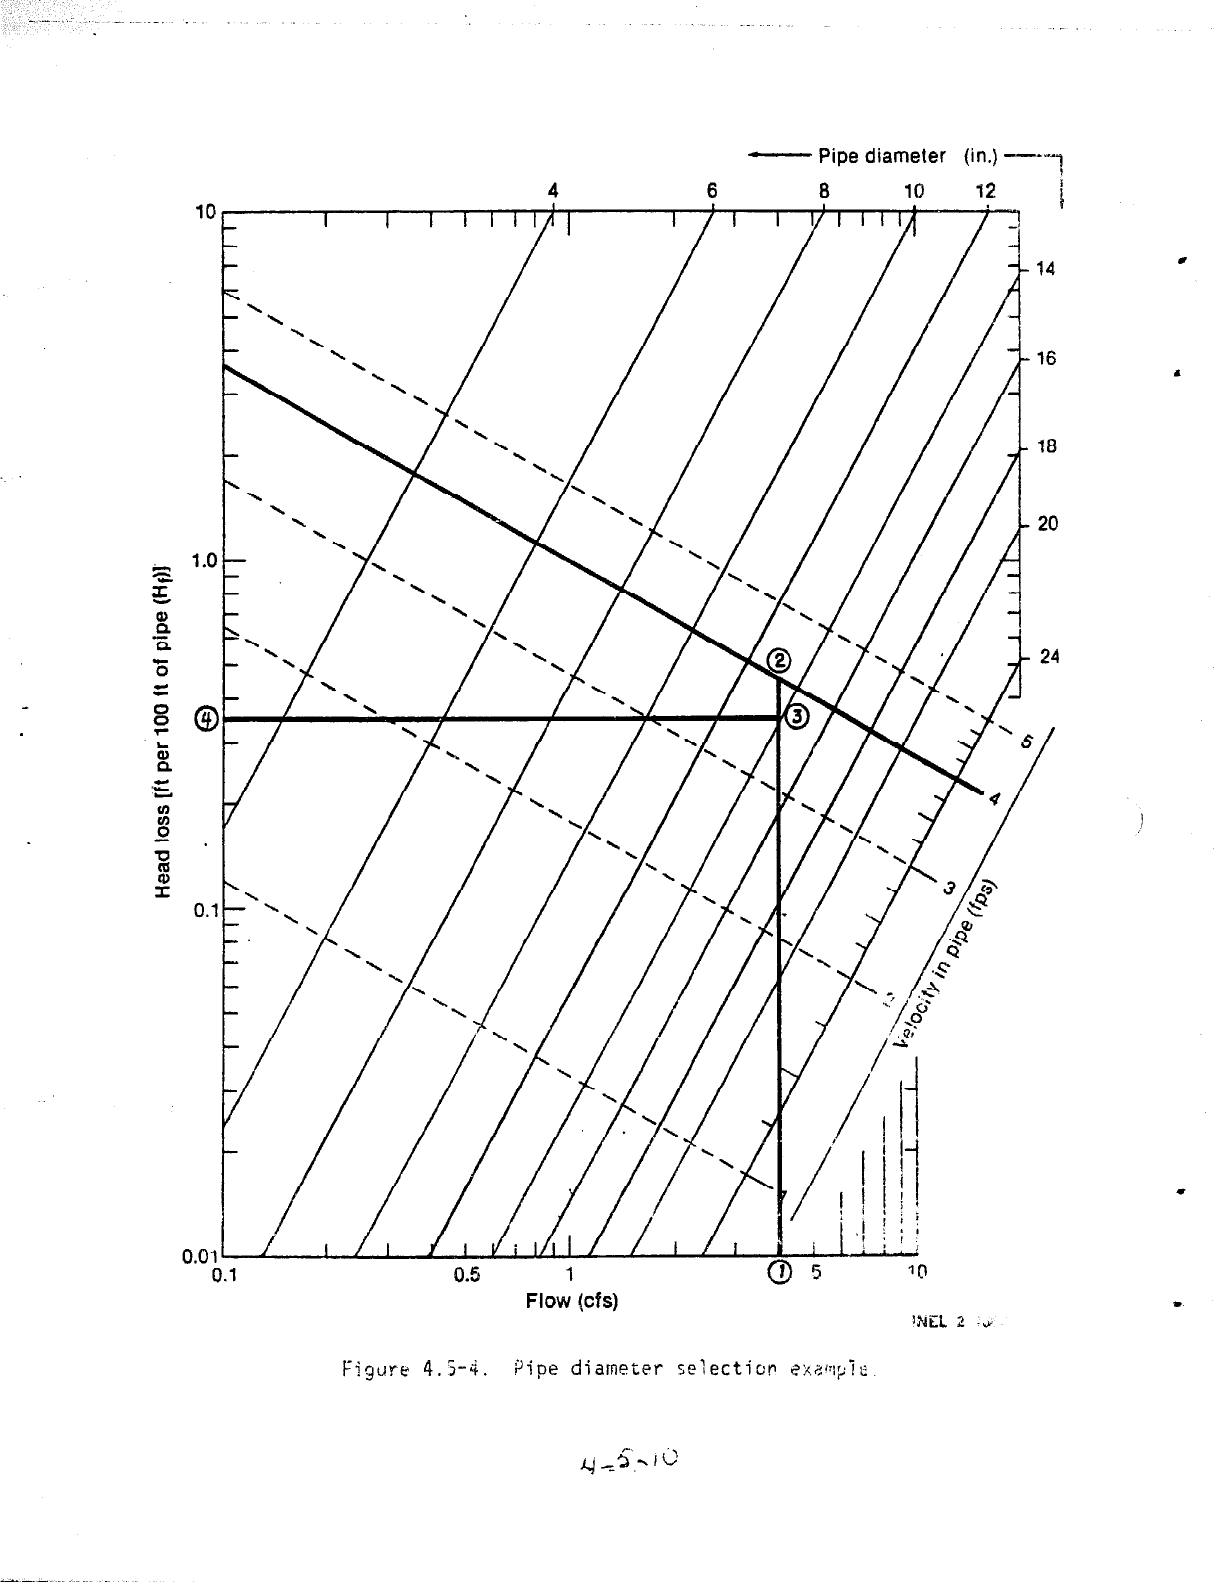
3.
From the pipe size intersect (Point 3), draw a horizontal line to
the left side of the graph. The numbers on the left side of the
graph represent the head loss per 100 feet of pipe length.
i
\.
EXAMPLE: From Point 3, draw a line to the left side of the
graph (Point 4).
At Point 4, read the head loss factor as
0.34 ft per 100 feet of pipe. The actual loss depends on
pipe material.
int 3 in the 4. Record the penstock diameter and actual velocity (PO
example) and the friction loss factor (Point 4).
4.5.4.2 Selecting Pipe Material.
It is now time to consider various
pipe material alternatives so that the actual friction losses can be calcu-
lated. Virtually any of the materials previously discussed can be used,
but experience indicates that two materials, PVC and steel, stand out as
the most likely choices for the greatest number of installations. As pre-
viously stated, local and site specific factors can influence material.
options and must be considered.
The selection of pipe material and pipe wall thickness depends on the
pressure that the pipe will experience. There are two types of pressure to
be considered:
0
Static pressure, which is the pressure at the bottom of the pipe
when the pipe is filled and the water is not flowing.
0
Pressure waves, which are caused when the amount of water flowing
is suddenly changed, as by opening or closing a valve.
Static pressure depends on the head in the penstock. Pressure waves
depend on how fast the flow changes in the penstock.
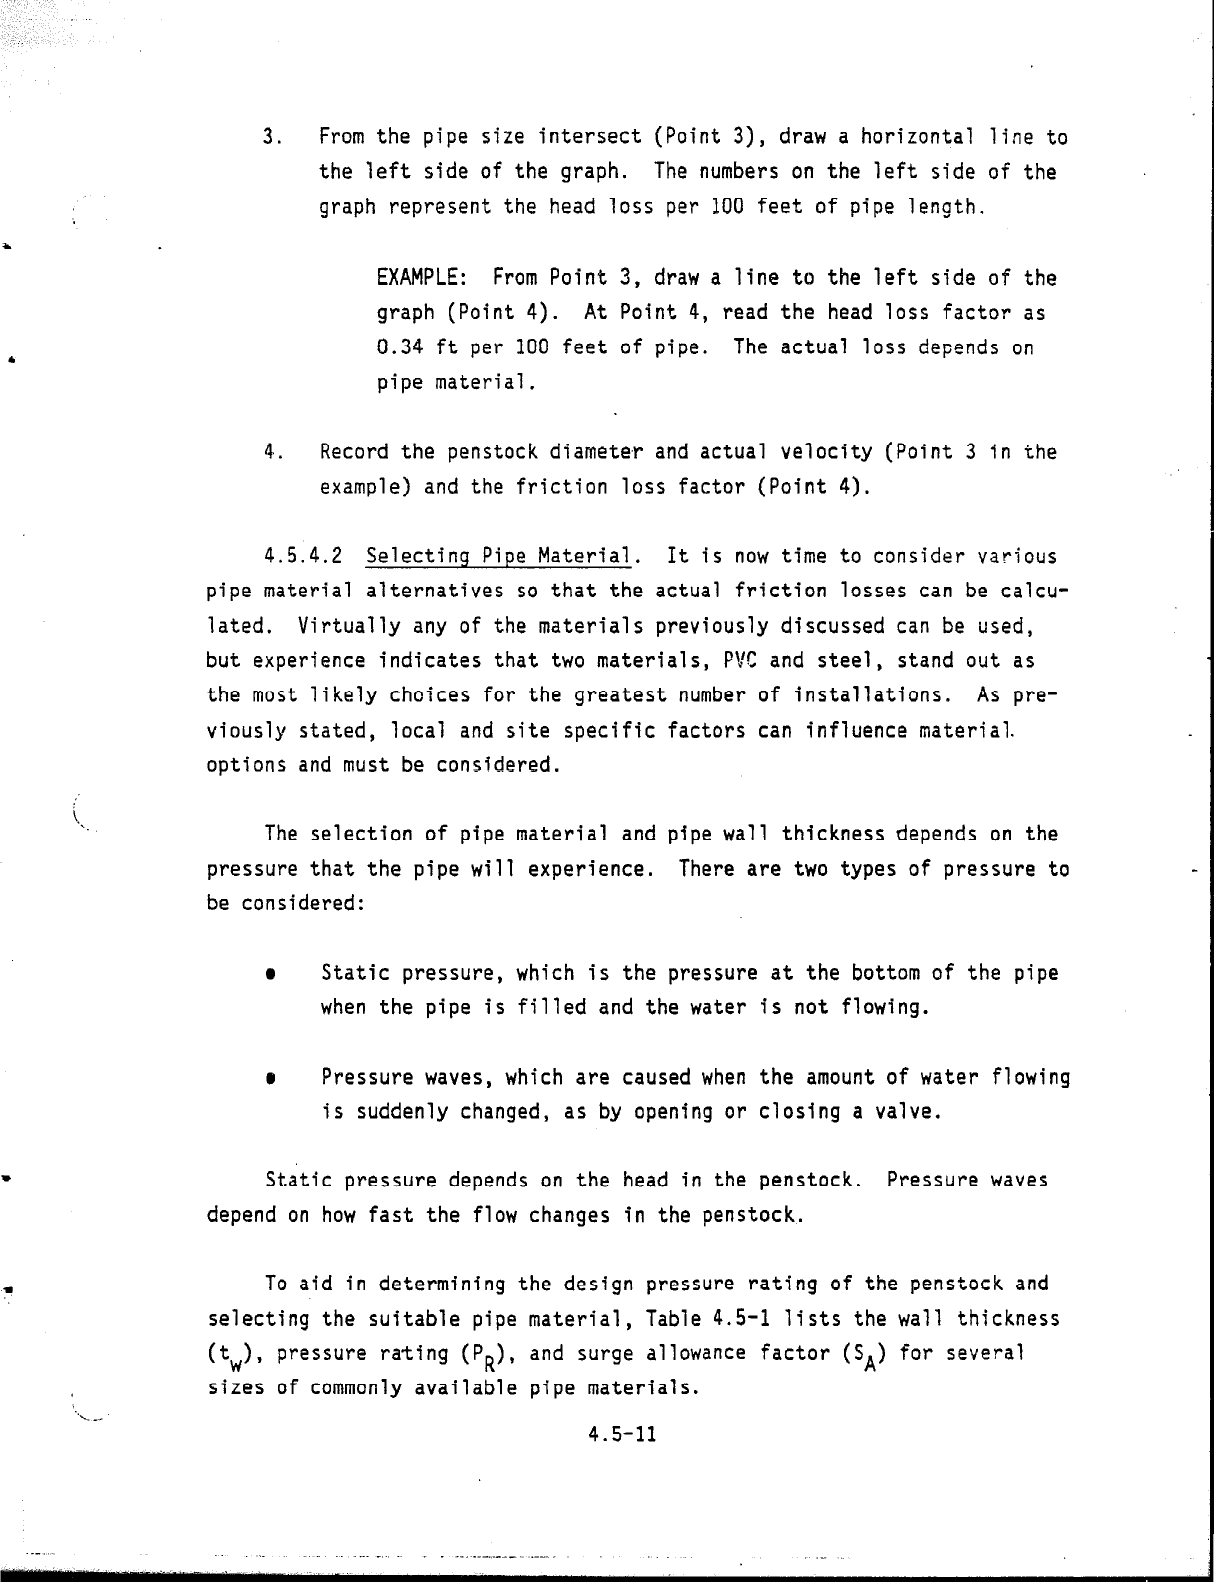
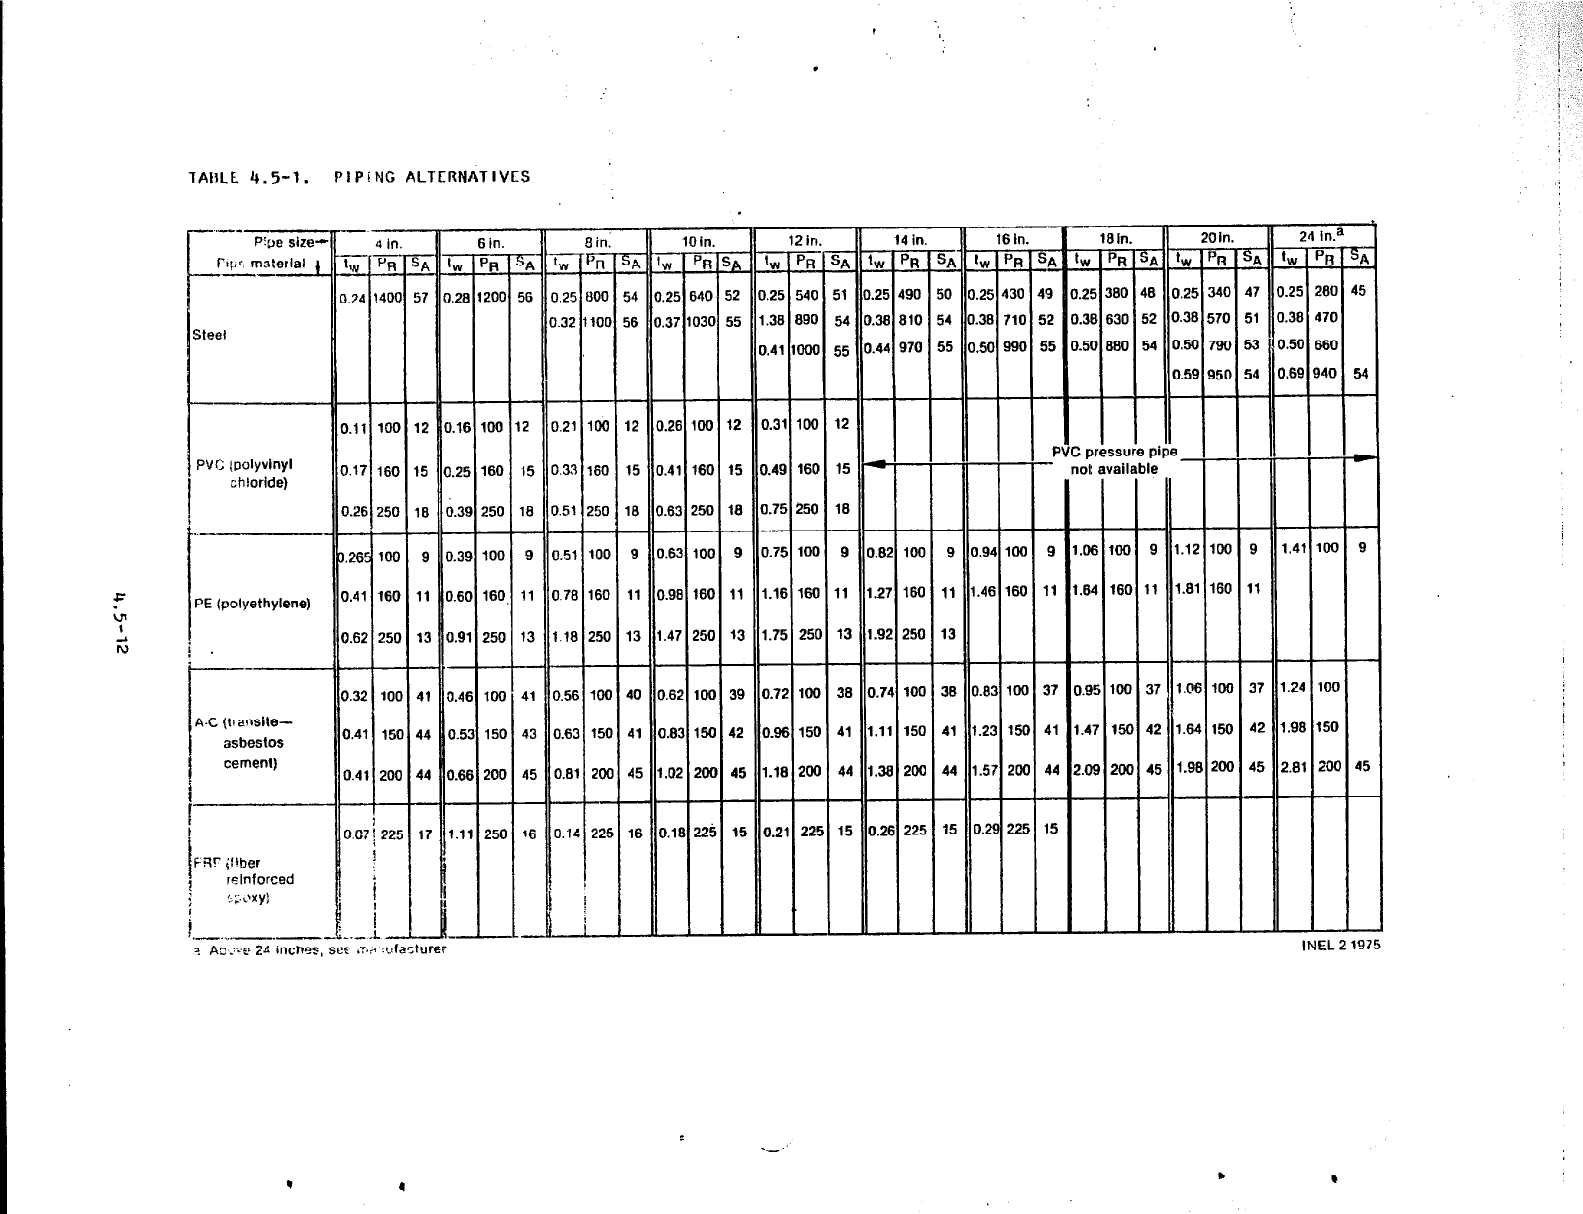
To aid in determining the design pressure rating of the penstock and
selecting the suitable pipe material, Table 4.5-l lists the wall thickness
(t,), pressure rating (P,), and surge allowance factor (SA) for several
sizes of commonly available pipe materials.
4.5-11
.
TAIILE 4.5-l.
PIPiNG ALTERNATIVES
--1_1
PVC (polyvinyl
I
chloride)
F
.
PE(polyethylene)
v1
1
6
i .
i--------
4 in.
--.
‘W
PR
3.24 1400
r
D.ll 100
D.17 160
0.26 250
A
17
-
2
5
8
-
9
II
13
-
$1
14
14
-
17
-
"WV
4
28
-
.16
.25
.39
-
.39
.60
.91
-
.46
6in.
a in:
1200
56 0.25 600
0.32 1100
100 12 0.21 106
160 15 0.33 160
250 18 0.51 250
100 9 0.51 100
160, 11 0.78 160
250 13 I.18 250
100 41 0.56 100
I
150 43 0.63 150
200 45 0.81 200
250 16 0.14 225
T
-
54
56
loin.
w
p R
.25 640
.37 1030
-
12
I.26 100
15 I.41 160
ia
-
9
I.63 260
1.63 100
11 I.98 160
13
-
40
.47 260
I62 106
41
45
-
16
1.83 15a
1.02 200
6.18 225
e
i2
i5
-
12
15
ta
-
9
11
13
-
39
42
45
-
15
-
12 in.
&pR.
25 540
38 690
,41 looa
.31 loo
.49 160
.75 250
.75 100
.16 160
.75 2%
1.72 100
1.96 15c
.1e 2oc
1.21 22!
5
51
54
55
-
12
15
la
-
9
11
13
-
38
41
44
-
15
-
14 in.
5
50
54
55
-
-
-
9
11
13
-
38
41
44
-
15
-
.a
6
2 II
1 II
61
41
82
In.
ix
40
r0
90
50
-
-
-
Do
60
-
00
50
00
-
-
24 in.=
w
4
25'
38
.50
.69
-
-
-
.41
-
.24
.9e
1.81
-
-
F
9
280
170
iB0
I40
-
-
-
tot
-
1OC
I50
2ol
-
-
i
5i
45
54
-
C
-
9
-
45
-
lNEL21975
P
i”
L-
The procedure for determining penstock pressure rating (design
pressure rating) is as follows:
1.
Using the total design head determined earlier in Subsection 4.3,
establish the static head on the penstock.
From the relationship
developed in Subsection 3.4.1 (1 foot of heat = 0.433 psi), the
static pressure can be determined by using Equation (4.5-l).
S = 0.433 x h
(4.5-l)
where
S
=
static pressure in psi
0.433 =
converts feet to psi
h. =
Yesign head in feet.
EXAMPLE: Assume that the head in Figure 4.5-l is 325 feet.
Use Equation (4.5-l) to find the static pressure in the
penstock at the turbine.
S
=
0.433 x h
S
=
0.433 x 325
S
=
141 psi.
2. Using the penstock diameter previously established, select frcm
,Table 4.5-l one (or more) potential pipe materials and select the
tw, PR'
and SA factors for these materials.
NOTE:
Select these factors for a pressure rating value (P,)
greater than the static pressure determined in Step 1 above. If
the head is large, the pressure value should be significantly
larger than the static pressure.
4.5-13
/
!
~_-..-- . .._. - . ._......_ __C^____.___.__. ~..
,..___.___.^_
-_-. _..-.._ ~_..
_ .__. ._.-..
--
-1
__ :
.>’ ’ “_-A .._.. .- _.I I.. ._.. - _. __
.-_ ._ _ ..--..-_..-..-
-.
EXAMPLE: Assume a 14-inch pipe and static pressure of
lb1 psi.
Select pipe materials from Table 4.5-l.
Steel:
All have a PR greater than 141 psi.
PVC:
Not available.
PE:
The PR is above 141 psi for both 1.27 and 1.92 tw,
but only the 1.92, with a PR of 250 psi, is
significantly above 141 psi.
AC: The PR is significantly above 141 psi only for the
1.38 tw, with a PR of 200 psi.
FRP:
The 0.26 tw has a PR = 225
psi.
Therefore, consider the following pipe material and thickness:
.
Steel: tW = 0.25, PR = 490, SA = 50
PE: tw = 1.92, PR = 250, SA = 13
AC: tw = 1.38, PR =. 200, SA = 44
FRP: tw = 0.26, PR = 225, SA = 15
3. For each pipe material selected,
use Equation (4.5-2) to determine
the penstock design pressure (Pd).
'd
= s + (SA x v)
(4.5-23
where
Pd =
penstock design pressure in psi
4.5:4
S
=
static pressure in psi, from Equation (4.5-l)
SA = surge allowance factor from Table 4.5-l
V
=
velocity of the water in the pipe in fps, from
Figure 4.5-2 or 4.5-3.
NOTE:
To use Equation (4.5-Z), mu'ltiply SA and v before
adding to S.
EXAMPLE: From the previous example, 5 = 141 psi, and from
Figure 4.5-4, v =
3.7; use Equation (4.5-2) to find the
design pressure for the pipes to be considered.
pd -
” s + (SA x v)
steel: Pd = 141 + (50 x 3.7)
PE:
AC:
FRP:
= 141 + 185
'd
= 326 psi
'd
= 141
.+ (13 x 3.7)
'd
= 189 psi
'd
= 141 + (44 x 3.7)
'd
= 303 psi
pd
= 141 + (15 x 3.7)
'd
= 196 psi
4.
The design pressure rating,
PR, must be greater than the Pd
value for the material and wall thickness selected.
If it is
not, recalculate the design pressure using the next thicker wall,
or select another material.
4.5-15
EXAMPLE: From Steps 2 and 3 above, the following is known:
Steel: PR = 490 psi, Pd = 326 psi
PE:
pR
= 250 psi, Pd = 189 psi
AC:
pR
= 200 psi, Pd = 303 psi
FRP:
pR
= 225 psi, Pd = 196 psi
Since the PR is larger than the Pd for steel, PE, and
FRP, these materials can be used. AC, with a PR smaller
than the Pd,
cannot be used in this example.
For pipe materials and wall thicknesses not included in Table 4.5-1,
you should contact the pipe supplier for the necessary information. The
data from the supplier will probably list wall thickness as (t), design
pressure as (P), and allowable surge pressure as (W).
4.5.4.3 Calculating Penstock System Head Loss. The next step is to
calculate the total penstock head loss.
The total losses are a function of
both turbulence and friction.
Turbulence is caused by the intake structure and by bends and obstruc-
tions in the pipe.
Turbulence factors canbest be considered by adding
equivalent pipe length to the overall length of the penstock to get the
adjusted length (La).
This can be done by the following steps:
0
Multiply the number of 90 degree bends by 30 feet
l
Multiply the number of 45 degree bends by 15 feet
.
0 Add 15 feet for the entrance at the intake
,
4.5-16
@
Add 100 feet for the turbine isolation valve
0
Sum all the additions and add to the
totai
penstock length.
.
EXAMPLE: From Figure 4.5-l:
0 each 90 degree bends
5 each 45 degree bends
5 x 15 = 75 feet
Intake structure--l5 feet
1 turbine isolation valve--100 feet
Total additions = 190 feet
The pipe length shown in Figure 4.5-l is 336 + 150 + 328
+ 87 = 9Oi feet; 901 + 190 = 1,091
feet. Adjusted length
(La) = 1,091 feet
Friction losses are a function of pipe size, length, and material. .
The friction effect is accounted for with the pipe material correction
factors shown in Table 4.5-2.
i
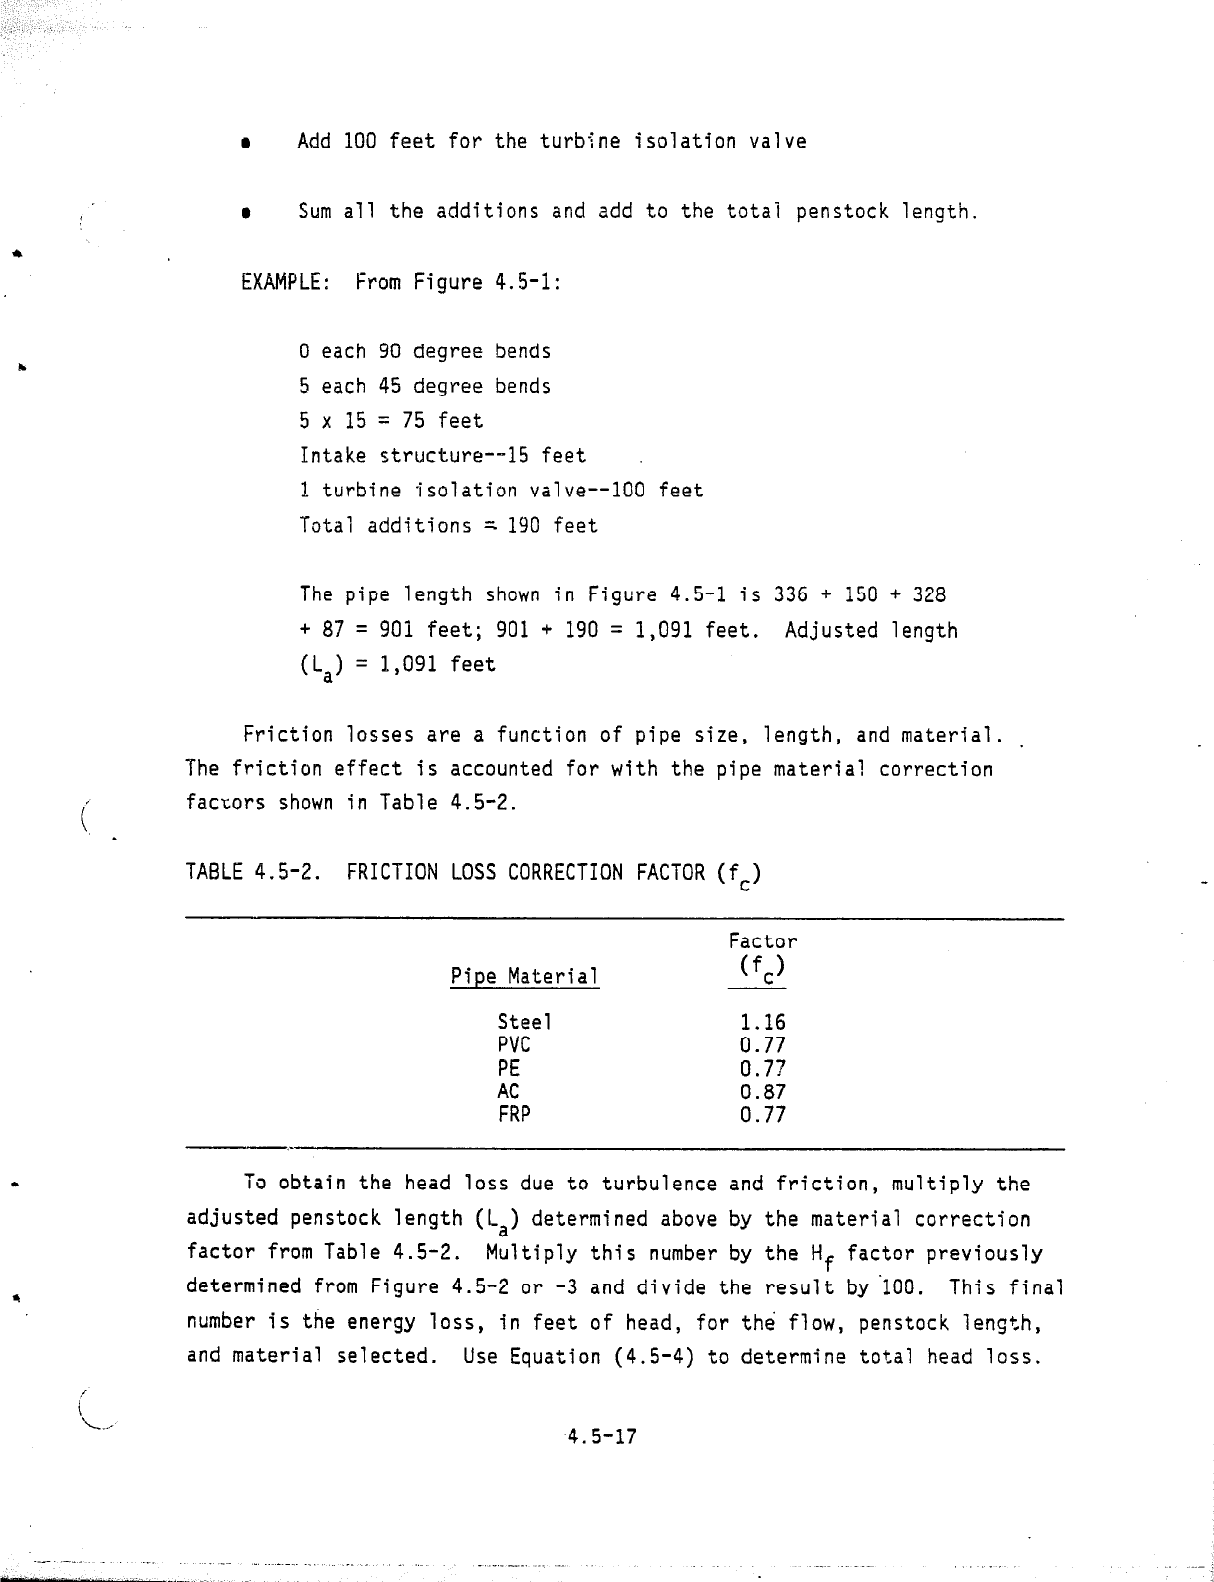
TABLE 4.5-2.
FRICTION LOSS CORRECTION FACTOR (fc)
i
l...-
Pipe Material
Factor
UC)
Steel
1.16
PVC 0.77
PE 0.77
AC
0.87
FRP
0.77
To obtain the head loss due to turbulence and friction, multiply the
adjusted penstock length (La) determined above by the material correction
factor from Table 4.5-2.
Multiply this number by the Hf factor previously
determined from Figure 4.5-2 or
-3 and divide the result by '100. This final
number is the energy loss,
in feet of head, for the flow, penstock length,
and material selected.
Use Equation (4.5-4) to determine total head loss.
.4.5-17