Marjoribanks R. Geological Methods in Mineral Exploration and Mining
Подождите немного. Документ загружается.

7.8 Core Logging Systems 119
being drawn to a common vertical down page (down hole) scale. When using such
a log, different features can be given different down hole depth ranges, and it is also
possible to indicate gradational contacts in a simple graphical manner. Further illus-
trations of graphical techniques that can be used in this type of logging are shown
in Fig. 7.17. An example of graphical scale logging (tailored for use in logging
volcanic sequences) can be found in McPhie et al. (1993).
Obviously, not all observations or measurements that can be made on core can be
shown graphically, so a graphical-scale log sheet should also provide extra columns
for recording digital data or for making verbal annotation, description or comment
of the rock or structure. Data relating to the frequency of some structural feature
(for example: number of fractures per metre or percent vein quartz per meter) can
be shown as a down hole histogram. If the core is oriented, individual structural
measurements are recorded directly as strike/dip/dip direction onto a column of the
form. If the core is not oriented, alpha angles (see Sect. 7.7) can be shown graphi-
cally (analog recording) in the mapping column, but can also be recorded digitally
in a separate column. Important details of structures or structural relationships that
are too small to be shown on the core maps, can be sketched into an unspecified, or
“Comments” column.
Graphical scale log forms, with several mapping columns along with extra
columns for recording digital data, sketches, verbal comment etc. can be as varied as
the number of prospects that are being drilled. However, the important feature about
all such logs is that they assemble many different types of geological observation on
one form linked by a single down page scale. All important relationships, but espe-
cially spatial relationships, can thus be seen at a glance. Graphical scale logs such
as described above are a powerful tool in helping to understand geology and to cor-
relate structures between holes. However, there is no doubt that such logs are slow,
even tedious, to prepare, and they are unsuitable for the intense drilling programs
of more advanced prospect exploration. Once an understanding of the geology of
a prospect has been gained (this may be after the first 1–2 holes or after the first
10–20 holes, depending on the complexity of the geology and the quality of the ini-
tial geological input), a simplified, more focussed and objective, logging process is
appropriate. That system is analytical spread sheet logging.
More information on using graphical scale log sheets, and a detailed explanation
of Fig. 7.16, will be found in Appendix A.
7.8.3 Analytical Spreadsheet Logging
Use of spread-sheet logging is indicated in second-phase drilling programmes
(resource evaluation and definition) where the main geological problems associ-
ated with the ore body have been solved, and the aim of the logging is the routine
recording of masses of reproducible data. It is also an ideal technique for recording
geological data obtained from rotary percussion (RAB and RC) drill cuttings. In
these holes, observations already come pre-divided into 1–3 m slices, and the range
of possible geological observation is limited.
120 7 Diamond Drilling
PERCENT QUARTZ (SULPHIDE etc.)
PER METRE
To 100 %
10 20 30 40 50 %0
0
GRAIN SIZE (mm)
massive
pyrite
Broken
disoriented
Cleavage
measurement
BriƩle
fault
cleavage
bedding
STRUCTURE
sandstone
47m
48m
49m
50m
51m
siltstone
qtz. vein
chert
LITHOLOGY
Pyrite blebs
Visible
gold
MINERALISATION
BioƟƟc
increasing
Weak
bioƟƟc
ALTERATION
2 4
6
810
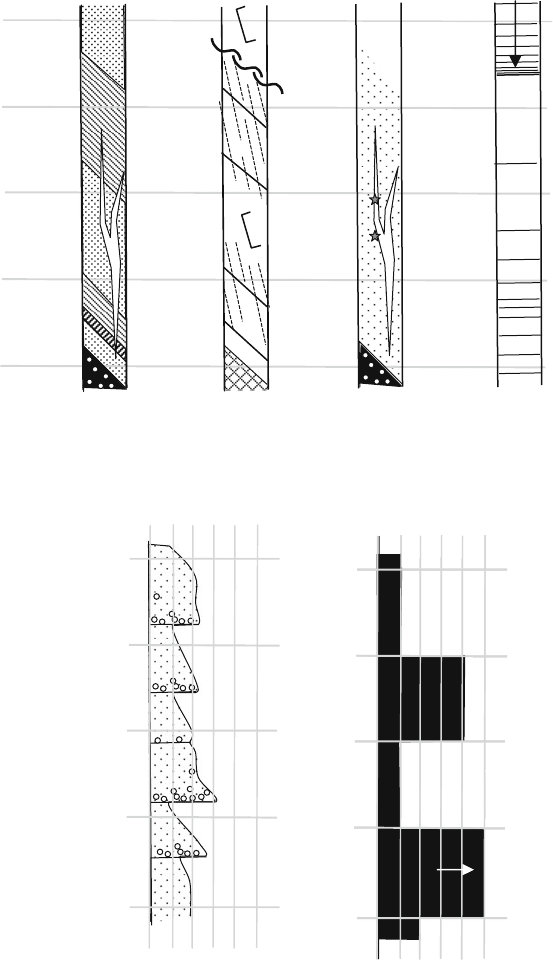
Fig. 7.17 Examples of symbols that can be used in graphical scale logging

7.8 Core Logging Systems 121
In analytical spread-sheet logging,
13
the characteristics of the rock are described
under a number of precise, prior-defined categories such as colour, grain size, min-
eral content, number and type of veins, type of alteration, intensity of alteration
etc...For descriptive purposes the rock is thus reduced (analysed) to its individual
components. These descriptive parameters form the headings for the columns of a
spread-sheet. The rock is then described under selected depth intervals that form the
rows of the s heet. To keep the log compact and precise, symbols, standard abbre-
viations and numbers are used whenever possible to record this information. This
is known as geocoding. The setting up of a system of geocoding symbols to allow
entry of geological observations into searchable geological database is an important
subject that will be further discussed in Sect. 10.2.
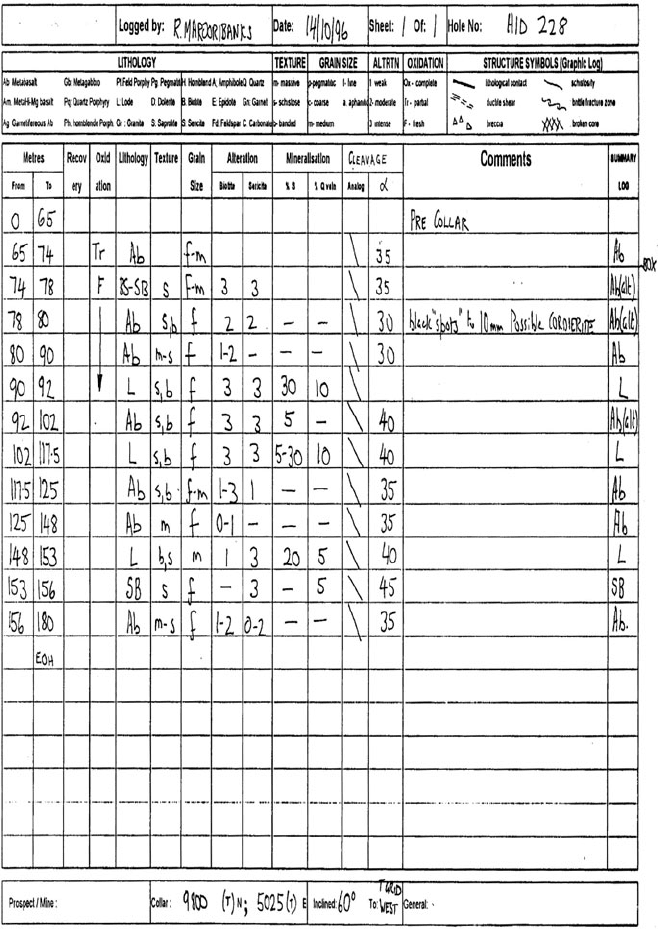
An analytical spread sheet log will look something like the example of Fig. 7.18.
This is a simplified example: an actual log would in most cases provide many more
columns allowing greater detail of description.
The great strength of this style of logging is that it precisely defines the type
of data to be recorded and presents them in a standardized and easily accessible
format. All geologists logging the same section of core should produce much the
same log. In addition, the spread-sheet log is ideal for direct computer entry of
data as observations are made, and it is compatible with electronic data storage and
geological presentation software. All the possible observations which can be made
in each column of the log can be printed out in advance, along with a bar code. If
these pages (usually laminated) are kept to hand during logging, a simple swipe of
a barcode reader can then instantly enter data into a portable notebook or palm-top
computer.
In spite of these advantages, the problems associated with spread-sheet logs can
be extreme. They set limits to the range of possible observations that can be made.
There is an obvious danger inherent in defining the categories of observation, and
the ranges within each category, before logging takes place. Even more importantly,
such a format provides no really satisfactory way to record the relationships between
the different categories of observation. In addition, the horizontal rows on the log
sheet only allow for definition of observed characteristics between precise depth
limits whereas, in reality, many features in a rock will vary in a gradual way, and dif-
ferent features that need to be described may vary at different rates, or have different
down-hole depth ranges.
On spreadsheet log forms, structural observations are usually recorded by a stan-
dard symbol for the nature or age of the structure (for example: S
0
,V
1
,F
2
etc. –
representing respectively: bedding Surface, 1st generation Vein, 2nd generation
Fold etc.). The structure symbol is combined with a column or columns where
the measured internal core angles for the structure (alpha, beta – see Sect. 7.7 and
Appendix B) are digitally recorded. Most analytical spreadsheet log forms will also
13
This type of logging has been referred to as fixed-format logging using alpha-numeric codes.
The term used here is considered to better reflect the methodology behind this system.
122 7 Diamond Drilling
Fig. 7.18 A simple example of the analytical spread sheet logging style. Observations of core
or cuttings are broken down (analysed) into a number of objective pre-defined categories (the
columns). Selected down-hole depth intervals (the rows) are then described under these categories.
Numbers, abbreviations and symbols, according to a pre-defined geocoding system, are used wher-
ever possible. The log aims to provide objective, reproducible and easy to access information and
is suitable for direct entry into a computer. The system is ideal for logging rotary percussion drill
holes, for mine drilling and for the advanced definition drilling stages of an exploration programme
7.9 Down-Hole Surveying 123
provide an unstructured “Comments” column, where verbal annotation, qualifica-
tion or comment about the structure can be added.
7.9 Down-Hole Surveying
7.9.1 Procedure
The orientation of a drill hole is defined by its azimuth and inclination (Sect. 7.2).
Azimuth and inclination, along with collar coordinates and collar height above a
datum (relative level or RL) are part of the commencing specifications for a drill
hole. However, because a string of drill rods is not rigid, the attitude of the hole can
progressively change with depth – this is called deviation. In the majority of cases
holes flatten (because of downwards drilling pressure) and swing to the right (with
the turning of the rods), but this is not always the case. Holes will tend to deflect so
as to make a greater angle with the dominant foliation (usually bedding or cleavage)
of the rock, unless the hole is already at a very low angle to that foliation, in which
case the hole will tend to deflect along the foliation. Only experience of drilling in
a particular area can allow exact prediction.
Although deviation is at most only of the order of a few degrees per hundred
metres, this is usually cumulative and, if not allowed for, the bottom of a deep hole
can be many tens of metres away from its straight-line course. The expected devi-
ation of the hole needs to be allowed for when designing a drill hole to intersect a
particular target at depth.
Generally, holes over 50 m deep need to be surveyed to determine the amount
of deviation. The instrument usually employed to do this is a specially designed
down-hole survey camera. With a single shot instrument, the camera, housed in a
special brass or aluminium case, is lowered down the hole to the required depth on
the end of the wire-line overshot. After a predetermined time, a clockwork mecha-
nism activates the camera to take a photograph of a small built-in compass card and
clinometer. On processing, a photographic record is obtained of the orientation of
the hole at that depth. With a multi-shot bore-hole camera, the mechanism can be
set to take a number of readings at predetermined times, thus allowing orientation
measurements at different depths to be obtained as the instrument is withdrawn from
the hole. An oriented hole is one in which a down hole survey has been conducted
to determine the exact azimuth and inclination of the core axis at a number of points
down the hole.
Results from the down-hole camera are generally very accurate, but care has to
be taken with the following points:
• The survey instrument should be isolated from the steel drill stem that can affect
the compass needle. The drilling rods and bits have to be pulled back from the
bottom of the hole, to allow the brass or aluminium casing of the down-hole
camera to project at least 3 m beyond them at the time of the survey,
124 7 Diamond Drilling
• Magnetic rock units may affect the compass. Such effects can usually be spotted
if one azimuth reading is out of phase with measurements on either side. This
reading should be discarded.
• If long sections of the hole are magnetic then the magnetic-field based down-hole
survey camera cannot be used for azimuth determinations. In this case it may be
possible to measure the attitude of the hole from the angle that the core makes
with known planar features of the rocks, such as bedding or cleavage. Failing
that, it is possible to orient holes using gyroscope-based instruments, but these
are not always readily available and are generally expensive.
• Do not use steel-jacketed batteries to power the survey instrument as these are
magnetic and can affect the compass.
When drilling in a new area, surveys should initially be carried out every 30–50 m
down hole, but if experience indicates that there is no strong deviation, this inter-
val may be subsequently increased. Drillers carry out the down-hole survey on the
instruction of the geologist.
As soon as they are obtained, the down-hole survey data should be used to con-
struct a section and plan view of the hole (see below, Sect. 7.9.2). By doing this, the
progress and effectiveness of the hole in reaching the planned target can be moni-
tored. If strong deviations are encountered, the driller can be alerted to the problem,
and it may be possible to take corrective action.
7.9.2 Using Down-Hole Survey Data to Plot Sections and Plans
Nowadays, once down-hole survey data have been entered into a computer, the task
of plotting the trace of the hole onto a section or a plan is usually taken care of
by one of the many mining/exploration software programs. However, in first phase
exploration drilling, plotting geological observations on a daily basis usually means
that the geologist’s working section will have to be plotted by hand. How to do this
is set out below.
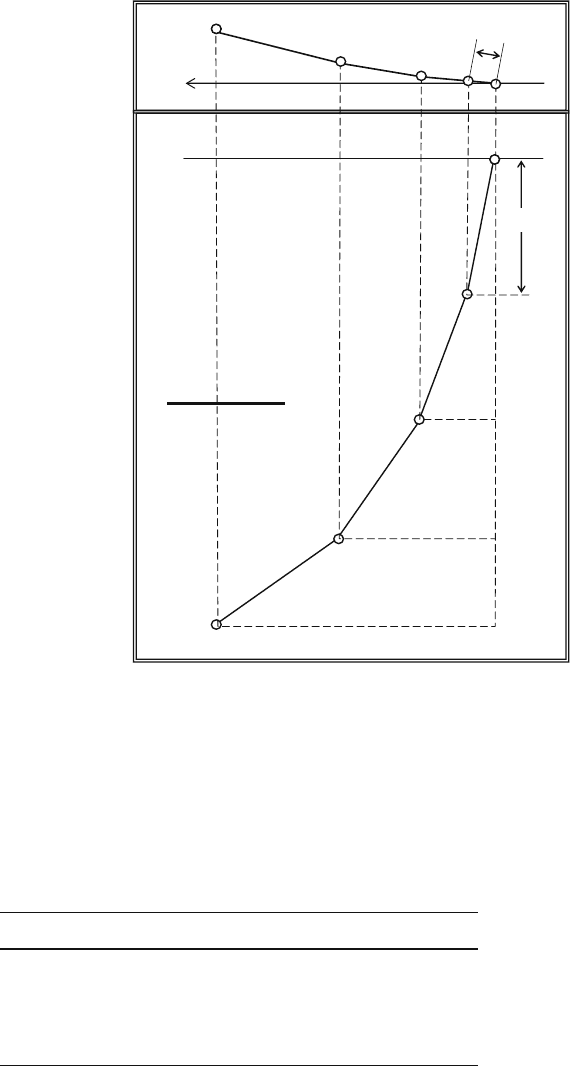
Changes in inclination and azimuth record a downwards spiralling of the hole.
This appears as a curved trace on both plan and section views of the hole (Fig. 7.19).
The curved trace on plan view means that data have to be projected horizontally to
create the drill section. However in the early stages of exploration drilling, where the
exact position (i.e. to the nearest few metres) of the hole in space is not especially
relevant, changes in azimuth can usually be ignored and it is only necessary to plot
a section of the hole recording changes in inclination. A section like this is quick
and easy to draw and, provided changes in azimuth are not too extreme, is adequate
for most initial plotting and interpretation of geology.
The effects of deviation are progressive, so with deep holes (say, over 300 m
depth), particularly where large azimuth deviations are encountered (more than 5
◦
per 100 m), the simple drill section plot described below will tend to be increas-
ingly inaccurate and a plotting procedure that allows for the simultaneous changes
7.9 Down-Hole Surveying 125
1
1
2
3
4
5
2
3
4
5
270°
D
PLAN VIEW
SECTION VIEW
V
50 METRES
Fig. 7.19 How to prepare an
exact drill section and plan
from the results of down-hole
orientation surveys. The plot
illustrated is based on the
survey data of Table 6.1
in inclination and azimuth is necessary. This more complicated procedure will also
be necessary if the trace of a hole has to be projected orthogonally on to any section
that is at an angle to the standard drill section. Both the simple (but approximate),
and the more complex (but exact), procedures for plotting drill sections and plans
are described below, using the set of hole survey data in Table 7.1.
Table 7.1 Down-hole survey data
Survey point Depth (m) Inclination (
◦
) Azimuth (
◦
)
1 0 70 270
2 52 66 280
3 106 64 288
4 160 62 290
5 205 58 296
126 7 Diamond Drilling
7.9.2.1 Plotting an Approximate Section
1. From the surface (Survey Point 1) to Survey Point 2 at 52 m down hole depth,
the hole flattened from 70 to 66
◦
The average inclination for this sector of the
hole is therefore 68
◦
.
2. Using an appropriate scale, a point is plotted on the section representing 52 m
from the starting point (hole collar) at an angle from the horizontal of 68
◦
.
3. In a similar manner, Survey Point 3, at 106 m down hole, is 54 m (106–52 m)
from Point 2 at an inclination of 65
◦
(the mean of 66 and 64
◦
); Point 4 is 54 m
from Point 3 at an inclination of 63
◦
, and so on to the end of the hole. A smooth
curve joining the plotted points will be a close approximation to the actual trace
of the hole.
4. In this example, ignoring the azimuth variation means that there is a progressive
error in the position of the hole on the drawn section which amounts to around 5
m by the bottom of the hole (10 mm at 1:500 scale).
7.9.2.2 Plotting an Exact Plan and Section
1. On the same sheet, draw both the plan and section views of the hole, with the
collar position on plan and section vertically aligned on the page (see Fig. 7.19).
Sections can now be drawn at any angle required to the trace of the hole; the one
illustrated is parallel to the starting azimuth of the hole.
2. From Survey Point 1 (the collar of the hole) to Survey Point 2, the down-hole
distance is 52 m, the mean azimuth is 275
◦
(the average of the starting azimuth
and final azimuth), and the mean inclination is 68
◦
.
3. Using trigonometry, the horizontal (D) and vertical (V) distances between Points
1 and 2 are calculated:
D = 52 × cos 68
◦
= 19.48 m
V = 52 × sin 68
◦
= 48.2 m
4. Using a suitable scale, on plan view, plot Point 2 at 19.48 m from Point 1 at a
bearing of 275
◦
.
5. On the plan, draw a line from Point 2 to intersect the trace of the proposed section
at right angles. From this intersection point, draw a vertical line down the sheet
and across the section below.
6. Survey Point 2 is now plotted on the section where the line marking 48.2 m
vertically below surface intersects the vertical line projected from the plan view
above. The same scale is used for plan and section.
7. The same procedure is used for plotting each successive down-hole survey point.
A smooth curve through the points will give an accurate trace of the drill hole on
plan and section.
7.11 Sampling and Assaying 127
7.10 When Should Core Be Oriented?
Ten or more years ago, at the time the first edition of this book was published,
orienting core was uncommon, and a large amount of useful data on the orientation
of structures was lost. Today, core is often routinely oriented, at considerable cost
in time and money, even in cases where there is really no need for this procedure. It
is therefore useful to consider the circumstances when core orientation is required.
When drilling in an area of good outcrop, where the rocks have a simple pervasive
fabric of constant known attitude, it is generally not necessary to orient drill core.
The orientation of the known structures in the core (for example, regular bedding or
cleavage surfaces) can be used to orient the core, thus enabling other features whose
orientation is not known (for example mineral veins) to be measured. How to do this
is dealt with in Appendix B.
When drilling in an area of poor or no outcrop, the first few drill holes may be
all that is necessary too establish the orientation of a dominant fabric and make
orienting subsequent holes unnecessary. However, where structure is complex and
variable, it may be necessary to orient the core from every hole drilled in the area.
Core orientation is carried out on a drilled run or barrel of core. If the recovered
rock is relatively unbroken, with little core loss, and the broken ends of the core
pieces can be matched and reassembled across several barrels of core, it may only
be necessary to orient every second or third run of core. Where there is broken
core, core loss and difficulty in achieving good orientation marks, it is necessary to
attempt to orient every barrel of core. However, since the decision to orient a run
of core has to be made before it is pulled from the ground, and the condition of
the core is generally only known after it has been extracted, it is always better to
err on the safe side and attempt orientation of as many barrels as possible. Once a
few holes have been drilled, knowledge of the condition of the core should enable a
decision to be made on how frequently it will be necessary to attempt orientation of
subsequent holes.
Oriented core requires special handling and marking out procedures before
the geologist is able to measure structure. These procedures are explained in
Appendix B.
7.11 Sampling and Assaying
Assaying diamond drill core during the early phases of exploration has two pur-
poses. The first is to provide an indication of whether potentially mineable grades
are present. The second is to give an understanding of where economically signifi-
cant elements are reporting in the system, so that controls on ore distribution can be
defined and understood. This understanding is necessary in order to target new holes.
In first-phase exploration drilling, the intervals selected for sampling should be
determined by geology. The intervals are selected by the geologist and marked on

128 7 Diamond Drilling
to the core at the time of logging. The boundaries of the intervals should correspond
as far as possible to mineralization boundaries that the geologist either observes or
postulates. The key rule is this: each sample is selected to answer a question that the
geologist has about the core. Only where core to be sampled is relatively uniform
should regular samples of predetermined length be taken.
Where core has been lost, it is important that sample intervals do not span the
zones where the loss has taken place. To mix a sample of, say, 60% recovery with a
sample of 100% recovery is to contaminate good sample data with bad. On the other
hand, there is potential information of value to be had by comparing the assays for a
sample with good core recovery with that for a similar sample for which the recovery
is poor. This can only be done if they are kept separate.
The decision to use half, quarter or whole core as a sample for assay depends
upon the need for a sample size adequate to overcome any nugget effects. In gen-
eral, when sampling gold prospects, the larger the sample s ize the better. However,
sampling whole core should only be undertaken as a last resort, as this destroys
the core and prevents any possibility of re-logging.
14
In general half the core, split
lengthwise, is taken for assay.
Methods of sampling core depend upon its condition. They are:
1. Knife-and fork sampling. This technique is employed where damp clays are
encountered. The material is often so soft that it can only be sampled by cutting
it lengthways with a knife.
2. Spoon sampling. If the material is badly broken, the only realistic method is to
use a spoon or trowel to collect a representative section through each chosen
interval. Split the broken core into halves lengthways with a broad-bladed spat-
ula and, whilst retaining one half with the spatula, spoon the other half into the
sample bag.
3. Core grinding. If the core is not considered sufficiently interesting to be sawn
in half, but an assay is still wanted as a check, or for a geochemical scan, then
the core grinder is a very useful tool (see Fig. 7.20). The grinder takes a shallow
shave of rock along the length of the core. This sample is much quicker and
cheaper to collect than sawing the core in half with a diamond saw.
4. Chisel splitting. Relatively homogeneous crystalline rocks such as igneous rocks
or massive metasediment (such as hornfels) can often be split lengthways with a
chisel. Special core splitters can be bought for this purpose. The method is quick
and can be employed on remote sites where no power is available for a core saw.
14
Between 1995 and 1997, at the Busang gold prospect in Indonesia, some employees of the
Canadian junior exploration company Bre-X carried out one of the most massive frauds in mining
history. On an almost industrial scale, entire drill core was crushed, salted with extra gold, before
being sent for assay. The Bre-X stock price soared from a few cents to over $285. The lack of
retained core to compare with the fraudulent assays meant that the few honest explorationists who
made it to the remote jungle site were unable to recognise the deception (see Gould and Willis,
1997; Hutchison, 1998).