Malomed B.A. Soliton Management in Periodic Systems
Подождите немного. Документ загружается.

3.2. SOLITONS IN THE SPLIT-STEP MODEL
59
l.t
1.2
c
1
o
*;
o
(A
0)
^
*-
•S0.8
a)
TJ
3
±;
D.
E
"0.6
^
«=
<]>
£
<
0.4
0.2
n
y^
" " "
/
T
\ Energy remained
/
V
T
\
/
"
/
/
~--.^
T*
"--
-
-
-
-
3
4 5
Ti-the
initial amplitude
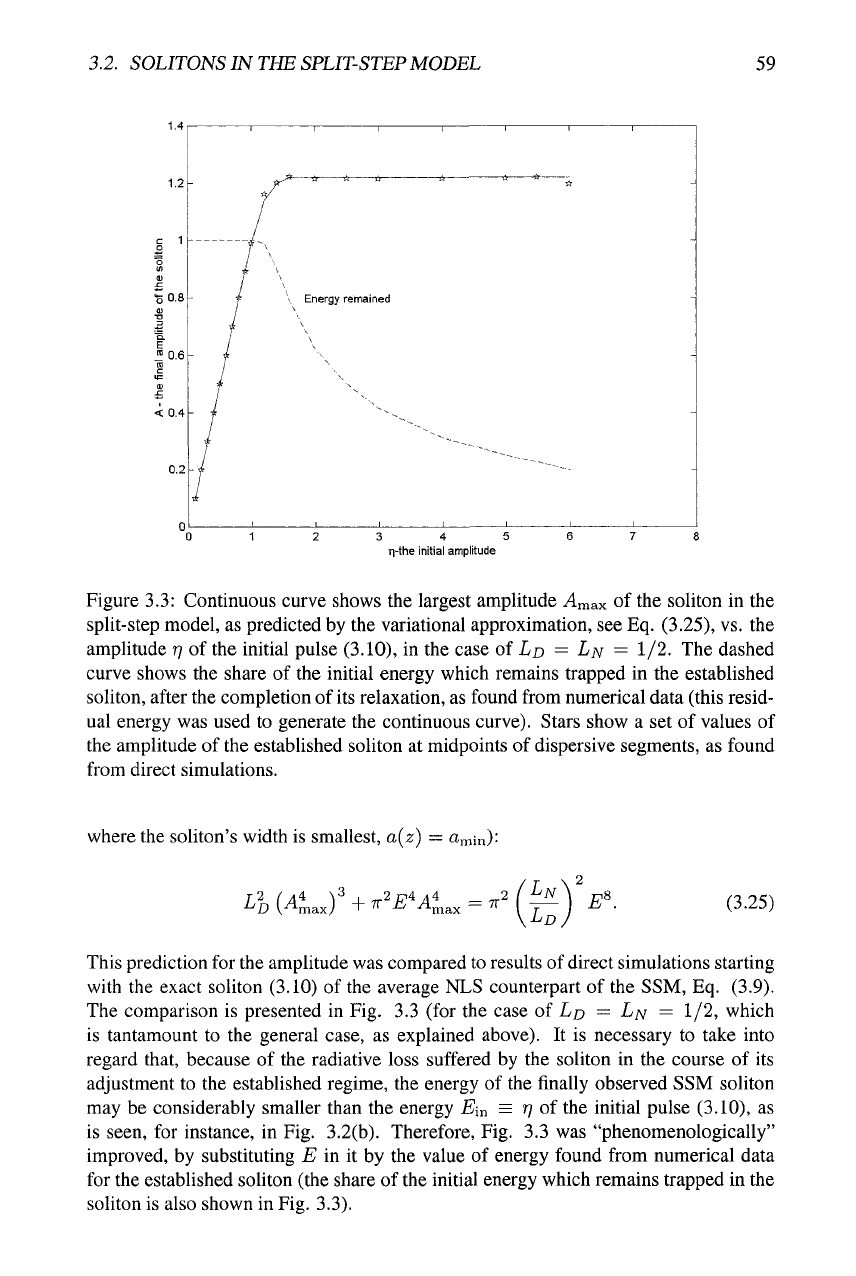
Figure 3.3: Continuous curve shows the largest amplitude ^max of the soli ton in the
split-step model, as predicted by the variational approximation, see Eq. (3.25), vs. the
amplitude
ri
of the initial pulse (3.10), in the case of LD = LN = 1/2. The dashed
curve shows the share of the initial energy which remains trapped in the established
soliton, after the completion of its relaxation, as found from numerical data (this resid-
ual energy was used to generate the continuous curve). Stars show a set of values of
the amplitude of the established soliton at midpoints of dispersive segments, as found
from direct simulations.
where the soliton's width is smallest, a(z) = amin):
Ll
(At
2^4 A4
+
TT'E^'A:
LD
(3.25)
This prediction for the amplitude was compared to results of direct simulations starting
with the exact soliton (3.10) of the average NLS counterpart of the SSM, Eq. (3.9).
The comparison is presented in Fig. 3.3 (for the case of LD = LN = 1/2, which
is tantamount to the general case, as explained above). It is necessary to take into
regard that, because of the radiative loss suffered by the soliton in the course of its
adjustment to the established regime, the energy of the finally observed SSM soliton
may be considerably smaller than the energy Em = rj of the initial pulse (3.10), as
is seen, for instance, in Fig. 3.2(b). Therefore, Fig. 3.3 was "phenomenologically"
improved, by substituting E in it by the value of energy found from numerical data
for the established soliton (the share of the initial energy which remains trapped in the
soliton is also shown in Fig. 3.3).
60 SPLIT-STEP MODEL
A noteworthy feature of the dependence of the SSM-soUton's amplitude vs. the
ampHtudeof
the
initial pulse is saturation obvious in
Fig.
3.3. If one launches the pulse
with a large amplitude, it quickly sheds off
a
considerable part of
its
energy in the form
of radiation
waves,
and relaxes to the eventual form. Note that the characteristics shown
in Fig. 3.3, are universal, as they do not depend on any remaining free parameter.
A feature which is not predicted by VA is termination of the characteristics: the
curve in Fig. 3.3 is not aborted arbitrarily, but ends at a point beyond which no stable
SSM soliton is produced by simulations. It was observed that, past the termination
point, the solitons disappear abruptly.
3.2.4 Diagram of states for solitons and breathers in the spHt-step
system
General results characterizing the dynamics of solitons and quasi-solitons in the SSM
can be collected from systematic simulations starting with a pulse (3.11), which admits
an arbitrary relation between the amplitude and width (controlled by the parameter W),
rather than locking them to the form of the average soliton (3.10). It is well known that,
in the case of the ordinary NLS equation, the evolution problem for the initial condi-
tion (3.11) has an exact analytical solution, in terms of the inverse scattering transform
[154].
The latter solution demonstrates that the configuration (3.11) generates no soli-
ton iiW < 1/2; in the interval 1/2 <W< 3/2, a fundamental soliton is generated,
together with some amount of radiation; and higher-order n-solitons are produced in
intervals n
—
l/2<W<n4-l/2 (which is also accompanied by emission of radi-
ation, unless W is an integer). The higher-order solitons, unlike the fundamental one,
look like breathers, demonstrating persistent internal vibrations (see the expression for
the 2-soliton given in Eq. (1.15).
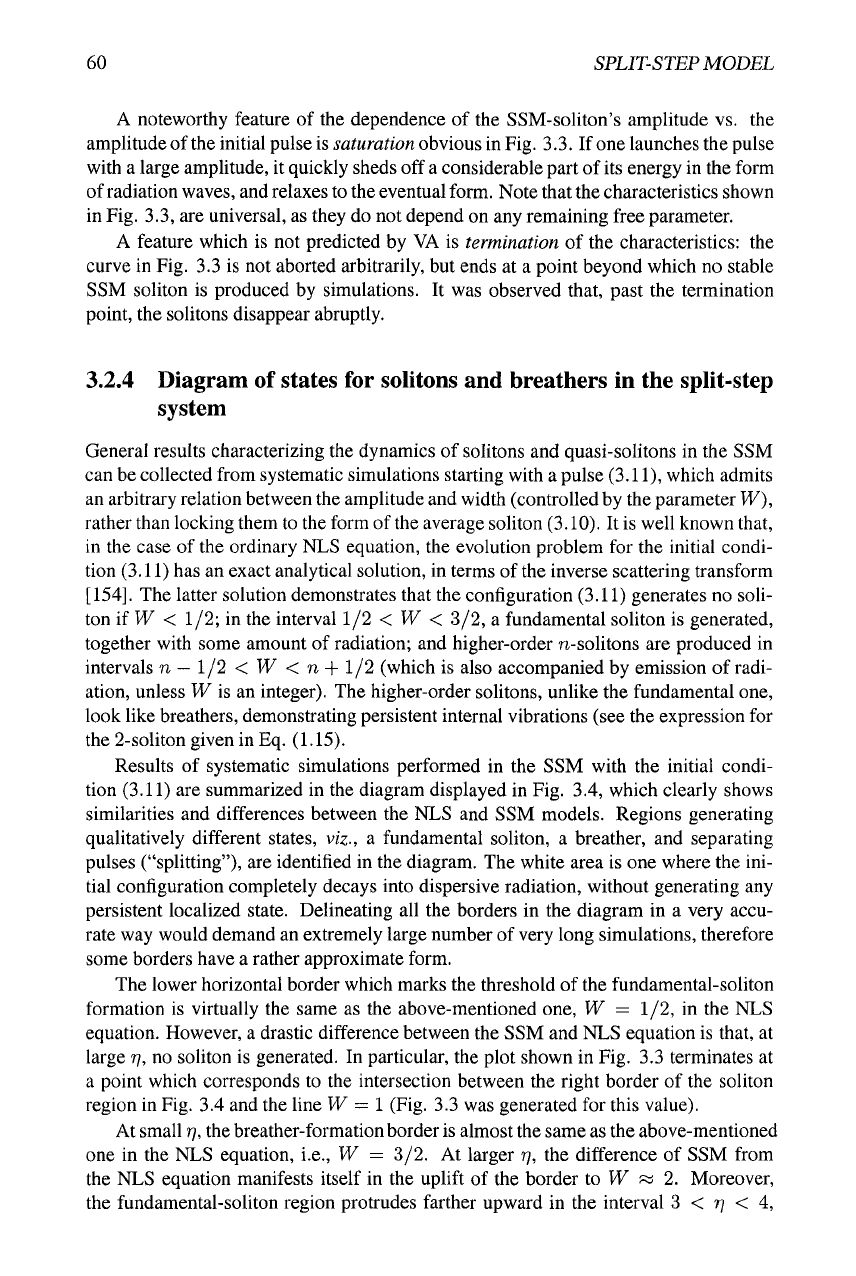
Results of systematic simulations performed in the SSM with the initial condi-
tion (3.11) are summarized in the diagram displayed in Fig. 3.4, which clearly shows
similarities and differences between the NLS and SSM models. Regions generating
qualitatively different states, viz., a fundamental soliton, a breather, and separating
pulses ("splitting"), are identified in the diagram. The white area is one where the ini-
tial configuration completely decays into dispersive radiation, without generating any
persistent localized state. Delineating all the borders in the diagram in a very accu-
rate way would demand an extremely large number of very long simulations, therefore
some borders have a rather approximate form.
The lower horizontal border which marks the threshold of the fundamental-soliton
formation is virtually the same as the above-mentioned one, W = 1/2, in the NLS
equation. However, a drastic difference between the SSM and NLS equation is that, at
large
ry,
no soliton is generated. In particular, the plot shown in Fig. 3.3 terminates at
a point which corresponds to the intersection between the right border of the soliton
region in Fig. 3.4 and the line W = 1 (Fig. 3.3 was generated for this value).
At small
rj,
the breather-formation border
is
almost the same as the above-mentioned
one in the NLS equation, i.e., W = 3/2. At larger
rj,
the difference of SSM from
the NLS equation manifests itself in the uplift of the border to W » 2. Moreover,
the fundamental-soliton region protrudes farther upward in the interval 3 < 77 < 4,
3.2. SOLITONS IN THE SPLIT-STEP MODEL
61
Solitons
ri
Figure 3.4: The diagram showing different outcomes of the evolution of the initial
pulse (3.11) in the split-step model with LD = LN = 1/2. In white area the initial
pulse completely decays into radiation. The dashed horizontal line, W = 3/2, is the
exact breather-generation threshold in the corresponding averaged NLS equation (3.9).
62
SPLIT-STEP MODEL
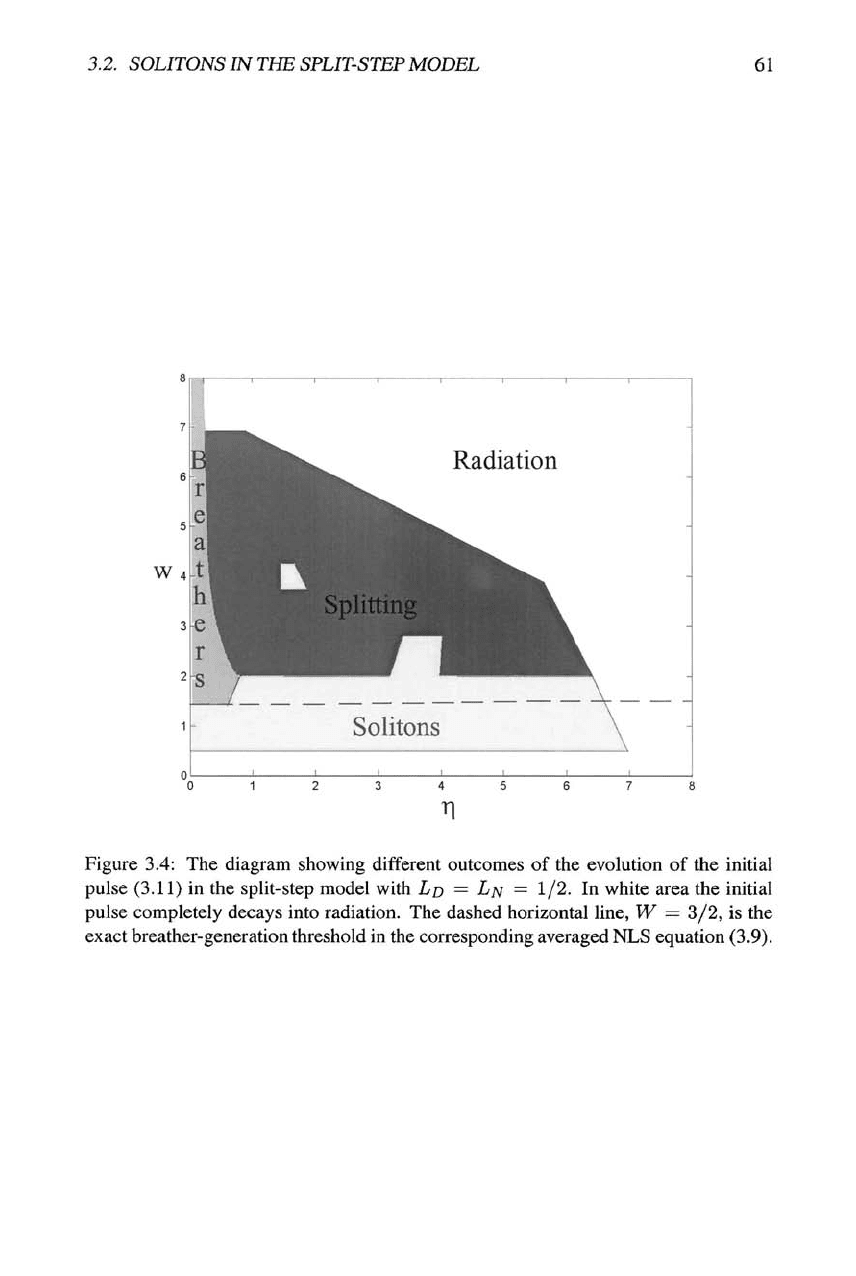
Figure 3.5: A typical example of splitting of the initial pulse (3.11), with
77
W
—
3, into a set of stable separating breathers.
2 and
and a conspicuous stability island for the fundamental solitons is found around rj —
1.5, W — L The borders shown in Fig. 3.4 were found with limited accuracy; quite
plausibly, smaller stability islands can be found inside the splitting region.
Splitting of the initial pulse into several moving ones (actually, they are breathers),
which takes place in the large region in Fig, 3.4, is another drastic difference from the
NLS equation, in which the chirpless initial pulse (3.11) never splits. Varying
r]
and
W, one may observe splitting into up to seven moving breathers (if the number of the
splinters is odd, the central one remains quiescent). A typical example of the splitting
into four fragments is displayed in Fig. 3.5. The splitting of a moderately broad initial
pulse may be prevented if chirp of a proper sign and magnitude is added to it [50].
In this case, the pulse eventually transforms itself into a single soliton, which keeps
almost all the initial energy and has almost no chirp. This property is another essential
difference of SSM from the NLS equation.
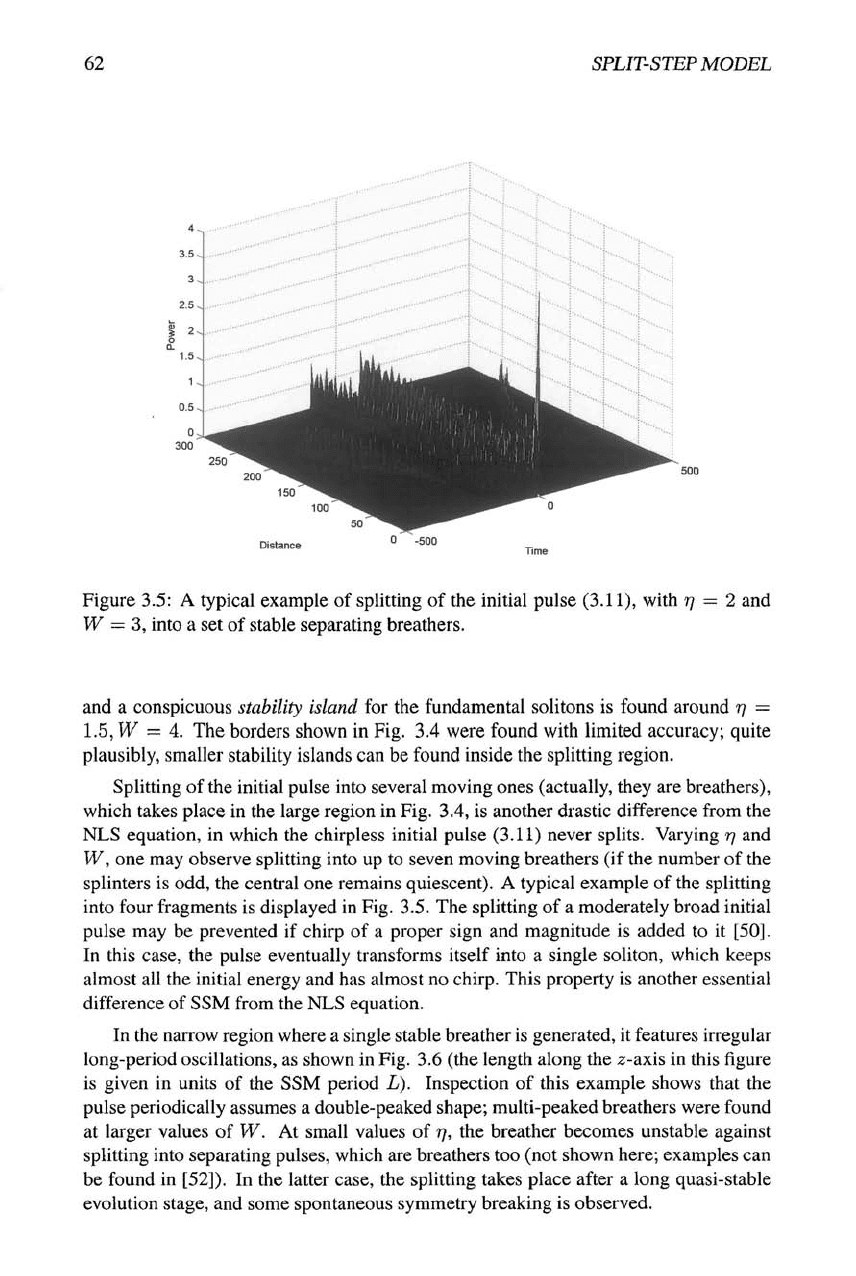
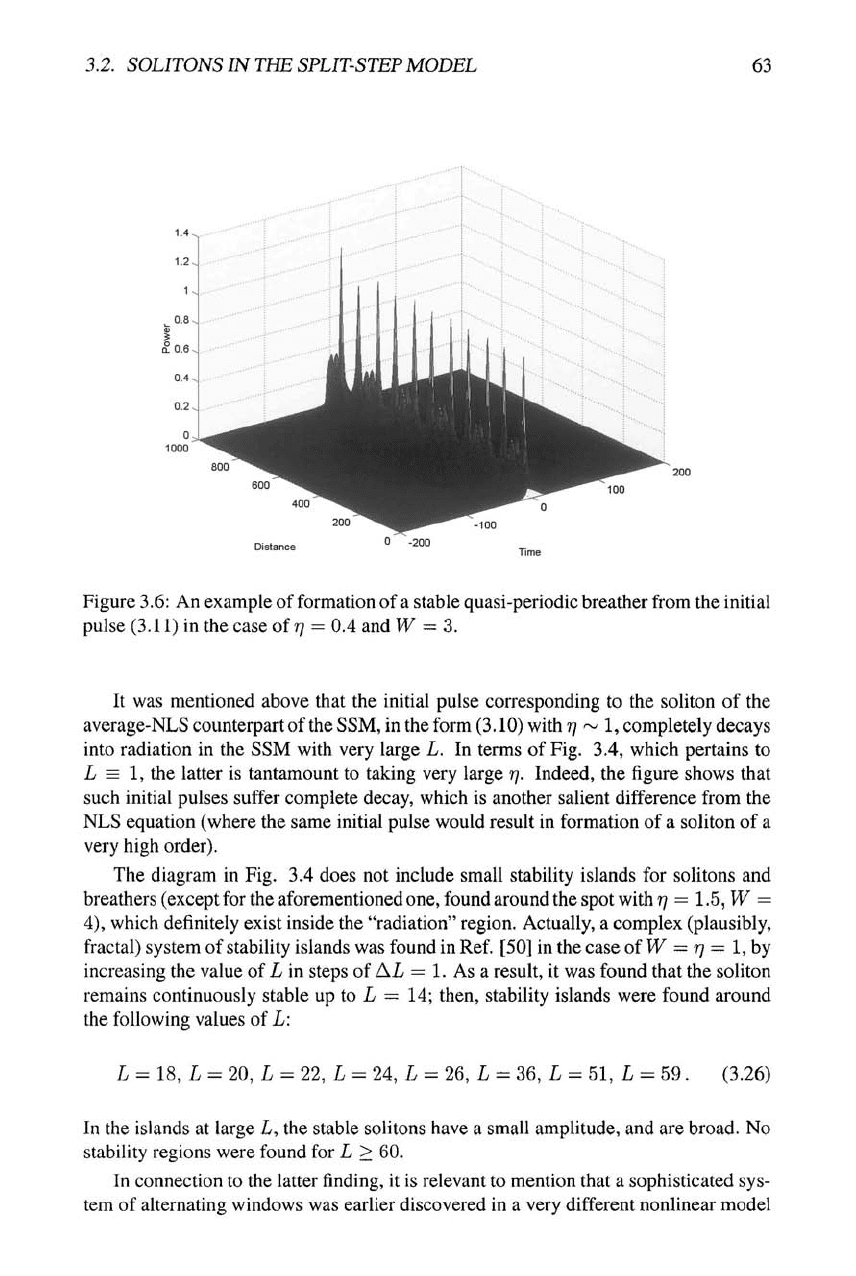
In the narrow region where a single stable breather is generated, it features irregular
long-period oscillations, as shown in Fig. 3.6 (the length along the x-axis in this figure
is given in units of the SSM period L). Inspection of this example shows that the
pulse periodically assumes a double-peaked shape; multi-peaked breathers were found
at larger values of W. At small values of
77,
the breather becomes unstable against
splitting into separating pulses, which are breathers too (not shown here; examples can
be found in [52]). In the latter case, the splitting takes place after a long quasi-stable
evolution stage, and some spontaneous symmetry breaking is observed.
3.2. SOLITONS IN THE SPLIT-STEP MODEL
63
Figure 3.6: An example of formation of
a
stable quasi-periodic breather from the initial
pulse (3.11) in the case of
7/
= 0.4 and W = 3.
It was mentioned above that the initial pulse corresponding to the soliton of the
average-NLS counterpart of the SSM, in the form (3.10) with
77
~ 1, completely decays
into radiation in the SSM with very large L. In terms of Fig. 3.4, which pertains to
L = 1, the latter is tantamount to taking very large ij. Indeed, the figure shows that
such initial pulses suffer complete decay, which is another salient difference from the
NLS equation (where the same initial pulse would result in formation of a soliton of a
very high order).
The diagram in Fig. 3.4 does not include small stability islands for solitons and
breathers (except for the aforementioned
one,
found around the spot with
7]
= 1.5, W =
4),
which definitely exist inside the "radiation" region. Actually, a complex (plausibly,
fractal) system of stability islands was found in Ref. [50] in the case ofW = r]= 1, by
increasing the value of L in steps of AL = 1. As a result, it was found that the soliton
remains continuously stable up to L = 14; then, stability islands were found around
the following values of L:
L = 18, L = 20, L = 22, L = 24, L = 26, L = 36, L = 51, L = 59. (3.26)
In the islands at large L, the stable solitons have a small amplitude, and are broad. No
stability regions were found for L > 60.
In connection to the latter finding, it is relevant to mention that a sophisticated sys-
tem of alternating windows was earlier discovered in a very different nonlinear model
64 SPLIT-STEP MODEL
based on the Goldstone equation (also called
(f)'^
equation) for a real function
(l){x,
t),
4>tt
-
(l>xx
-
(l^
+'P'^
= 0, (3.27)
which has exact solutions in the form of topological solitons (kinks) that may move at
an arbitrary velocity c, within the interval
— 1
< c < +1,
(
X —
ct \
, ,, , (3.28)
^/2{l-c^)J
cr = ±1 being the polarity of the kink. Numerical simulations of collisions between
the kinks with opposite polarities and opposite velocities ±c in Eq. (3.27) had revealed
that the collision results in annihilation of the kinks into a breather (which is subject to
subsequent slow radiative decay) if c is very small. On the other hand, the collision is
quasi-elastic (i.e., the kinks pass each other with almost no loss) if
c
is sufficiently close
to 1. Between these two cases, a system of alternating windows of annihilation and
quasi-elastic collisions was found
[36].
A semi-qualitative explanation
to
these findings
was based on the collision-induced exchange between the original kinetic energy of the
kinks,
and the energy absorbed by the internal oscillatory degree of freedom, which the
kink is known to have in this model (internal oscillations are excited in both kinks as
a result of the collision). A similar fine system of alternating windows was found,
and a similar explanation to it was proposed, for kink-antikink collisions in the so-
called double sine-Gordon equation [37]. It may happen that the SSM soliton also has
an internal degree of freedom (note that the ordinary NLS soliton does not have any
intrinsic mode). However, the latter issue has not been explored.
3.3 Random split-step system
As was mentioned above in connection to the random DM systems, the study of het-
erogeneous nonlinear models in which cells alternate not periodically but randomly
(i.e.,
the length of the cell is picked randomly from some interval, such as (2.32)) is an
issue of significant interest to applications, and in its own right as well. The random
version of the SSM was considered in work [52]. To pose the random-SSM model, it
was assumed that the lengths Ljv and LD of the nonlinear and dispersive segments are
not fixed as above (for instance, as LN = LD = 1/2), but are taken at random from
an interval Lmin < L^
—
Lo = L/2 < Lmax (note that it is assumed that the lengths
Ljv and Ljj remain mutually locked in each cell; if, instead, they are chosen at random
and independently from each other, no stable soliton can be found in the system).
Numerous runs of simulations, performed for the random model at various values
of parameters, have yielded a simple conclusion: if the ratio Lmax/Lmm is not very
large (for instance, if Lma,x/Lmm = 5), stable SSM solitons persist in the random
system, and, on the average, they seem almost identical to the solitons in the regular
(strictly periodic) SSM model, with L simply equal to the median value, L = (1/2)
{Lmax + Lmin), of the random distribution. As a typical example. Fig. 3.7 displays
the evolution of the initial pulse (3.10) with
77
= 1 in the random SSM with Lmin = 1,
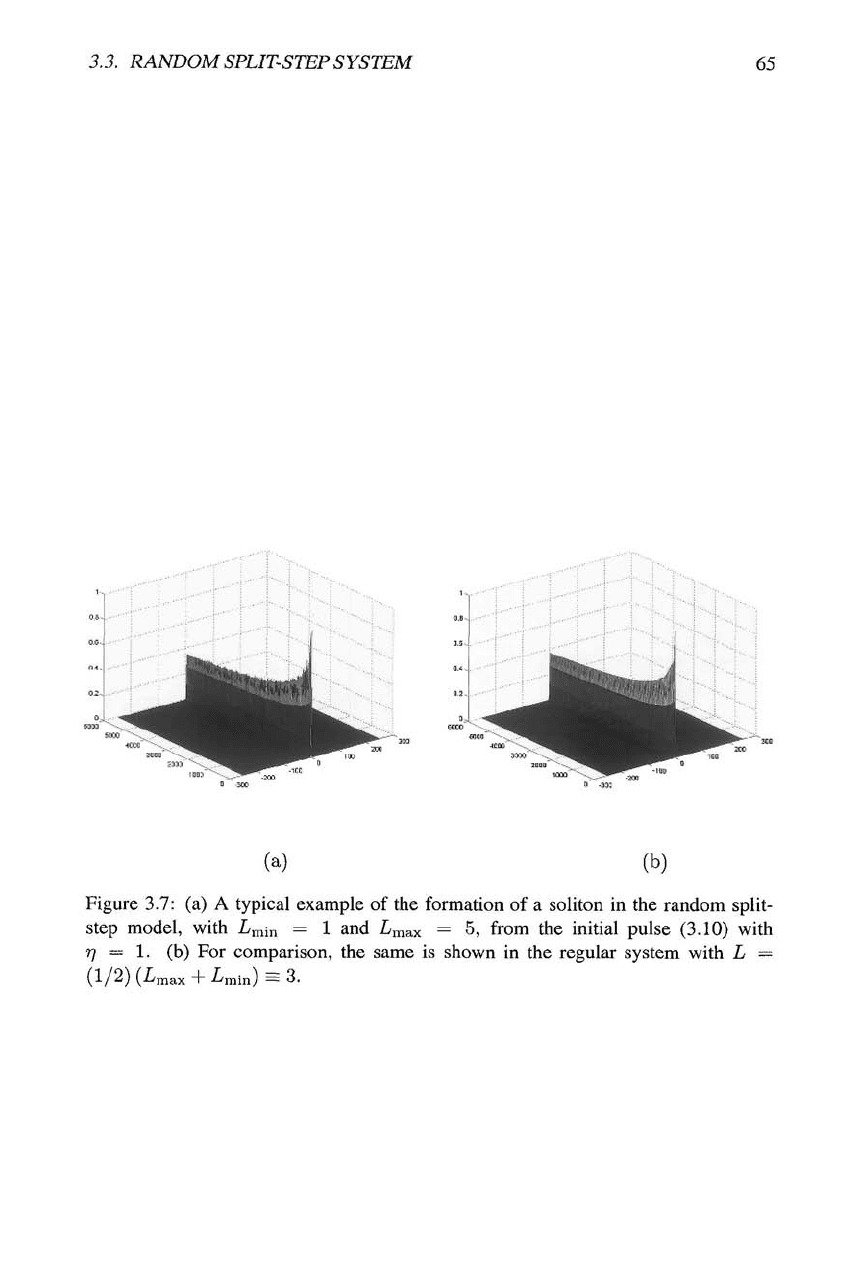
3.3. RANDOM SPLIT-STEP SYSTEM
65
--•"•"!'• --..^
...
r'-....i
'•••-:..
...-.•!•., : ;'-..j • '""h
rl
:'"t"-
^,J ;. jj...
'"•••'4..
'-,
CJv
3.5-
Pi
cccc
..-I--'""
,..,,--r'"" i
""••"".•••-
"••• _,^
•) '^-i
[••••jf
!•..
(a)
(b)
Figure 3.7: (a) A typical example of the formation of a soliton in the random split-
step model, with Lmin = 1 and Lmax = 5, from the initial pulse (3.10) with
•q ~ I. (b) For comparison, the same is shown in the regular system with L =
(1/2) (Lmax + Lynin) = 3.
66 SPLIT-STEP MODEL
Lmax = 5, and, for comparison, the evolution of the same initial pulse in the periodic
SSM with L = L = 3.
Thus,
SSM solitons are stable against the disorder (in fact, they seem more robust,
in this sense, then the DM solitons). Moreover, Fig. 3.7 (and many more numerical
results) clearly shows that, as well as in the regular system, the soliton in the random
SSM is an effective attractor, in the sense that initial pulses whose parameters, such
as the amplitude or initial chirp, are different from those of an SSM soliton, quickly
relax to it (in particular, suppression of the initial chirp can be observed). Attractors
are typical to dissipative systems; nevertheless, in conservative nonlinear-wave systems
they are possible too, due to the effective dissipation through radiation losses.
Other properties of the solitons in the disordered SSM mode and its regular coun-
terpart were also shown to be very similar - such as the stability limits (see Fig. 3.4),
formation of breathers, etc.
3.4 A combined split-step - dispersion-management sys-
tem: dynamics of single and paired pulses
The above consideration was dealing with a limit case of the SSM, composed of
cells
in
which one segment is purely nonlinear, and the other one is purely dispersive. A natural
question is whether soliton dynamics keeps the same character in a more realistic case,
with nonzero dispersion in the nonlinear segment, and some nonlinearity in the disper-
sive one. The answer is that the transition to such a "mixed system" does not cause
any drastic change in the dynamics [53]. Actually, it is more interesting to consider
a mixed system which is constructed as a DM model with the map including an extra
segment, with strong nonlinearity and negligible GVD. As was shown in work [53],
such a three-step system, which may be regarded as a combination of SSM and DM,
produces quite interesting and promising (for applications) results, although robust RZ
pulses found in it are not true solitons. In particular, an essential advantage offered by
the combined SSM-DM system is prevention of developing the overlap between adja-
cent pulses, see below (the latter problem is known in optical telecommunications as
inter-symbol interference, or ISI). It is relevant to mention that three-step versions of
the DM provide some other assets, such as better suppression of effects of inter-channel
collision between RZ pulses (not necessarily solitons) in the WDM setting [17].
3.4.1 The model
The combined SSM-DM system is based on Eq. (1.48) with the map that involves the
piecewise-constant modulation of both /3 and 7 :
r
{/3i=0,7i}
ifO<^<Li,
{/?,7}
= <
{^2,70}
if Li < z < Li + L2, (3.29)
\ {/?3 = -/?2,7o} if Li -I- L2 < z < Li + L2 + L3.
The three-step cell (3.29) repeats itself with the period L = Li-{-L2 +
L3.
Here,7o and
7i are, respectively, the nonlinearity of the system fiber, and of the additional strongly
nonlinear segment.
3.4. A COMBINED SPLIT-STEP--DM SYSTEM 67
The latter (additional nonlinear) element may be realized in several different ways.
One possibility is to use a long segment of
a
dispersion-shifted fiber, with a usual value
of the nonlinear coefficient and very weak dispersion. Another realization may be
based on a short (less than a meter) piece of an Erbium-doped fiber, which, if prop-
erly designed and pumped, may feature the nonlinearity coefficient larger by a factor
of ~ 5-10^ than in the regular fiber. Also quite short may be a segment of a PCF
(photonic-crystal fiber), which can provide for very strong nonlinearity with diverse
arrangements of the fiber's microstructure, see paper [124] and references therein.
Moreover, the nonlinear element must not necessarily be a piece of a fiber; instead,
it may be a compact module, based on an SHG crystal, in which strong effective
x^^^
nonlinearity is induced by
x'^^^
interactions through the cascading mechanism, while
the module's GVD may be completely neglected in view of its small size (a detailed
description of the model with SHG modules is given in the following chapter, which
deals with the nonlinearity management). Loss and gain terms are not included in Eq.
(3.29),
following the usual assumption of the local compensation of the fiber loss by
lumped amplifiers.
The simulations start with the unchirped Gaussian pulse atz = 0,
uoit)
=
^oexpf-^Y
(3.30)
with the peak power
PQ
and width T. Following the analogy with the definition of the
DM strength (2.25), it is convenient to define a dimensionless nonlinearity strength of
the extra segment,
NS = jiPoLi (3.31)
(actually, it is the the nonlinear phase shift at the center of the pulse passing the non-
linear segment).
3.4.2 Transmission of an isolated pulse
The aim of the consideration of the combined SSM-DM system is not to construct a
true soliton solution, but rather to find propagation regimes for robust RZ pulses that
may outperform the operation mode with usual DM solitons. Systematic simulations of
the model with the initial condition (3.30) demonstrate that, in a broad range of param-
eter values, the propagation leads to self-compression of the pulse, with simultaneous
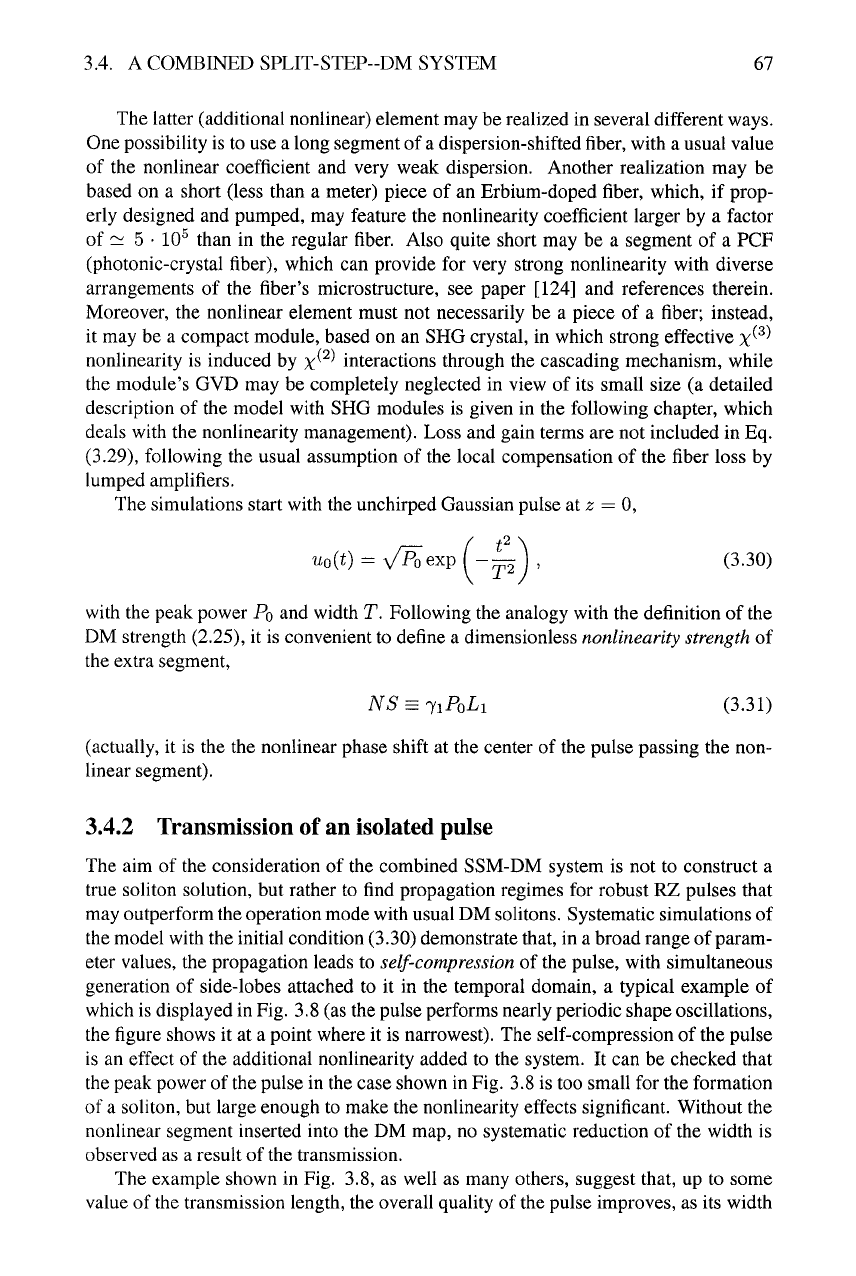
generation of side-lobes attached to it in the temporal domain, a typical example of
which is displayed in Fig. 3.8 (as the pulse performs nearly periodic shape oscillations,
the figure shows it at a point where it is narrowest). The self-compression of the pulse
is an effect of the additional nonlinearity added to the system. It can be checked that
the peak power of the pulse in the case shown in Fig. 3.8 is too small for the formation
of a soliton, but large enough to make the nonlinearity effects significant. Without the
nonlinear segment inserted into the DM map, no systematic reduction of the width is
observed as a result of the transmission.
The example shown in Fig. 3.8, as well as many others, suggest that, up to some
value of the transmission length, the overall quality of the pulse improves, as its width
68
SPLIT-STEP MODEL
2
1.8
1.6
1.4
r'-"
03
* 1
o '
a
0.8
0.6
0.4
0.2
n
XIO
-
-
-
-
-
^
-
'
/'
I
1
l\
7
/
'
A
\
' 1
1 1
H
' \
f
1
\
' '
- input
-output
\
-
-
-
-
-
-
-
-
-
-20 -5 0 5 10
Time [ps]
Figure 3.8: A typical example of comparison of
the
input Gaussian pulse and the output
one (in the present case, it was produced by the propagation through 30 maps of the
combined SSM-DM system). The side-lobes of the output pulse contain, in this case,
only 1.6% of the total energy.